ETH/USD – Ether Finds .786 Fib Support. Key Support Levels: 70, 20, 00.Key Resistance Levels: 00, 00, 90. Ethereum is now down a steep 15% on the week as it plummeted beneath 00. The coin started the week off by falling beneath a rising trend line and the 50-day MA. The trend line also formed the neck of a head and shoulders pattern that could send it as low as 00. Since breaking the 50-day MA, ETH continued to decrease until it hit yesterday’s low at 56. From there, the bulls regrouped to close the candle at 70, which is support provided by a .786 Fib. It bounced from there today as it battles to stay above 00. ETH/USD Daily Chart. Source: TradingView.ETH-USD Short Term Price Prediction Looking ahead, the first strong support lies at 70
Topics:
Yaz Sheikh considers the following as important: ETH Analysis, ETHBTC, Ethereum (ETH) Price, ethusd
This could be interesting, too:
Mandy Williams writes Ethereum Derivatives Metrics Signal Modest Downside Tail Risk Ahead: Nansen
Jordan Lyanchev writes Weekly Bitcoin, Ethereum ETF Recap: Light at the End of the Tunnel for BTC
CryptoVizArt writes Will Weak Momentum Drive ETH to .5K? (Ethereum Price Analysis)
Jordan Lyanchev writes Bybit Hack Fallout: Arthur Hayes, Samson Mow Push for Ethereum Rollback
ETH/USD – Ether Finds .786 Fib Support.
Key Support Levels: $2770, $2720, $2600.
Key Resistance Levels: $3000, $3200, $3290.
Ethereum is now down a steep 15% on the week as it plummeted beneath $3000. The coin started the week off by falling beneath a rising trend line and the 50-day MA. The trend line also formed the neck of a head and shoulders pattern that could send it as low as $2400.
Since breaking the 50-day MA, ETH continued to decrease until it hit yesterday’s low at $2656. From there, the bulls regrouped to close the candle at $2770, which is support provided by a .786 Fib. It bounced from there today as it battles to stay above $2900.
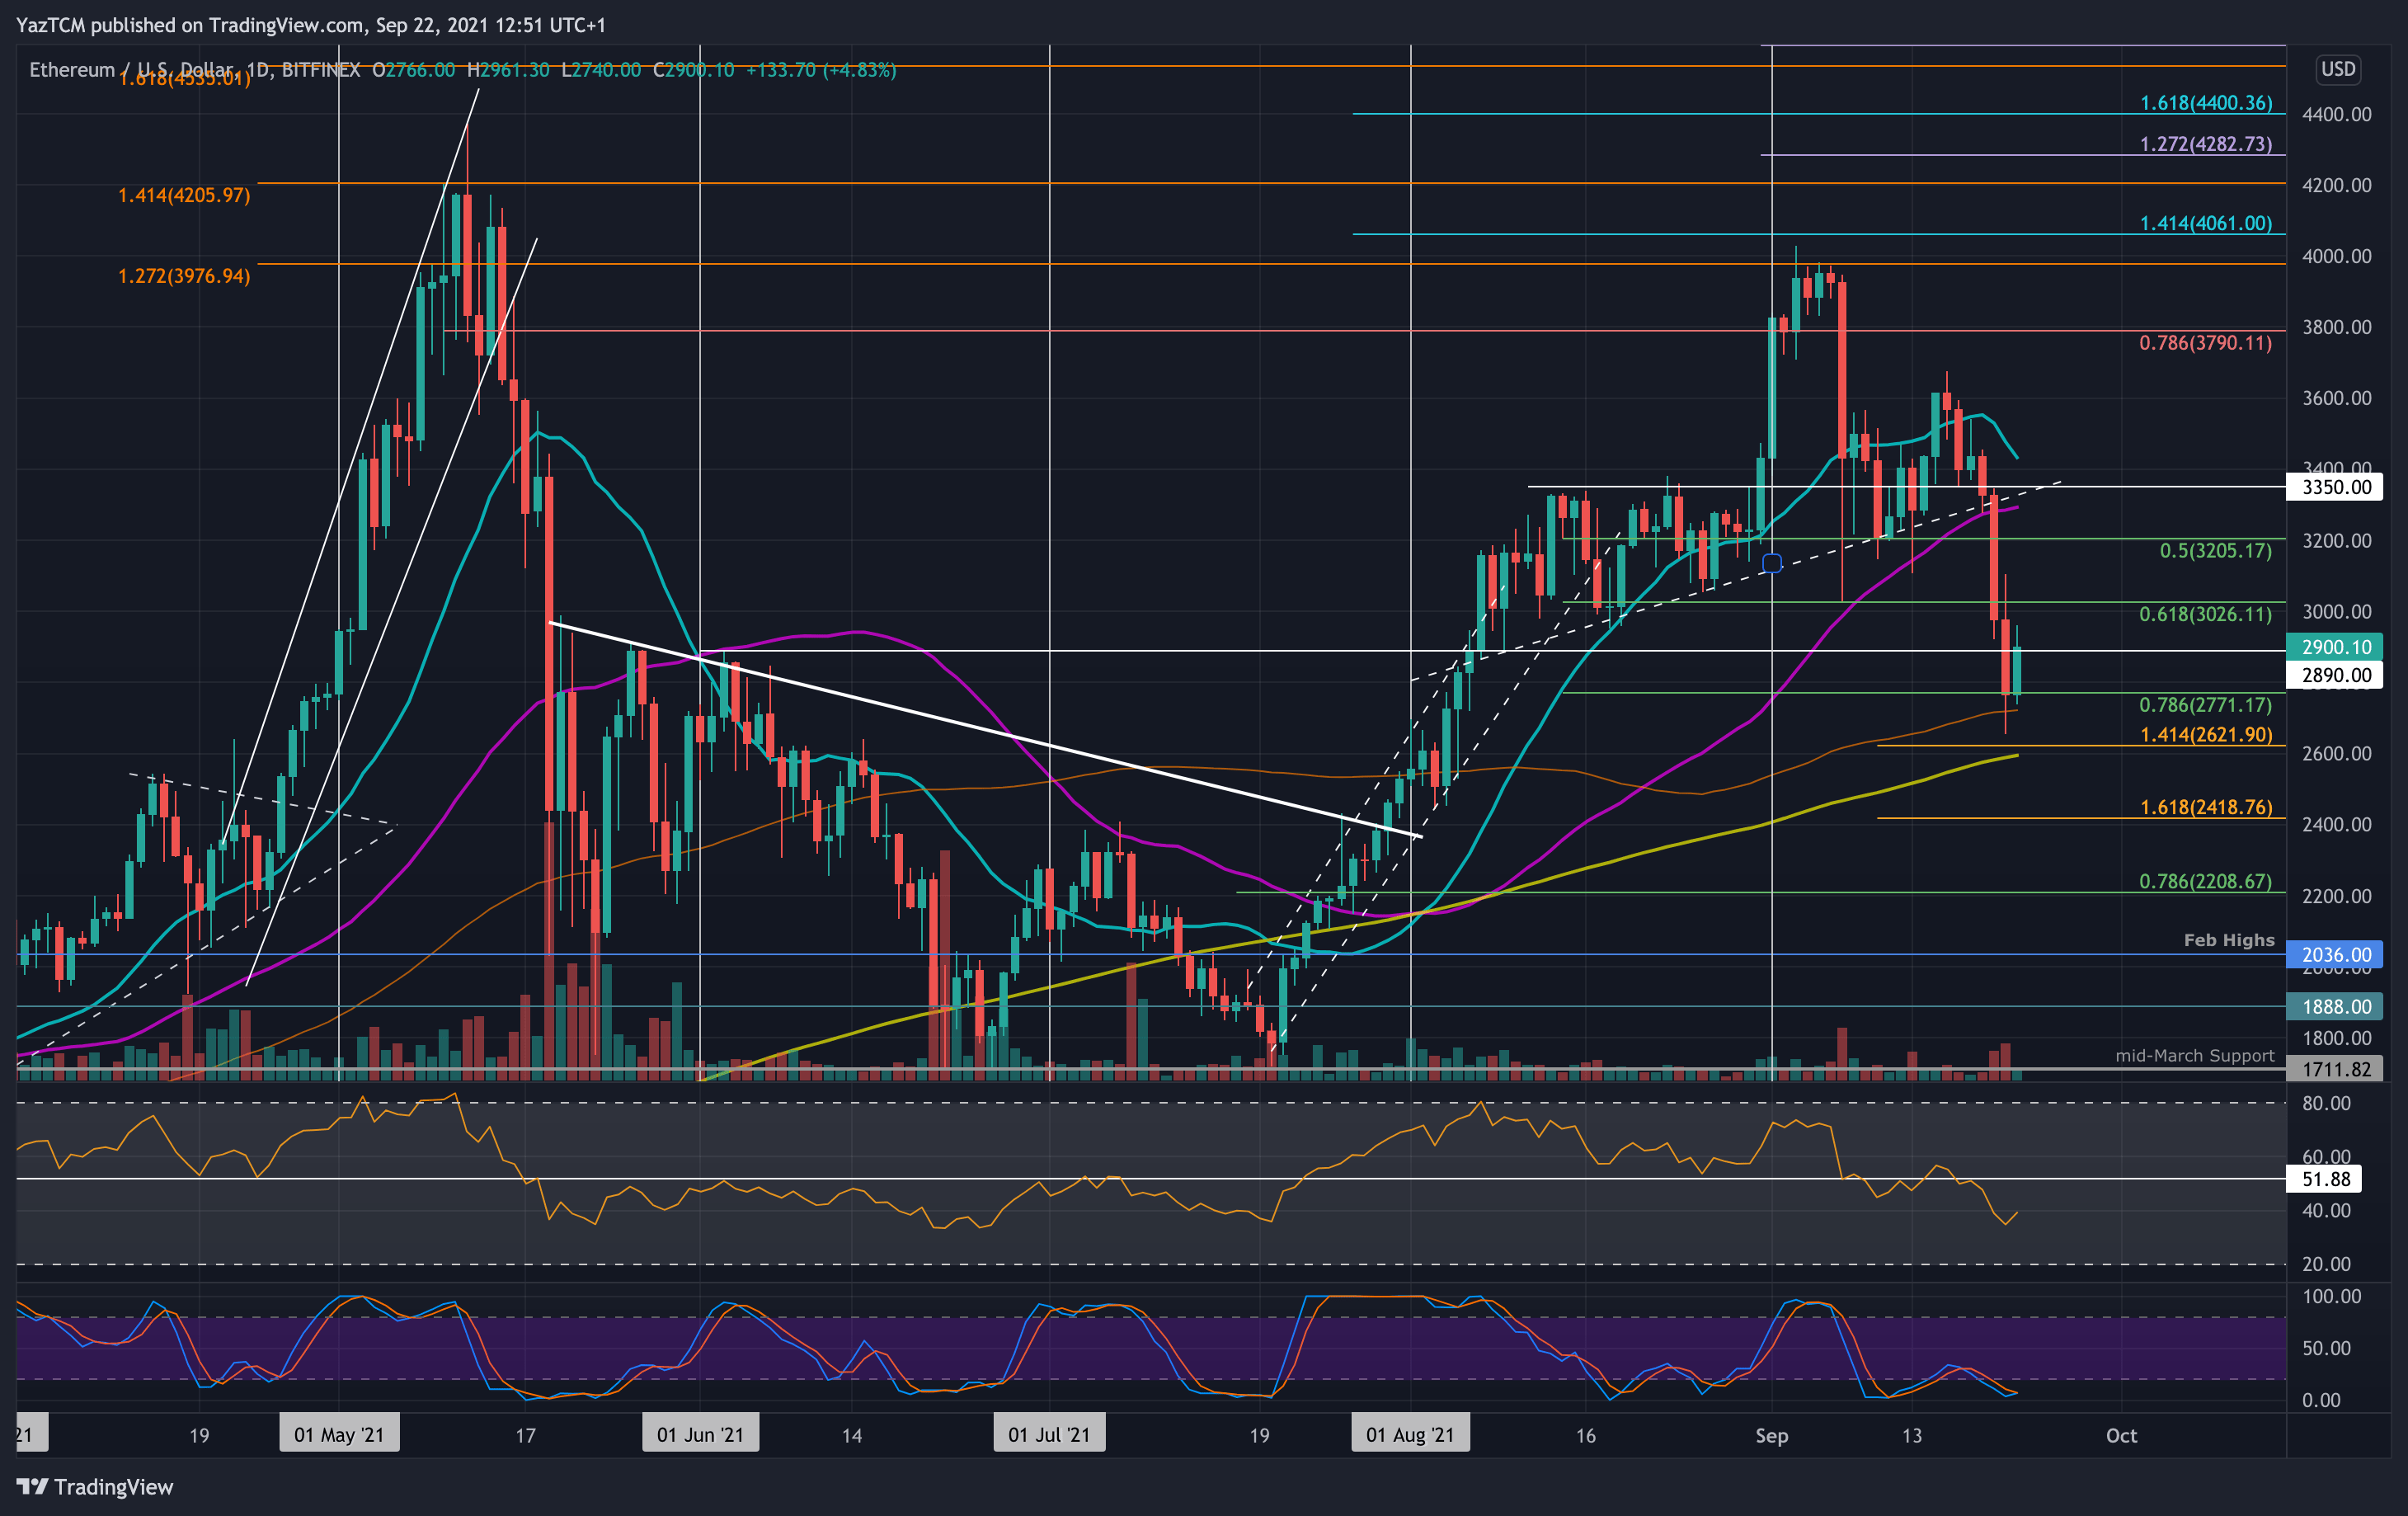
ETH-USD Short Term Price Prediction
Looking ahead, the first strong support lies at $2770 (.786 Fib). This is followed by $2720 (100-day MA), $2600 (200-day MA), and $2420 (downside 1.618 Fib Extension).
On the other side, the first resistance lies at $3000. This is followed by $3200, $3290 (50-day MA), $3350, and $3400 (20-day MA).
The RSI is beneath the midline, indicating the bears are in control of the market momentum.
ETH/BTC – ETH Falls Into July Highs
Key Support Levels: 0.068 BTC, 0.0667 BTC, 0.066 BTC.
Key Resistance Levels: 0.07 BTC, 0.071 BTC, 0.0733 BTC.
ETH also continues to decrease against BTC. On Sunday, the coin fell beneath support at 0.0711 BTC (.382 Fib) to meet 0.07 BTC (50-day MA). It continued below the 50-day MA on Monday to hit 0.0691 BTC.
Yesterday, ETH plummeted beneath 0.069 BTC to reach as low as 0.067 BTC. By the end of the day, the bulls managed to close the daily candle at 0.068 BTC. Today, ETH rebounded and is now above 0.069 BTC.
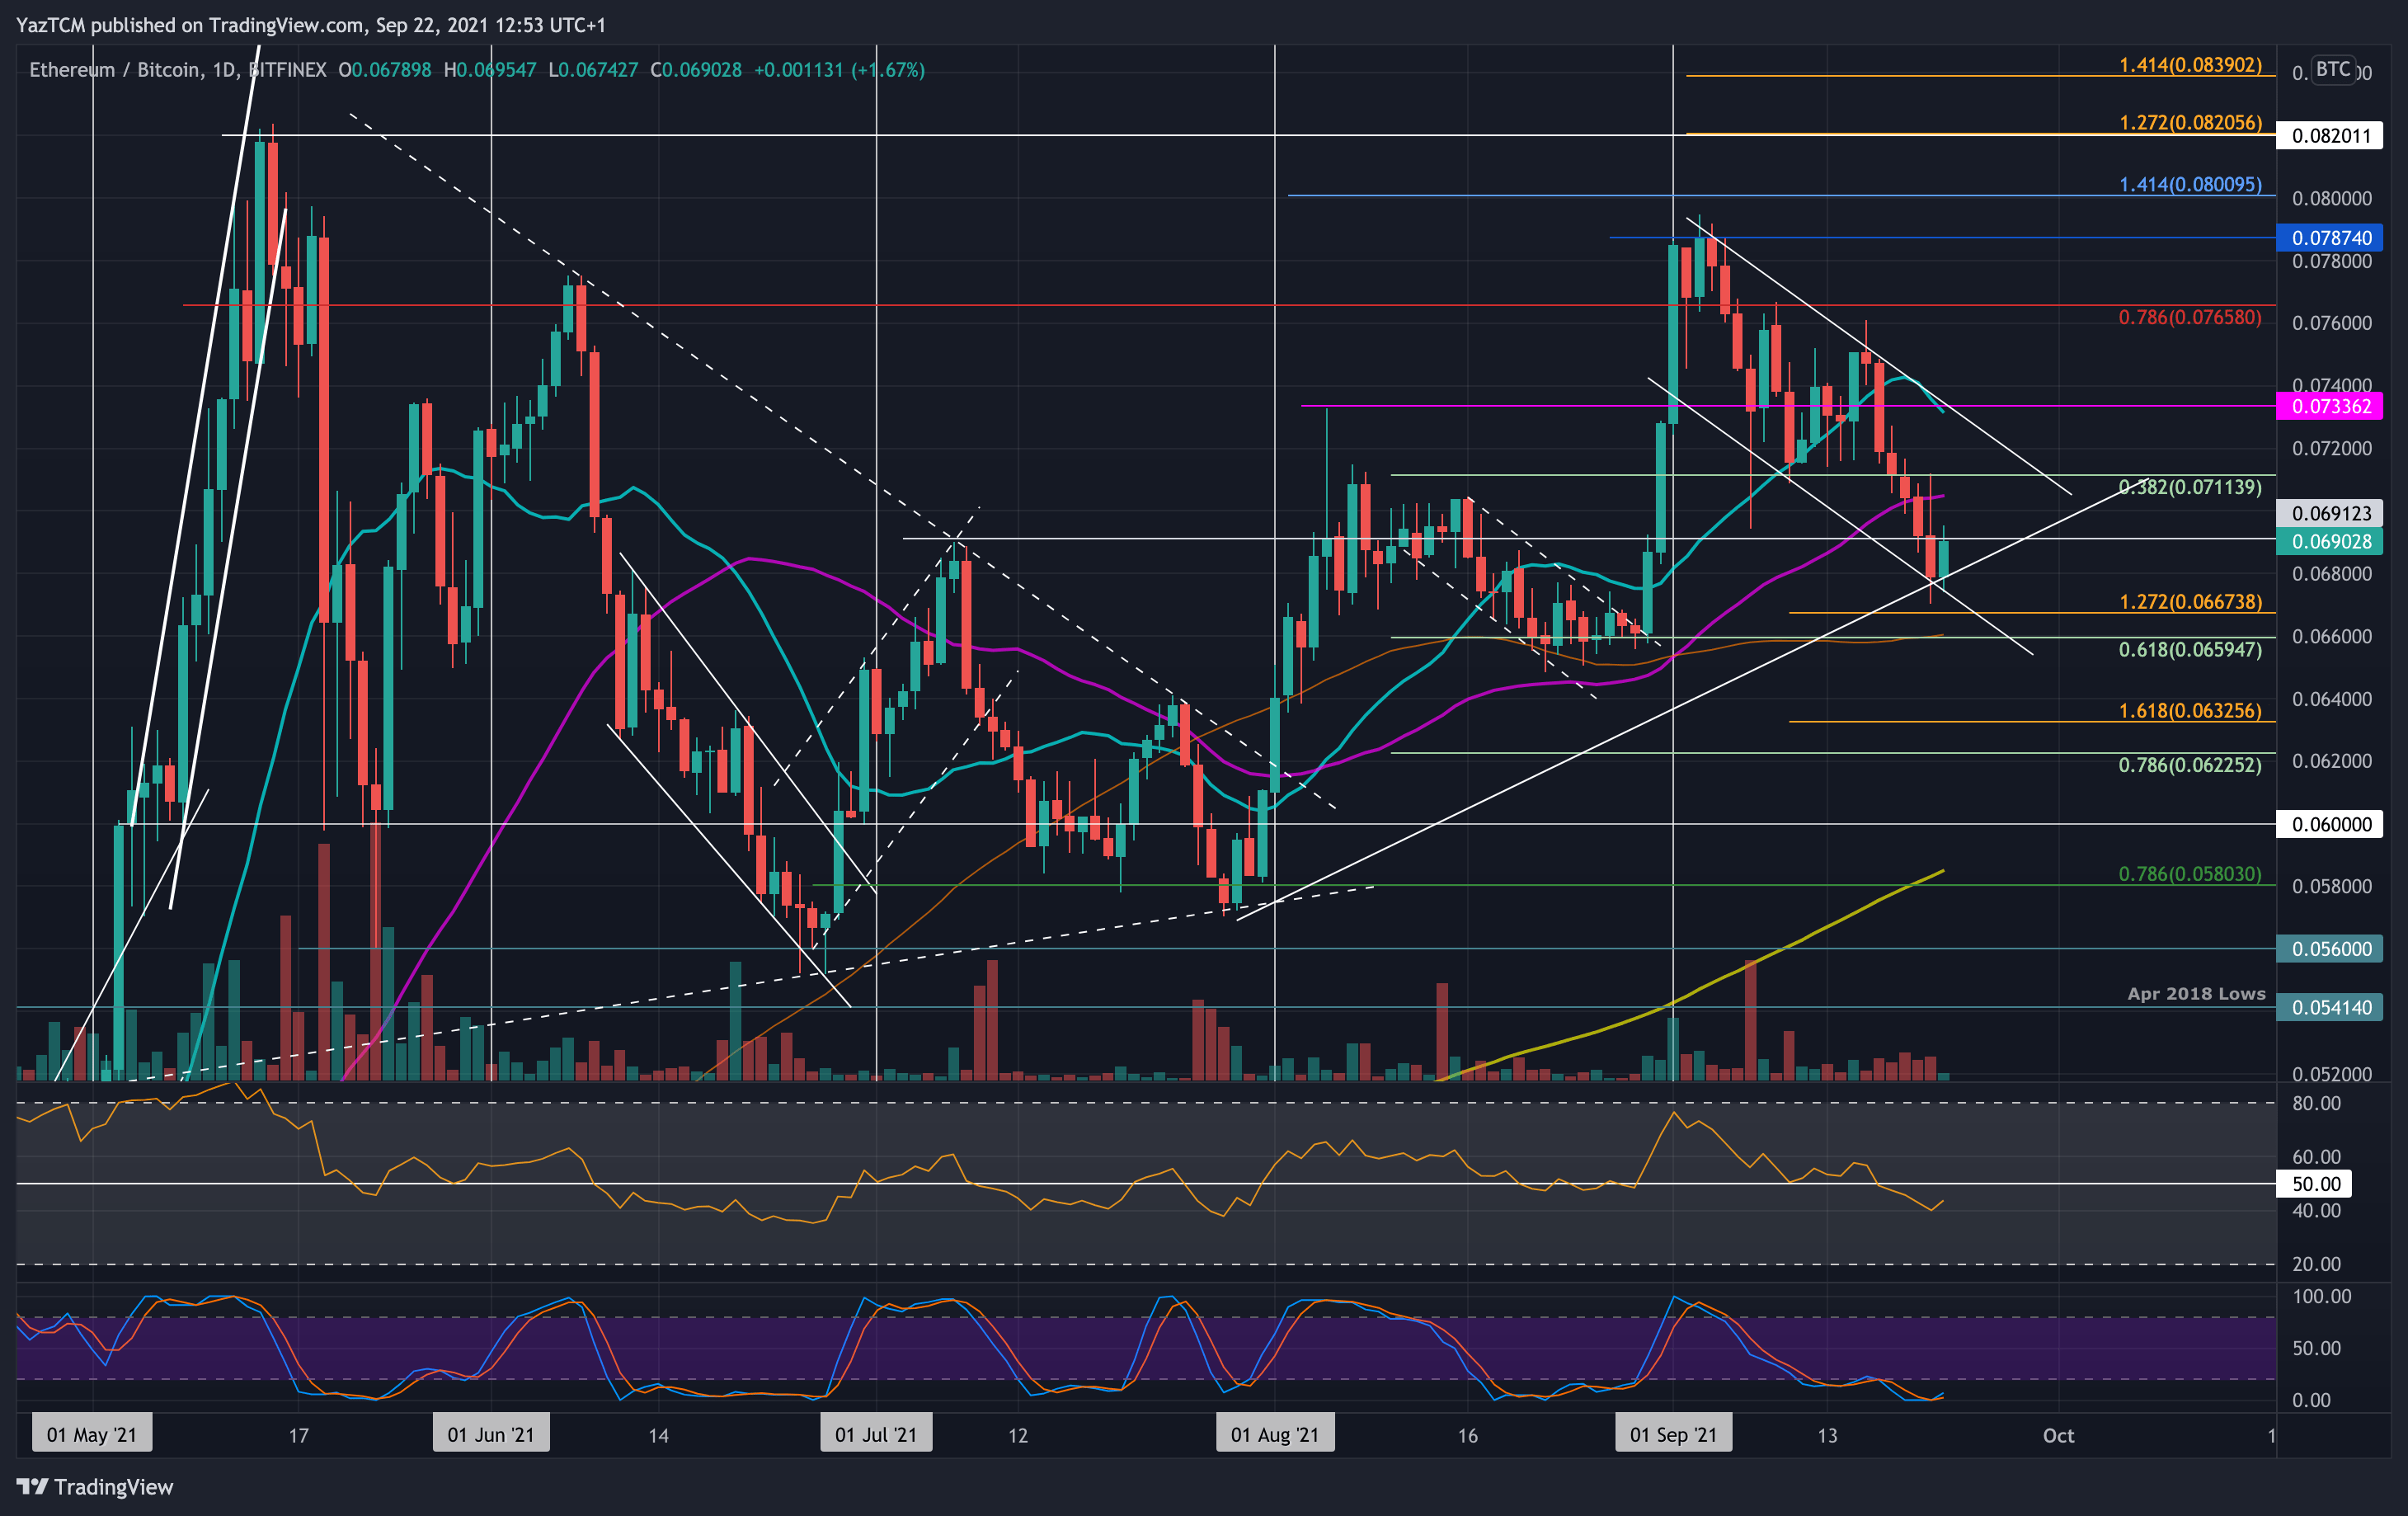
ETH-BTC Short Term Price Prediction
Moving forward, the first strong resistance lies at 0.07 BTC. This is followed by 0.071 BTC (50-day MA), 0.0733 BTC (August highs), and 0.0765 BTC (bearish .786 Fib).
On the other side, the first support lies at 0.068 BTC (rising trend line). This is followed by 0.0667 BTC (downside 1.272 Fib Extension), 0.066 BTC (.618 Fib), and 0.064 BTC.
The RSI is also beneath the midline here, indicating bearish momentum is control.