Positive momentum has been setting foot over the last 48 hours, and ETH is no exception – ending this week with a green candle. But the main question is whether the bear market is over or how confident the participants are about the reversal of the downtrend. Technical Analysis The Daily Chart: Technical Analysis By Grizzly Ethereum is forming a very bullish structure on the daily chart. The second-largest cryptocurrency has made a robust weekly green candle as well. As discussed in the March 17th analysis, confirmation of the reversal of the downtrend would be considered after the price crosses above the static level at 00. Looking at the weekly candlestick at the end of January, we see that the price fell again despite the 25% surge, and February was all downhill.
Topics:
CryptoVizArt considers the following as important: ETH Analysis, ETHBTC, Ethereum (ETH) Price, ethusd
This could be interesting, too:
Mandy Williams writes Ethereum Derivatives Metrics Signal Modest Downside Tail Risk Ahead: Nansen
Jordan Lyanchev writes Weekly Bitcoin, Ethereum ETF Recap: Light at the End of the Tunnel for BTC
CryptoVizArt writes Will Weak Momentum Drive ETH to .5K? (Ethereum Price Analysis)
Jordan Lyanchev writes Bybit Hack Fallout: Arthur Hayes, Samson Mow Push for Ethereum Rollback
Positive momentum has been setting foot over the last 48 hours, and ETH is no exception – ending this week with a green candle. But the main question is whether the bear market is over or how confident the participants are about the reversal of the downtrend.
Technical Analysis
The Daily Chart:
Technical Analysis By Grizzly
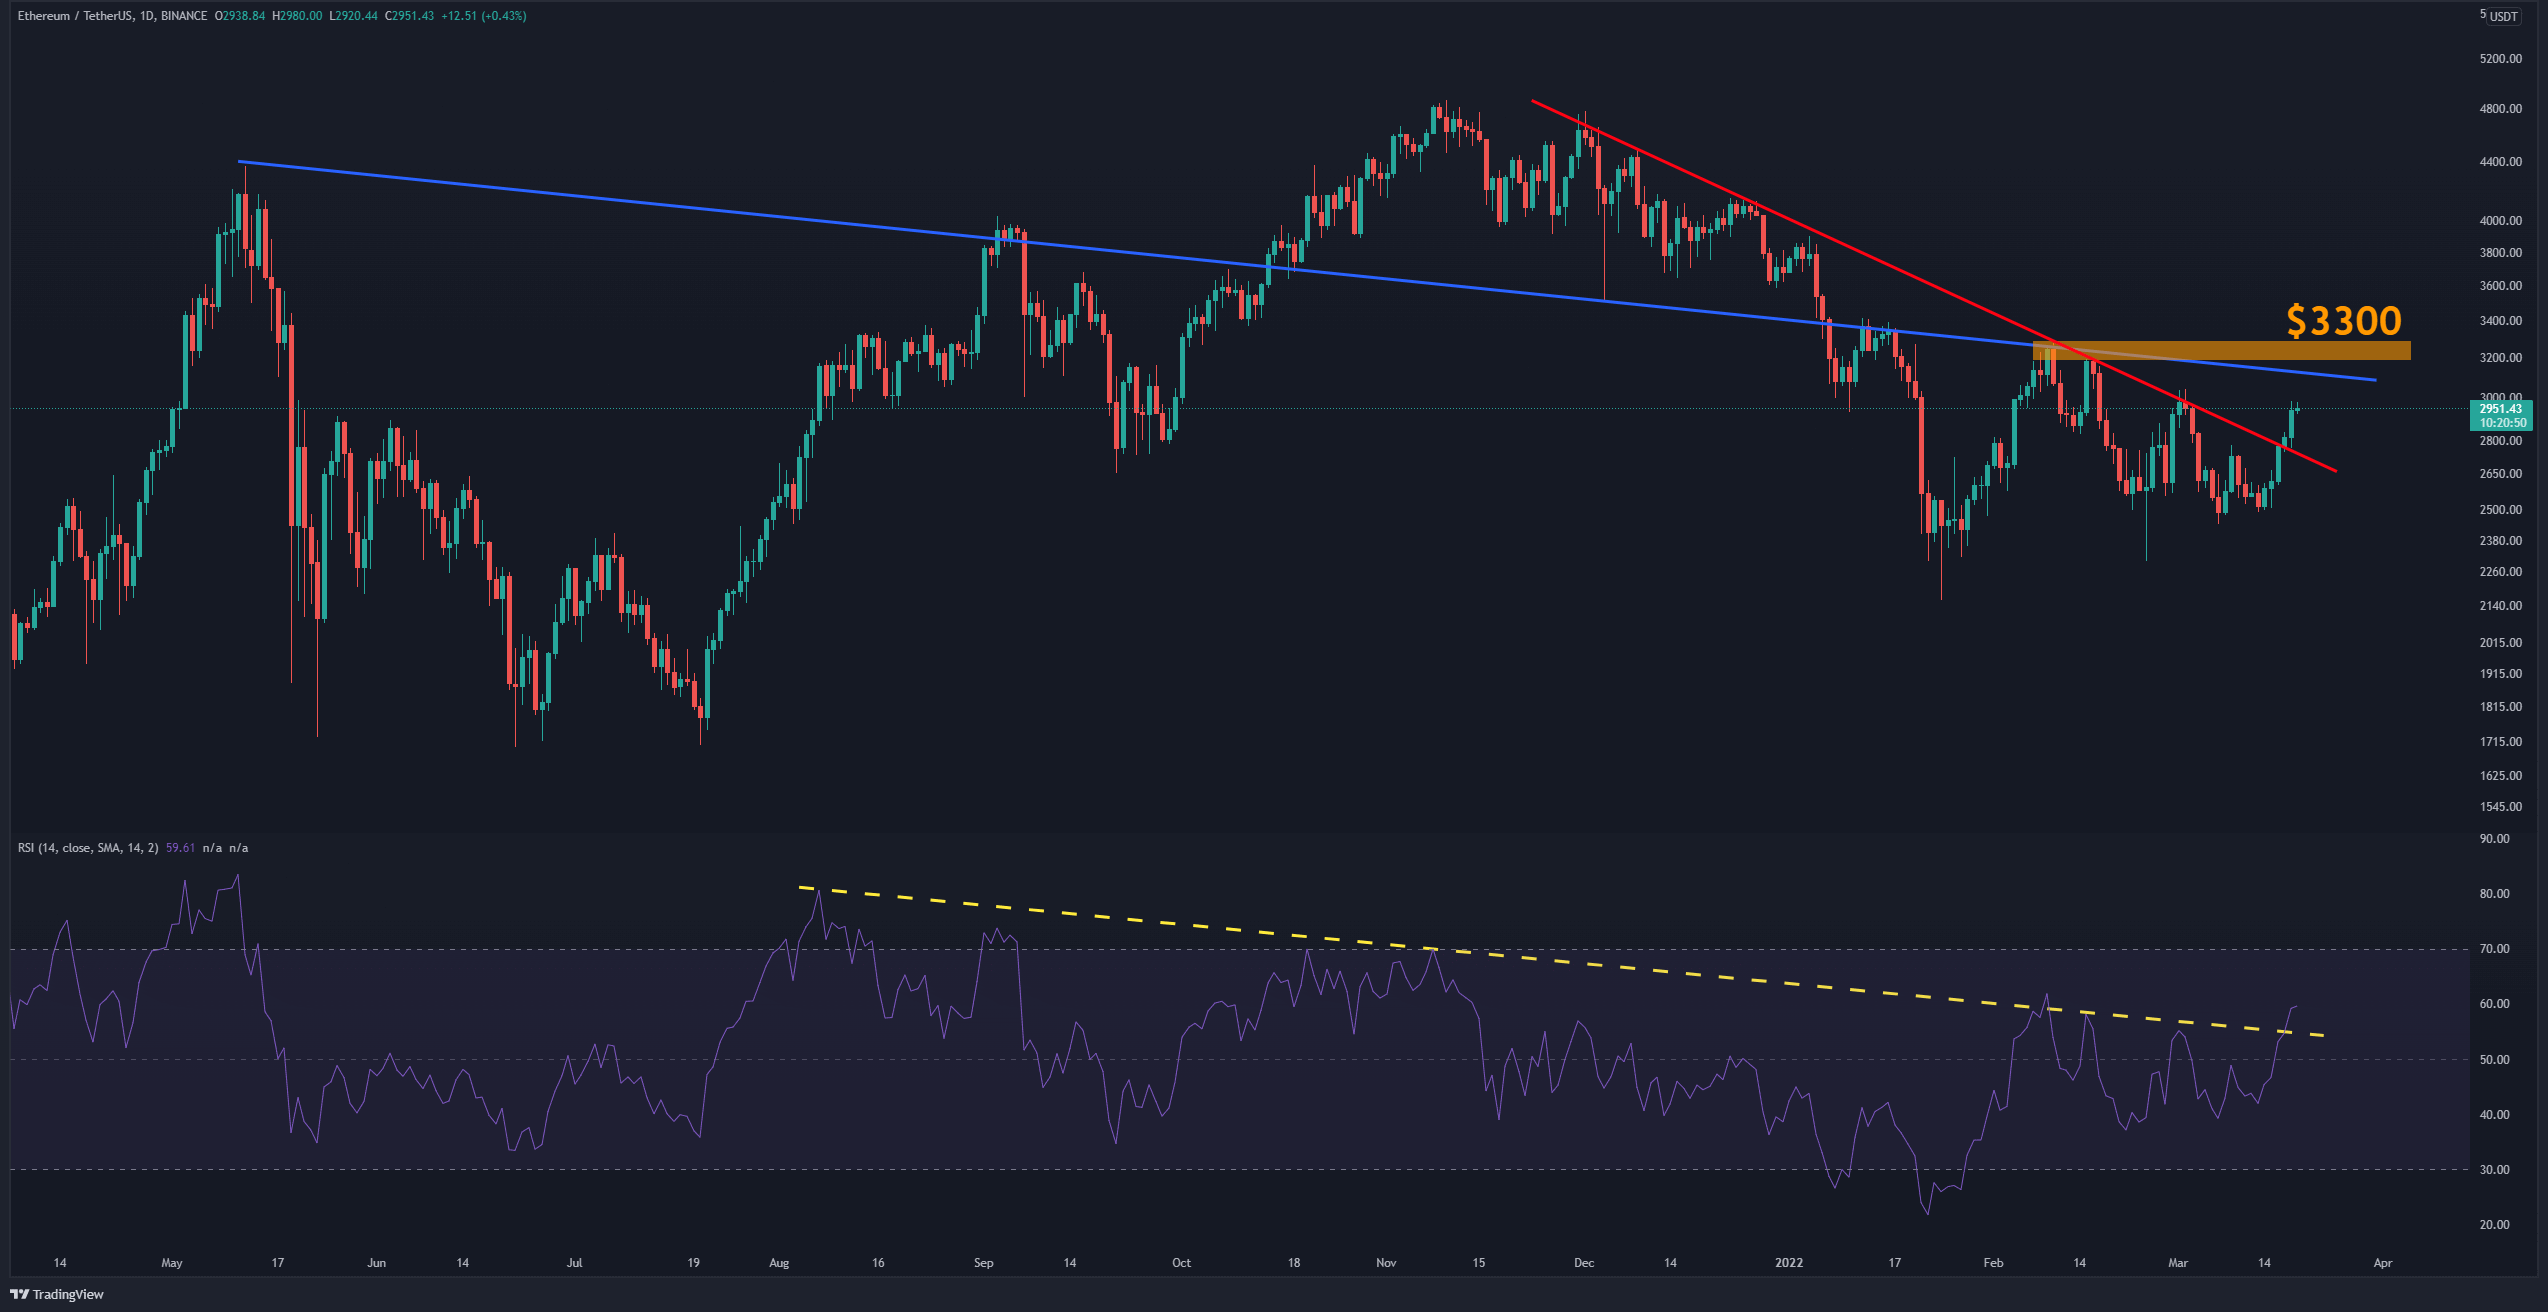
Ethereum is forming a very bullish structure on the daily chart. The second-largest cryptocurrency has made a robust weekly green candle as well.
As discussed in the March 17th analysis, confirmation of the reversal of the downtrend would be considered after the price crosses above the static level at $3300. Looking at the weekly candlestick at the end of January, we see that the price fell again despite the 25% surge, and February was all downhill. Technically, by forming a higher high and crossing above the static level at $3300, which is the intersection of many resistances, we can consider a trend reversal with more confidence.
- RSI-14: Crossing the downtrend line and moving in the bullish area
- Resistances levels: $3,000 and $3,300
- Supports levels: $2700 and $2500
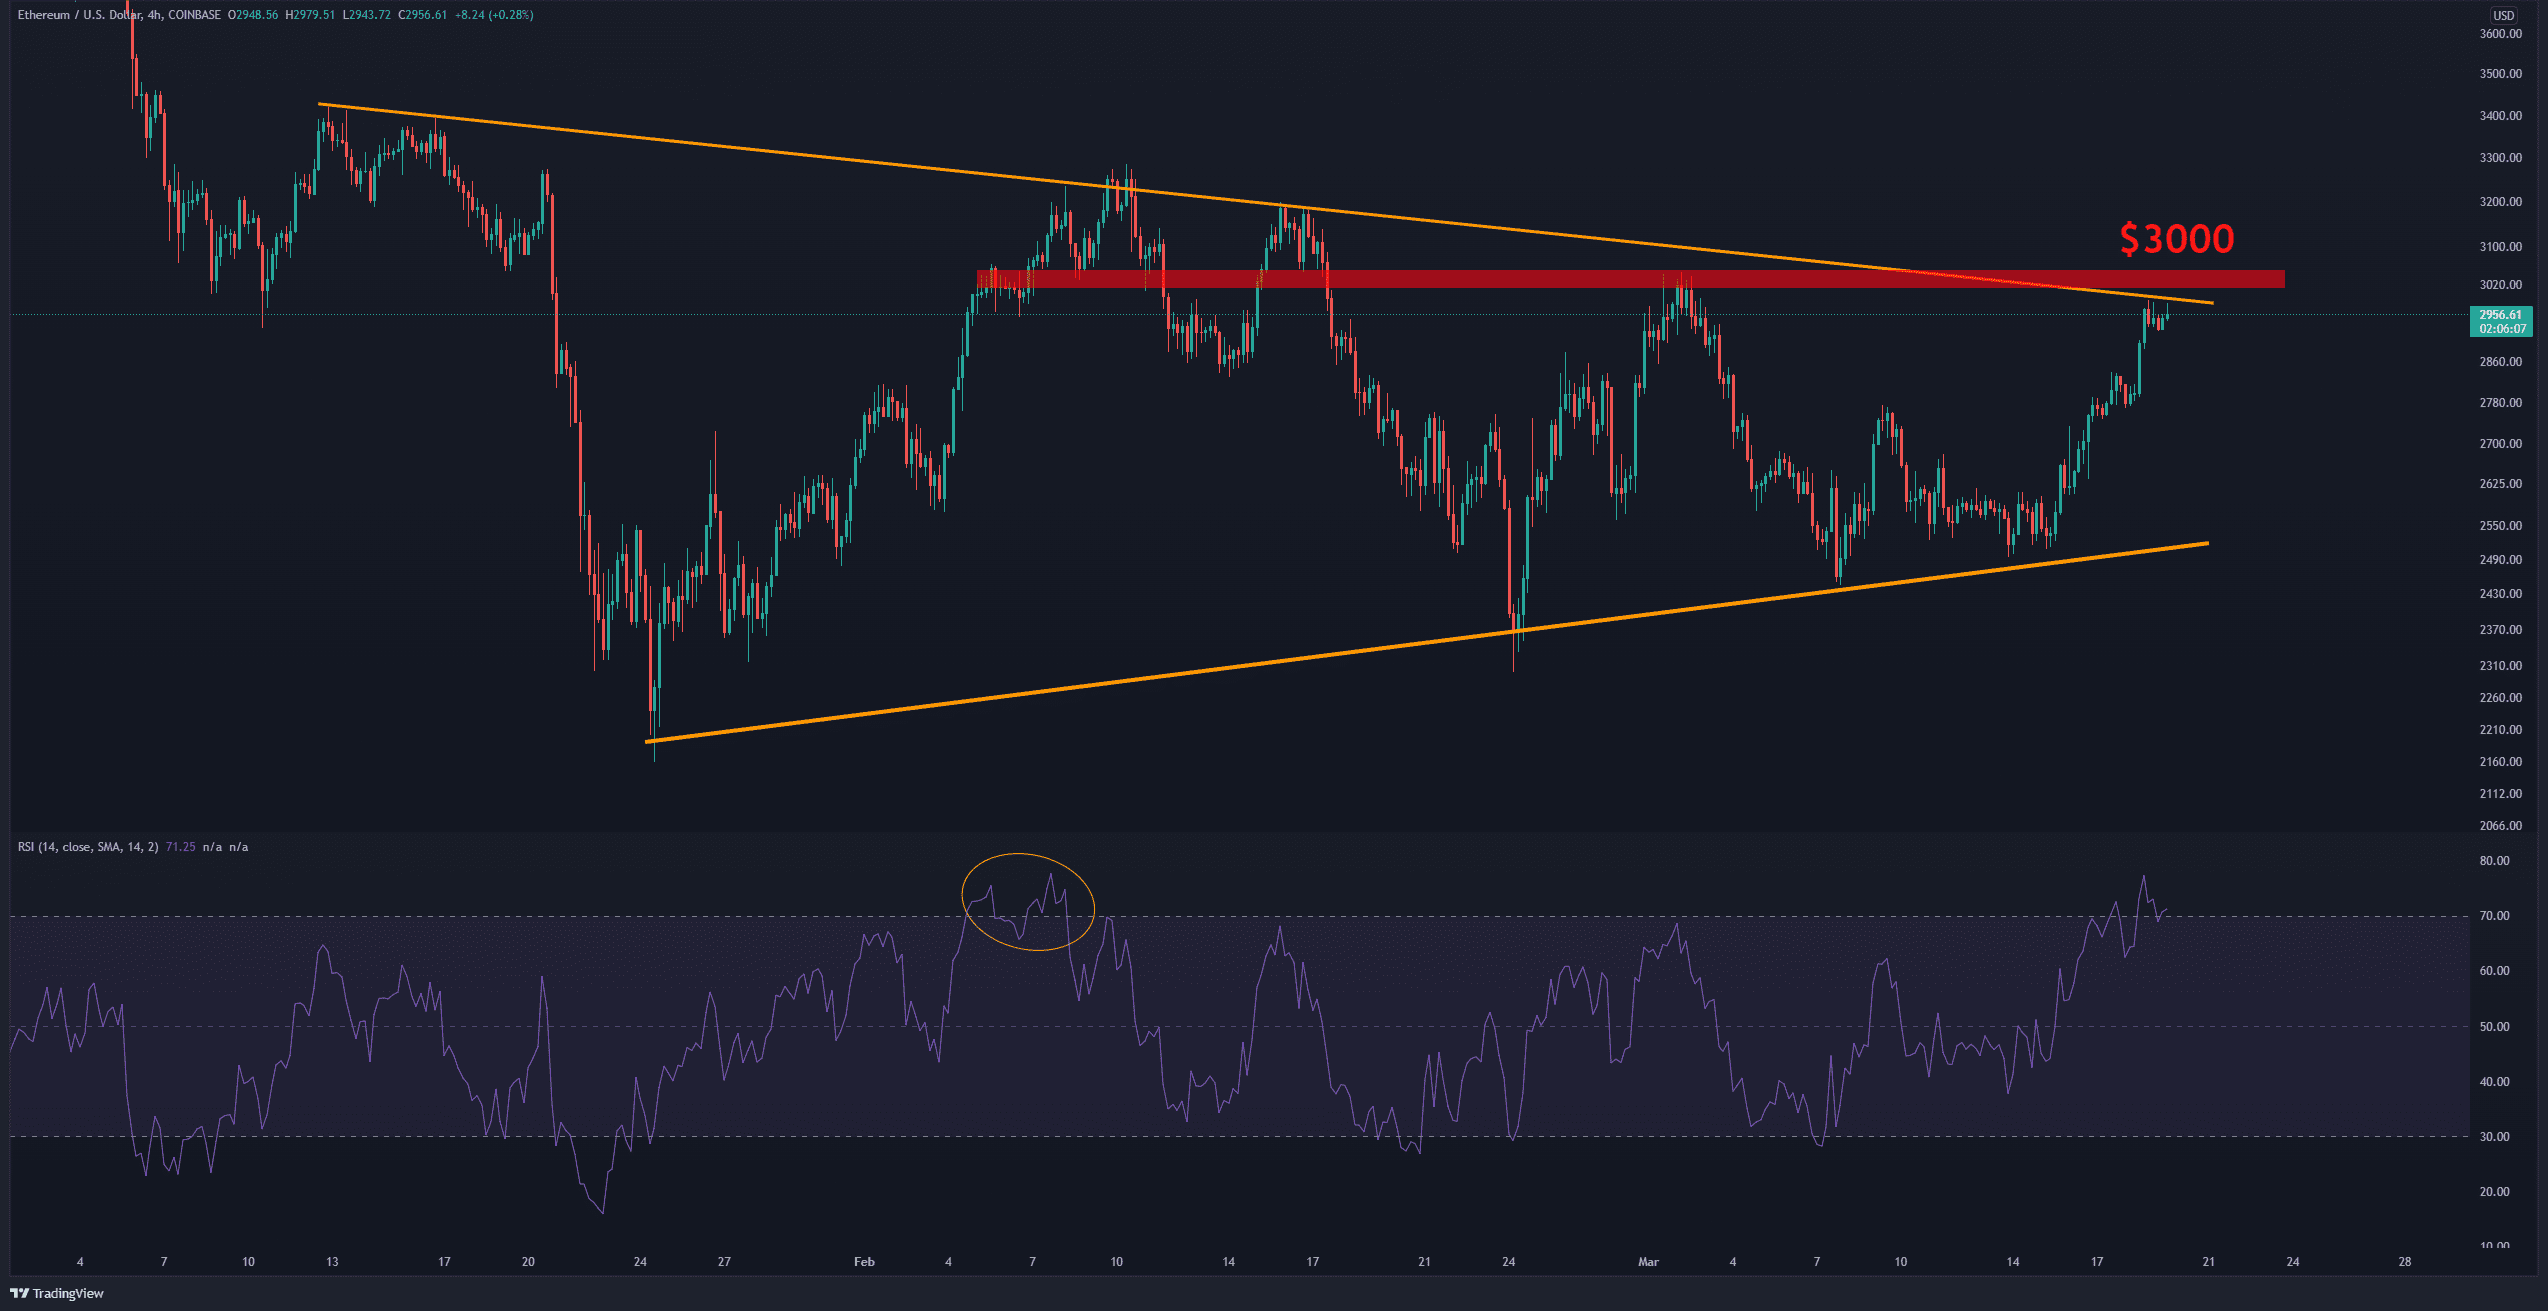
The 4-Hour Chart:
On the 4-hour timeframe, Ethereum is trading inside a triangle since the beginning of 2022. Its upper side acts as dynamic resistance and intersects with the static resistance at $3,000. Looking at the historical trend, the price has started the corrective phase by entering the overbought area in RSI (yellow circle).