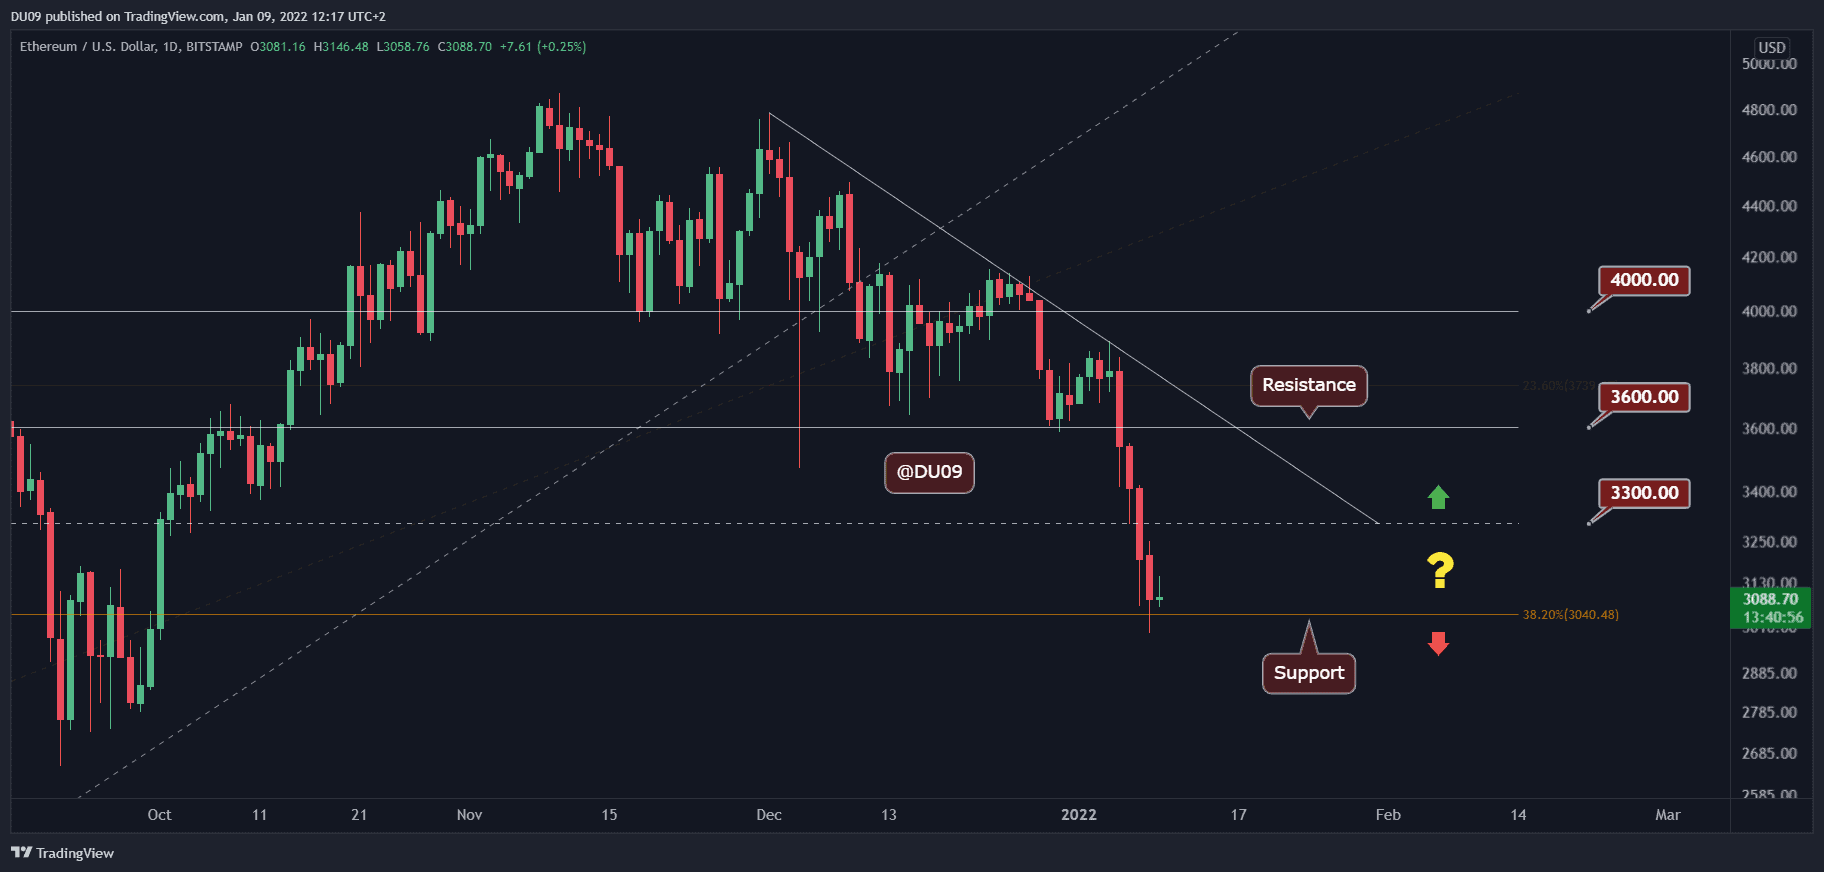
Just as the overall negative sentiment of the crypto markets, ETH had a rough start of 2022, losing over 20% during the first week of the new year. Key Support levels: K – 50 Key Resistance levels: ,300 – ,600 The past week saw a significant crypto crash where ETH went as low as ,987 (Bitstamp) on Saturday before recovering above the K support level as of today. Last Wednesday, the market entered into a sustained selloff: so far, ETH saw four consecutive daily red candles, breaking the ,600 and ,300 key support levels. Now, these critical levels have turned into resistance. At the time of this writing, the price appears to have found a local bottom on top of the ,000 psychological support, and ETH could see a temp correction towards the key resistance
Topics:
Duo Nine considers the following as important: ETH Analysis, ETHBTC, Ethereum (ETH) Price, ethusd
This could be interesting, too:
Mandy Williams writes Ethereum Derivatives Metrics Signal Modest Downside Tail Risk Ahead: Nansen
Jordan Lyanchev writes Weekly Bitcoin, Ethereum ETF Recap: Light at the End of the Tunnel for BTC
CryptoVizArt writes Will Weak Momentum Drive ETH to .5K? (Ethereum Price Analysis)
Jordan Lyanchev writes Bybit Hack Fallout: Arthur Hayes, Samson Mow Push for Ethereum Rollback
Just as the overall negative sentiment of the crypto markets, ETH had a rough start of 2022, losing over 20% during the first week of the new year.
Key Support levels: $3K – $2750
Key Resistance levels: $3,300 – $3,600
The past week saw a significant crypto crash where ETH went as low as $2,987 (Bitstamp) on Saturday before recovering above the $3K support level as of today.
Last Wednesday, the market entered into a sustained selloff: so far, ETH saw four consecutive daily red candles, breaking the $3,600 and $3,300 key support levels. Now, these critical levels have turned into resistance.
At the time of this writing, the price appears to have found a local bottom on top of the $3,000 psychological support, and ETH could see a temp correction towards the key resistance levels, pausing a bit the selloff momentum.
In case of a $3K breakdown, the next major support to look at is September’s low, around $2,750.
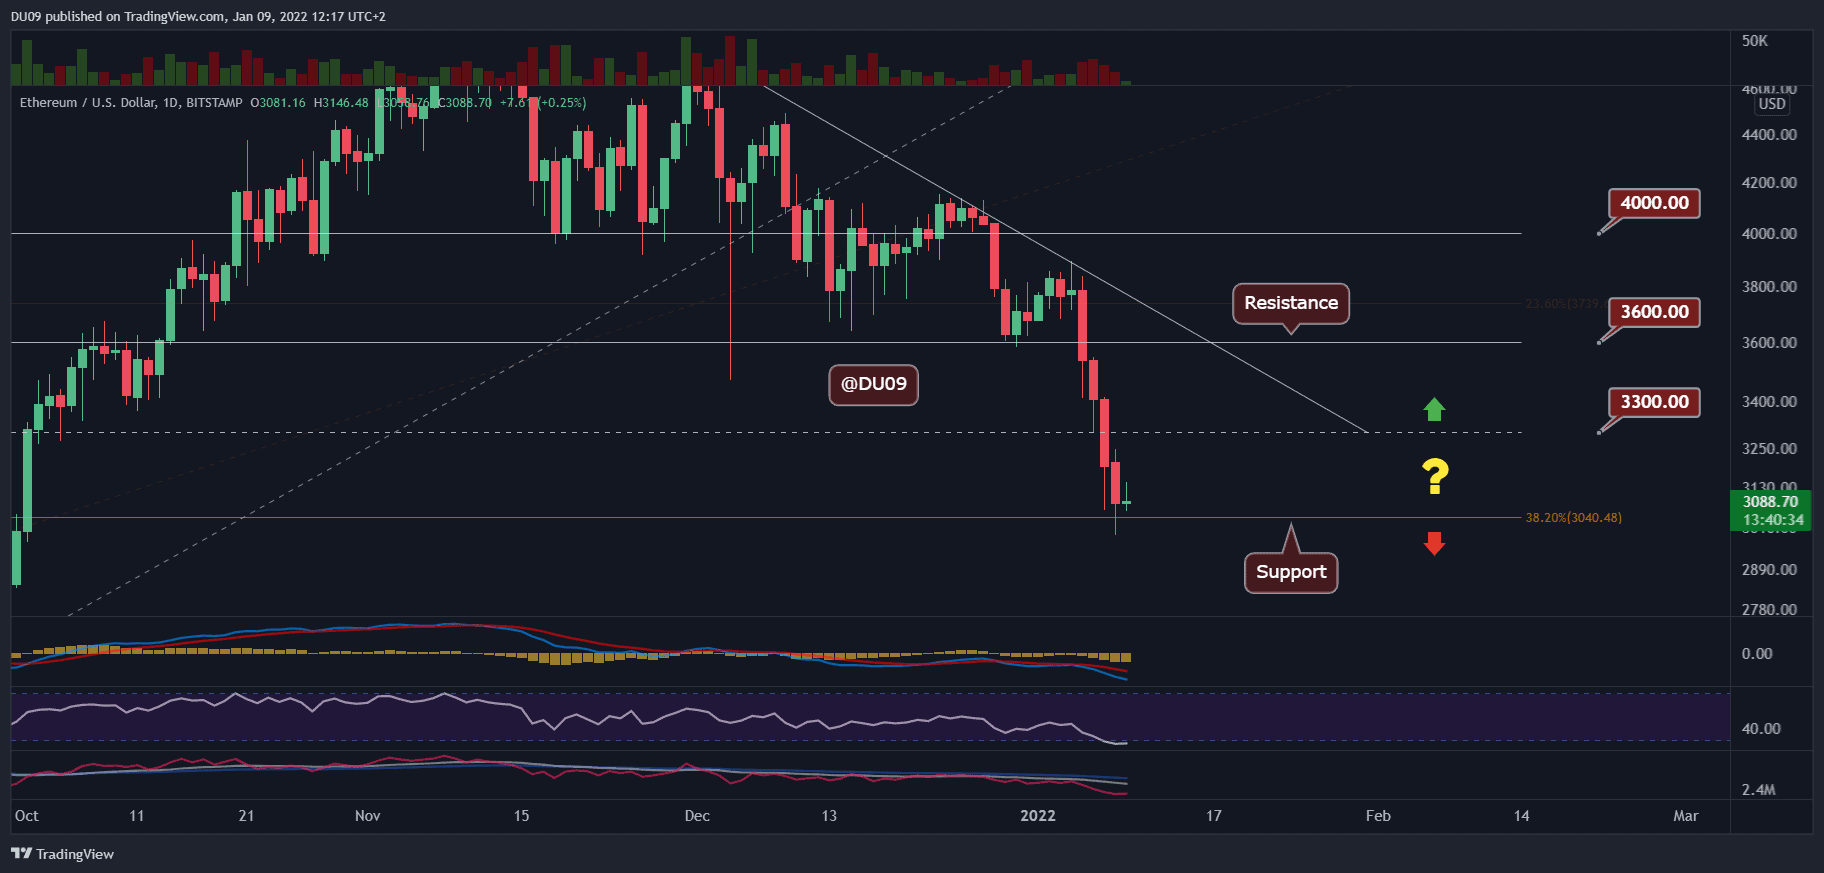
Technical Indicators
Trading Volume: The selloff volume peaked on Thursday, and since then, the volume has declined, particularly on Saturday.
This allowed ETH to finally stop the downtrend Sunday at just above $3,000 (as of now). However, the weekend price action should be taken with a grain of salt since most traders are off, along with the global markets that also affect the overall sentiment.
RSI: The daily RSI has reached the oversold territory and might curve up during a relief rally. This is not bullish yet, since it can be temporarily in case of sellers’ pressure return in the coming week.
MACD: The daily MACD is bearish, and the histogram shows some first signs of decrease in the selloff momentum. If this continues, ETH can attempt a pullback to the $3,300 resistance level.
Bias
The bias for ETH is bearish. Watch the Monday price action as that will indicate what will happen next to ETH.
Short-Term Price Prediction for ETH
After a bloody week, ETH finally found some support on the $3,000 level. This level must be defended well by buyers; otherwise, it would spell disaster for the altcoin market. Confidence in support levels is low particularly when the price dropped below critical levels last week without any pullback.