Key Support levels: ,000, ,805 Key Resistance levels: ,400, ,750 Despite a decreasing volume as the price goes up, ETH continued to perform well this week and increased substantially. The key resistance sits at ,400, and the cryptocurrency appears ready to test this level before any significant pullback. The support at ,000 has held well and may be revisited if ETH is rejected at the key resistance. Chart by TradingViewTechnical Indicators Trading Volume: The volume continues to decrease, even as the price moves higher. This is a bearish signal and may materialize once the price hits the key resistance. RSI: The daily RSI has hit 62 points and appears to curve down. The increase from the oversold area was very sharp and a pullback becomes likely in the near
Topics:
Duo Nine considers the following as important: ETH Analysis, ETHBTC, Ethereum (ETH) Price, ethusd
This could be interesting, too:
Mandy Williams writes Ethereum Derivatives Metrics Signal Modest Downside Tail Risk Ahead: Nansen
Jordan Lyanchev writes Weekly Bitcoin, Ethereum ETF Recap: Light at the End of the Tunnel for BTC
CryptoVizArt writes Will Weak Momentum Drive ETH to .5K? (Ethereum Price Analysis)
Jordan Lyanchev writes Bybit Hack Fallout: Arthur Hayes, Samson Mow Push for Ethereum Rollback
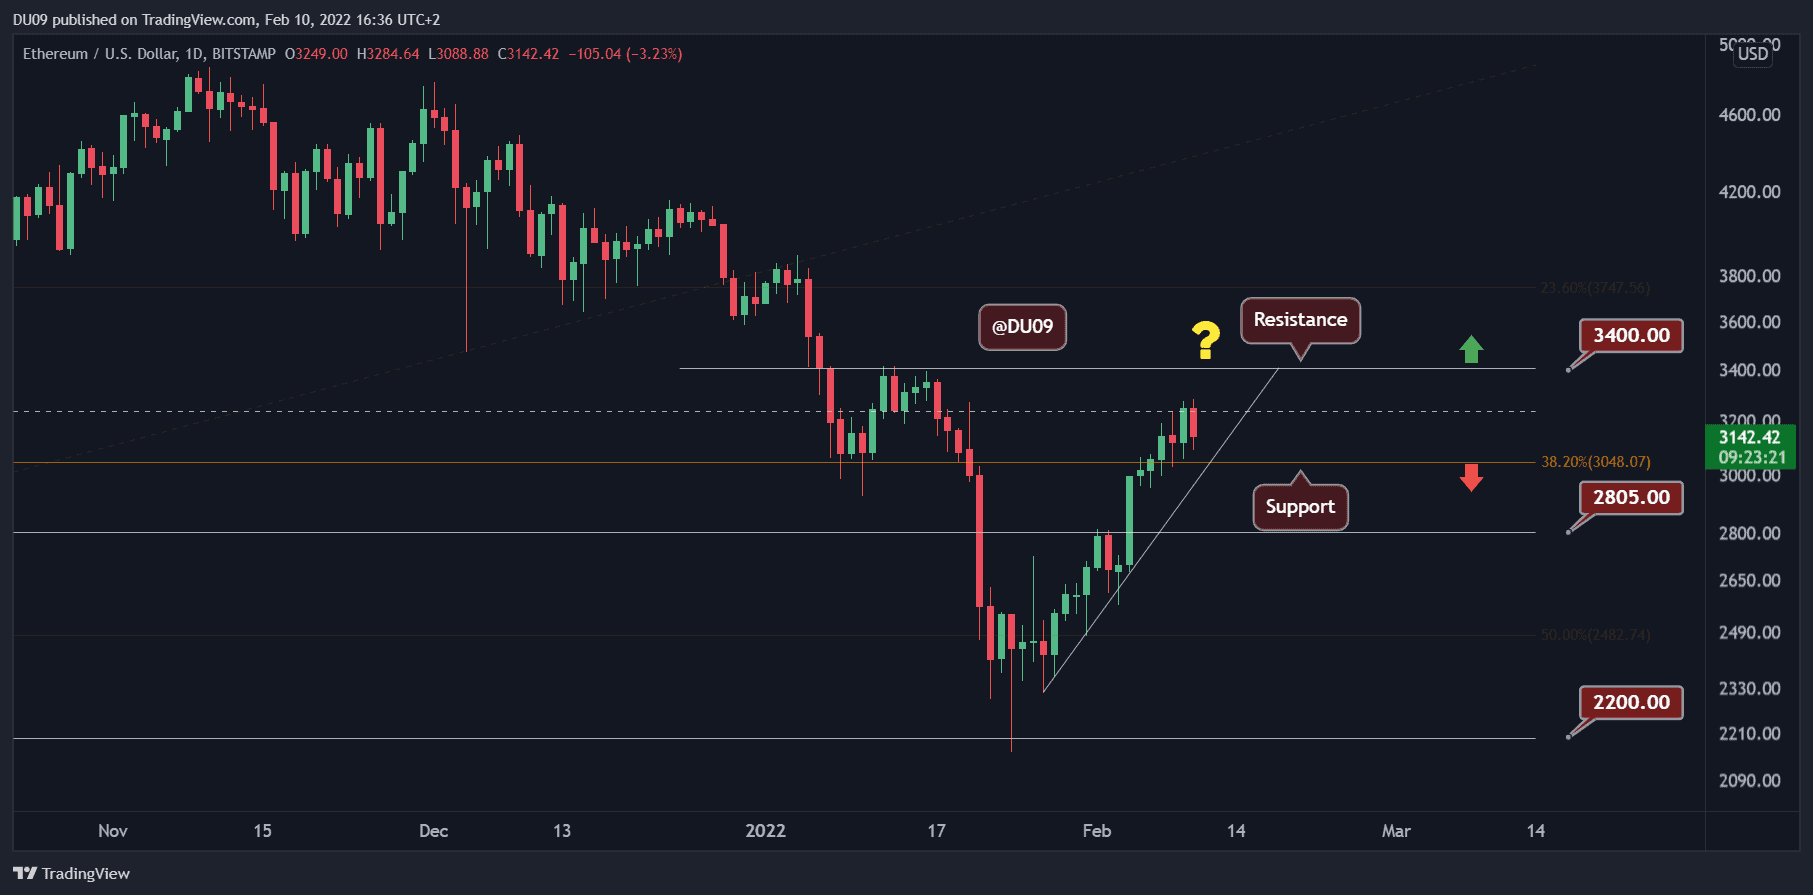
Key Support levels: $3,000, $2,805
Key Resistance levels: $3,400, $3,750
Despite a decreasing volume as the price goes up, ETH continued to perform well this week and increased substantially. The key resistance sits at $3,400, and the cryptocurrency appears ready to test this level before any significant pullback. The support at $3,000 has held well and may be revisited if ETH is rejected at the key resistance.
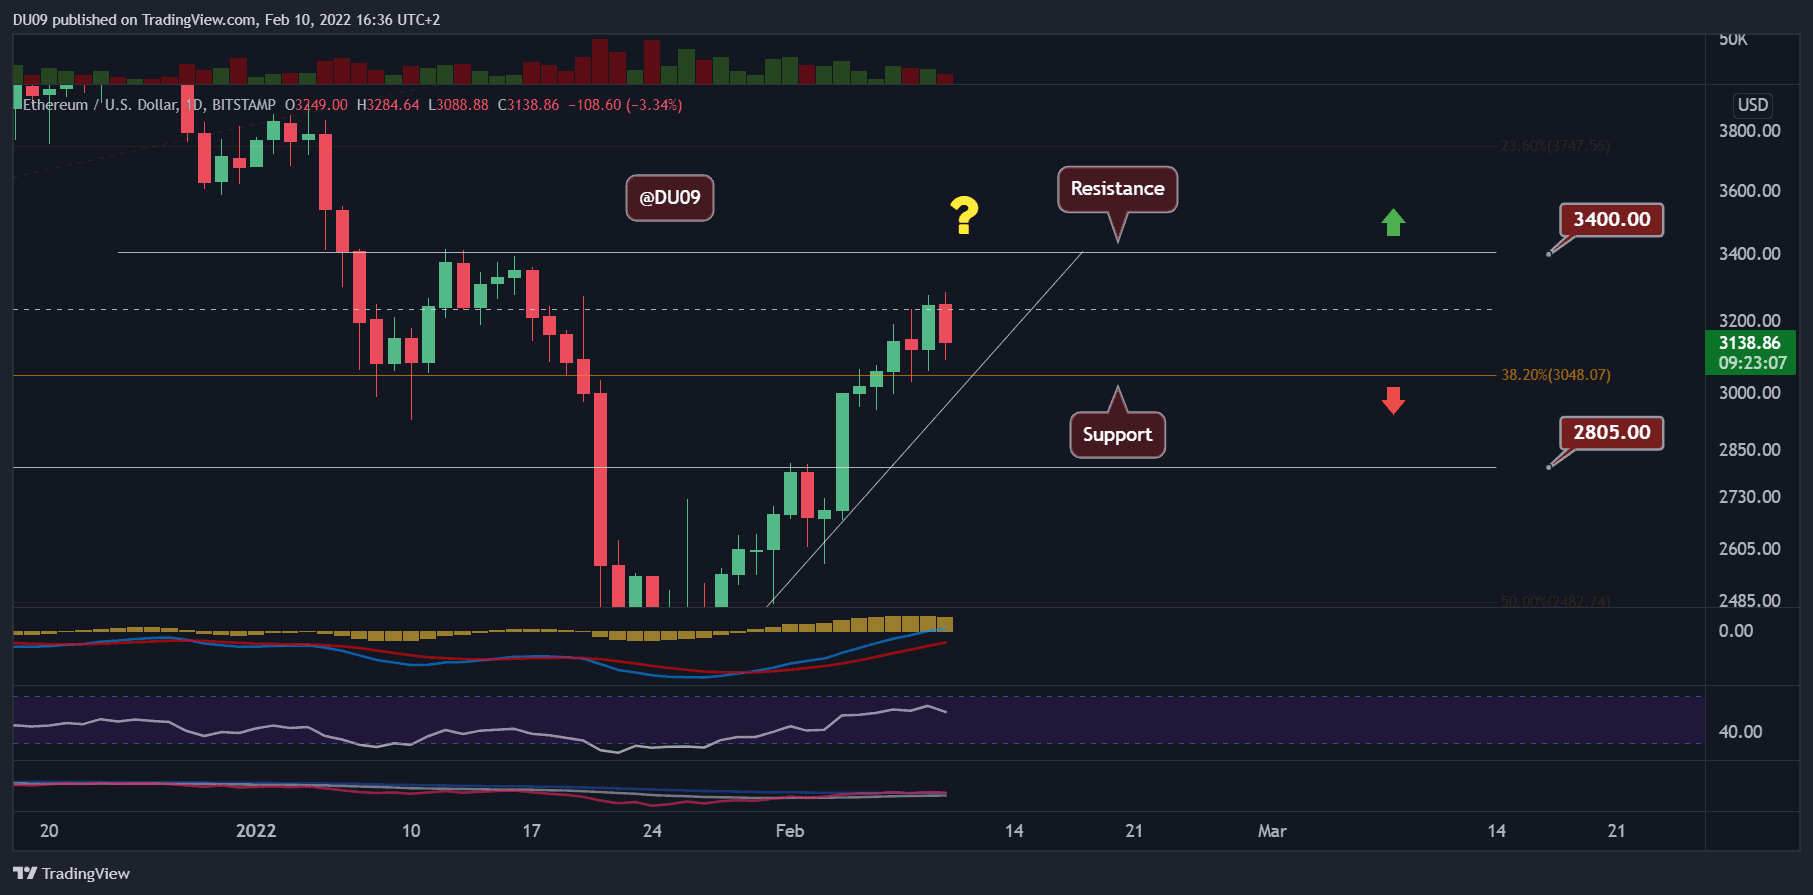
Technical Indicators
Trading Volume: The volume continues to decrease, even as the price moves higher. This is a bearish signal and may materialize once the price hits the key resistance.
RSI: The daily RSI has hit 62 points and appears to curve down. The increase from the oversold area was very sharp and a pullback becomes likely in the near future.
MACD: Even if the MACD is bullish, the histogram has turned flat in the last few days. This signals a loss of bullish momentum. Best to be cautious as we approach the key resistance.
Bias
The current bias for ETH is bullish. It’s important to monitor the key resistance as a rejection there could lead to a significant correction.
Short-Term Price Prediction for ETH
At the time of this writing, it seems more likely for ETH to test $3.4K rather than not. Once it’s there, it’s important to monitor the price action closely.