Key Support levels: K – 50 Key Resistance levels: ,300 – ,600 ETH’s downtrend is currently taking a break, with prices pausing just above ,000. The sellers seem unable to push the cryptocurrency lower after the latest attempt yesterday briefly took the price to ,926 (Bitstamp) before it recovered back above the key support. The resistance is found at ,300 and appears quite far away at the time of this post. Before buyers have the confidence to put ETH on the uptrend, the key support level has to prove trustworthy. Chart by TradingViewTechnical Indicators Trading Volume: There was a spike in volume yesterday when ETH’s price fell under ,000 for a short period. However, as soon as the price fell under these key levels, buyers rushed in, pushing ETH back
Topics:
Duo Nine considers the following as important: ETH Analysis, ETHBTC, Ethereum (ETH) Price, ethusd
This could be interesting, too:
Mandy Williams writes Ethereum Derivatives Metrics Signal Modest Downside Tail Risk Ahead: Nansen
Jordan Lyanchev writes Weekly Bitcoin, Ethereum ETF Recap: Light at the End of the Tunnel for BTC
CryptoVizArt writes Will Weak Momentum Drive ETH to .5K? (Ethereum Price Analysis)
Jordan Lyanchev writes Bybit Hack Fallout: Arthur Hayes, Samson Mow Push for Ethereum Rollback
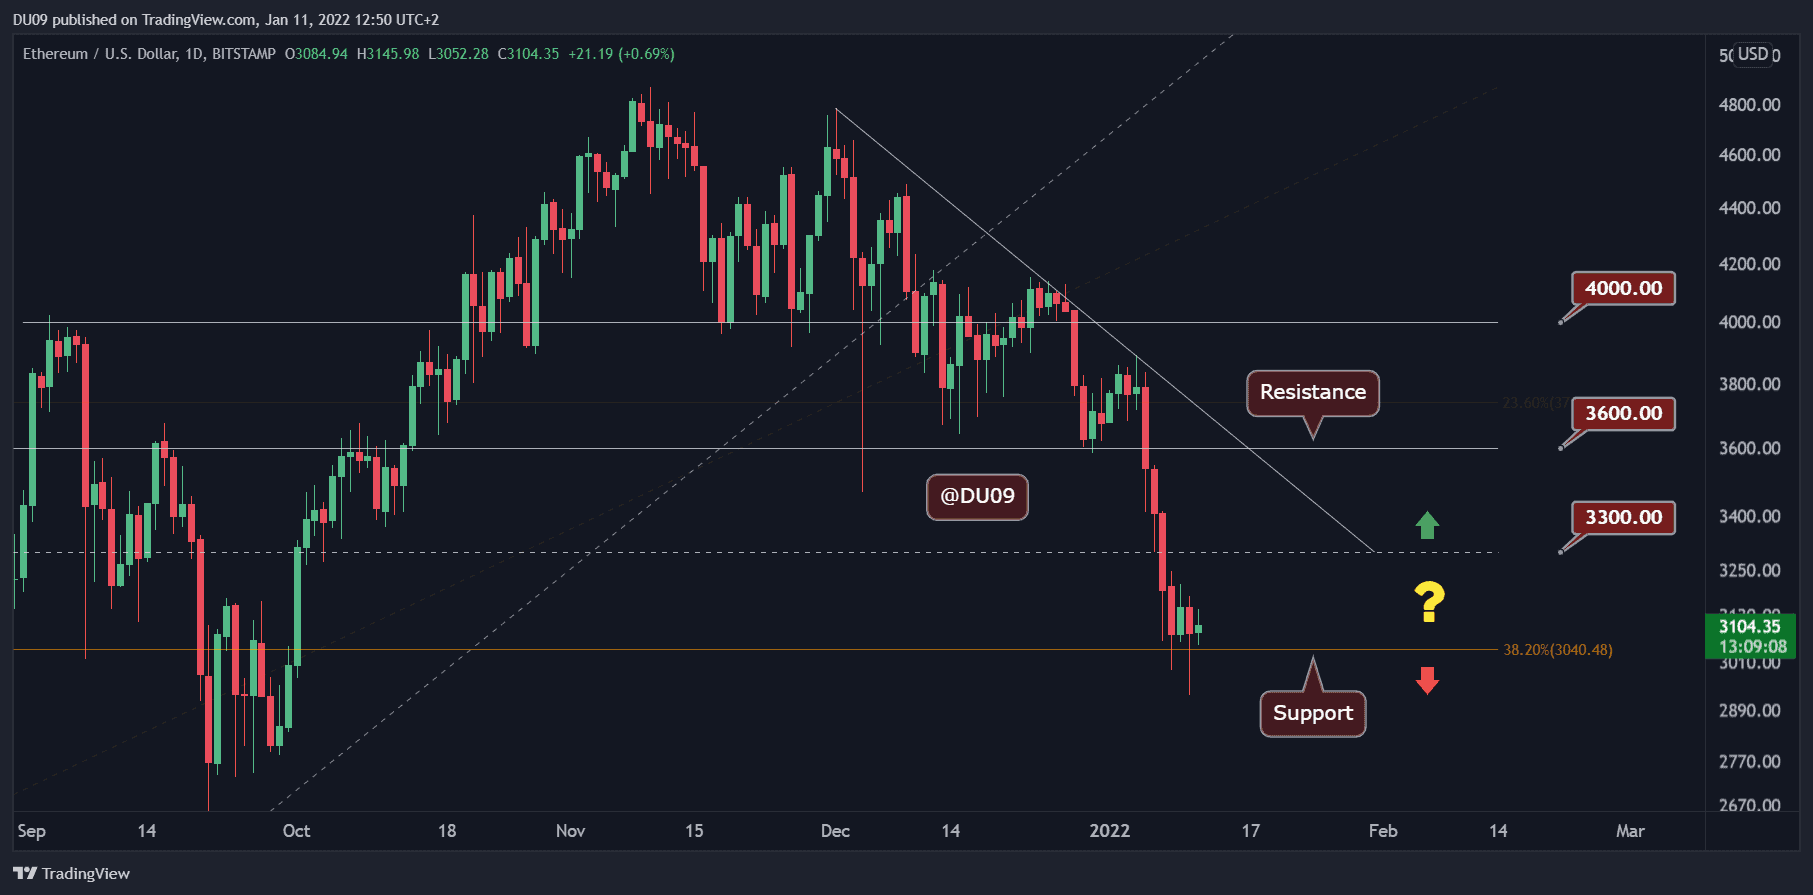
Key Support levels: $3K – $2750
Key Resistance levels: $3,300 – $3,600
ETH’s downtrend is currently taking a break, with prices pausing just above $3,000. The sellers seem unable to push the cryptocurrency lower after the latest attempt yesterday briefly took the price to $2,926 (Bitstamp) before it recovered back above the key support.
The resistance is found at $3,300 and appears quite far away at the time of this post. Before buyers have the confidence to put ETH on the uptrend, the key support level has to prove trustworthy.
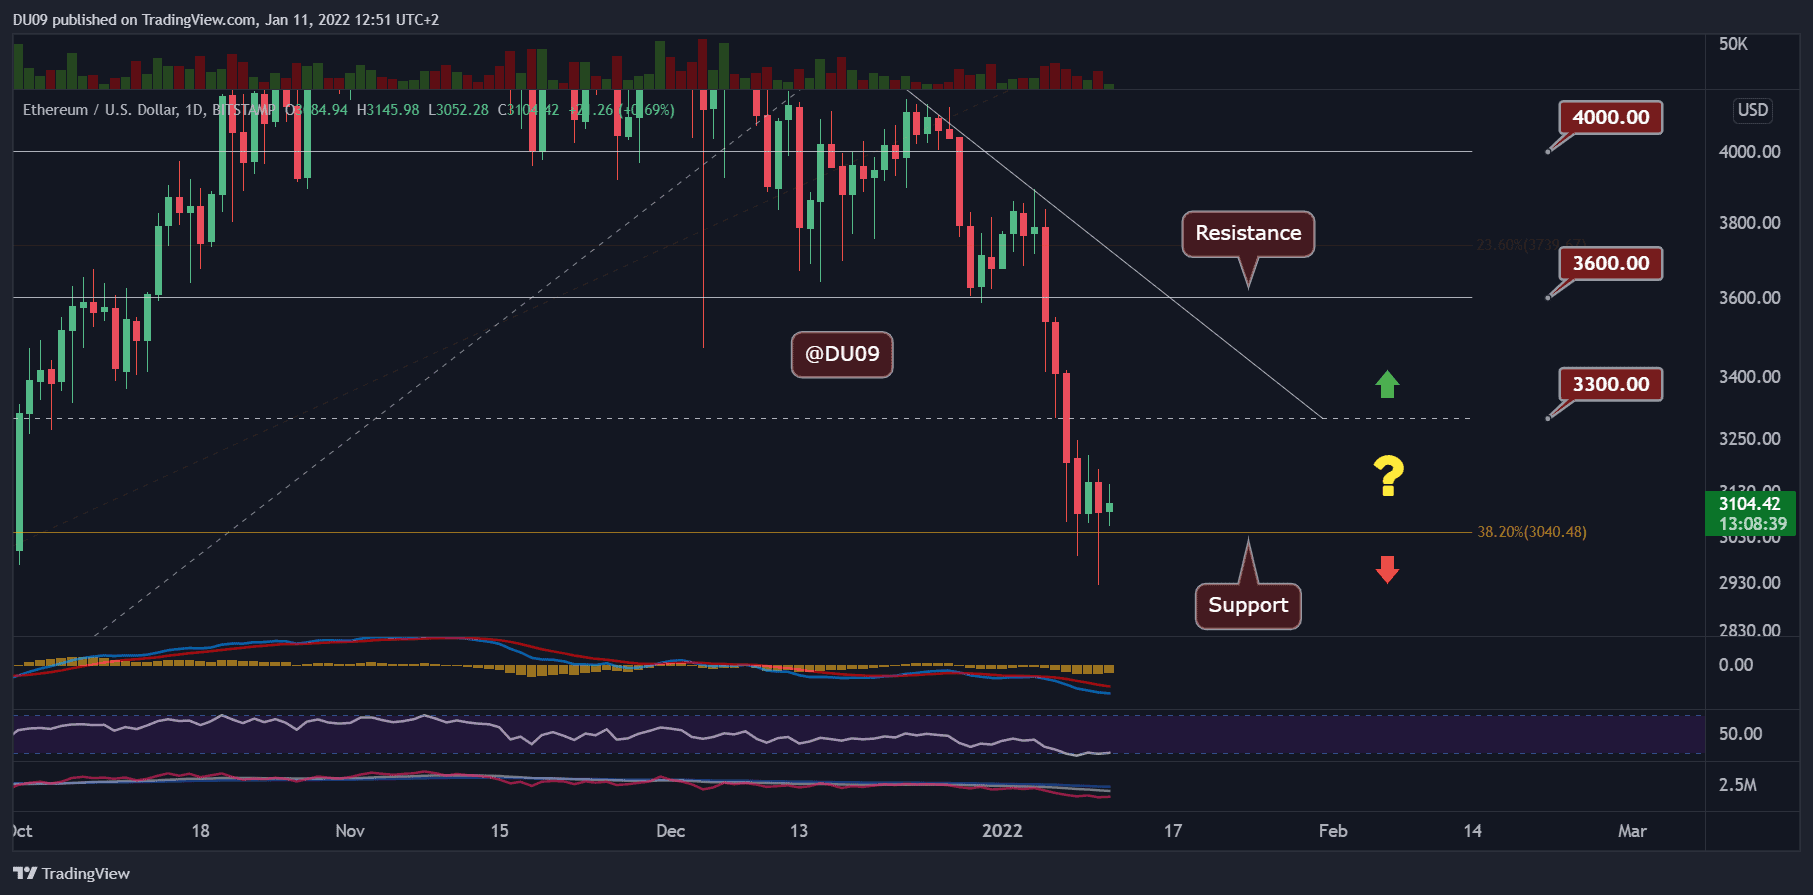
Technical Indicators
Trading Volume: There was a spike in volume yesterday when ETH’s price fell under $3,000 for a short period. However, as soon as the price fell under these key levels, buyers rushed in, pushing ETH back above the support. This price action and volume profile indicate that ETH has found a local bottom at this key psychological level.
RSI: The daily RSI has reached 26 points during the selloff last week (oversold area), and the latest attempt from yesterday to push ETH lower made a higher low on the RSI at 28 points. This shows that a bullish divergence may be forming.
MACD: The daily MACD also reflects the RSI whereby the histogram is making higher lows despite being on the bearish side. This is encouraging and may indicate a relief rally may take form in the future.
Bias
The bias for ETH is neutral. It is unlikely at this time that ETH will fall lower. Instead, a relief rally appears possible towards the key resistance at $3,300.
Short-Term Price Prediction for ETH
The price has reached a pivotal level considering the volume profile of the past few days and the fact that ETH has managed to maintain a price above $3,000 despite several attempts at the contrary. If last week was characterized by a sustained selloff, this week may be the chance for ETH to return on the uptrend and attempt a relief rally towards the key resistance.