Key Support levels: ,550, ,200 Key Resistance levels: ,800, ,000 Despite a worthy attempt by ETH to move higher, the sellers stood firm at the ,800 resistance, which rejected the price and propelled it into a pullback. The buyers will have to defend the support at ,500 to avoid further losses as the next key support is found at ,200. So long the current support holds, this can be an expected pullback after a 30% rally. Chart by TradingViewTechnical Indicators Trading Volume: Despite the fall in price, the selling volume has been weak. This gives bulls a good chance to defend ETH at ,500. RSI: After making a higher high, the RSI has turned down due to the rejection at resistance. Nevertheless, this pullback could be temporary, particularly if the RSI makes a
Topics:
Duo Nine considers the following as important: ETH Analysis, ETHBTC, Ethereum (ETH) Price, ethusd
This could be interesting, too:
Mandy Williams writes Ethereum Derivatives Metrics Signal Modest Downside Tail Risk Ahead: Nansen
Jordan Lyanchev writes Weekly Bitcoin, Ethereum ETF Recap: Light at the End of the Tunnel for BTC
CryptoVizArt writes Will Weak Momentum Drive ETH to .5K? (Ethereum Price Analysis)
Jordan Lyanchev writes Bybit Hack Fallout: Arthur Hayes, Samson Mow Push for Ethereum Rollback
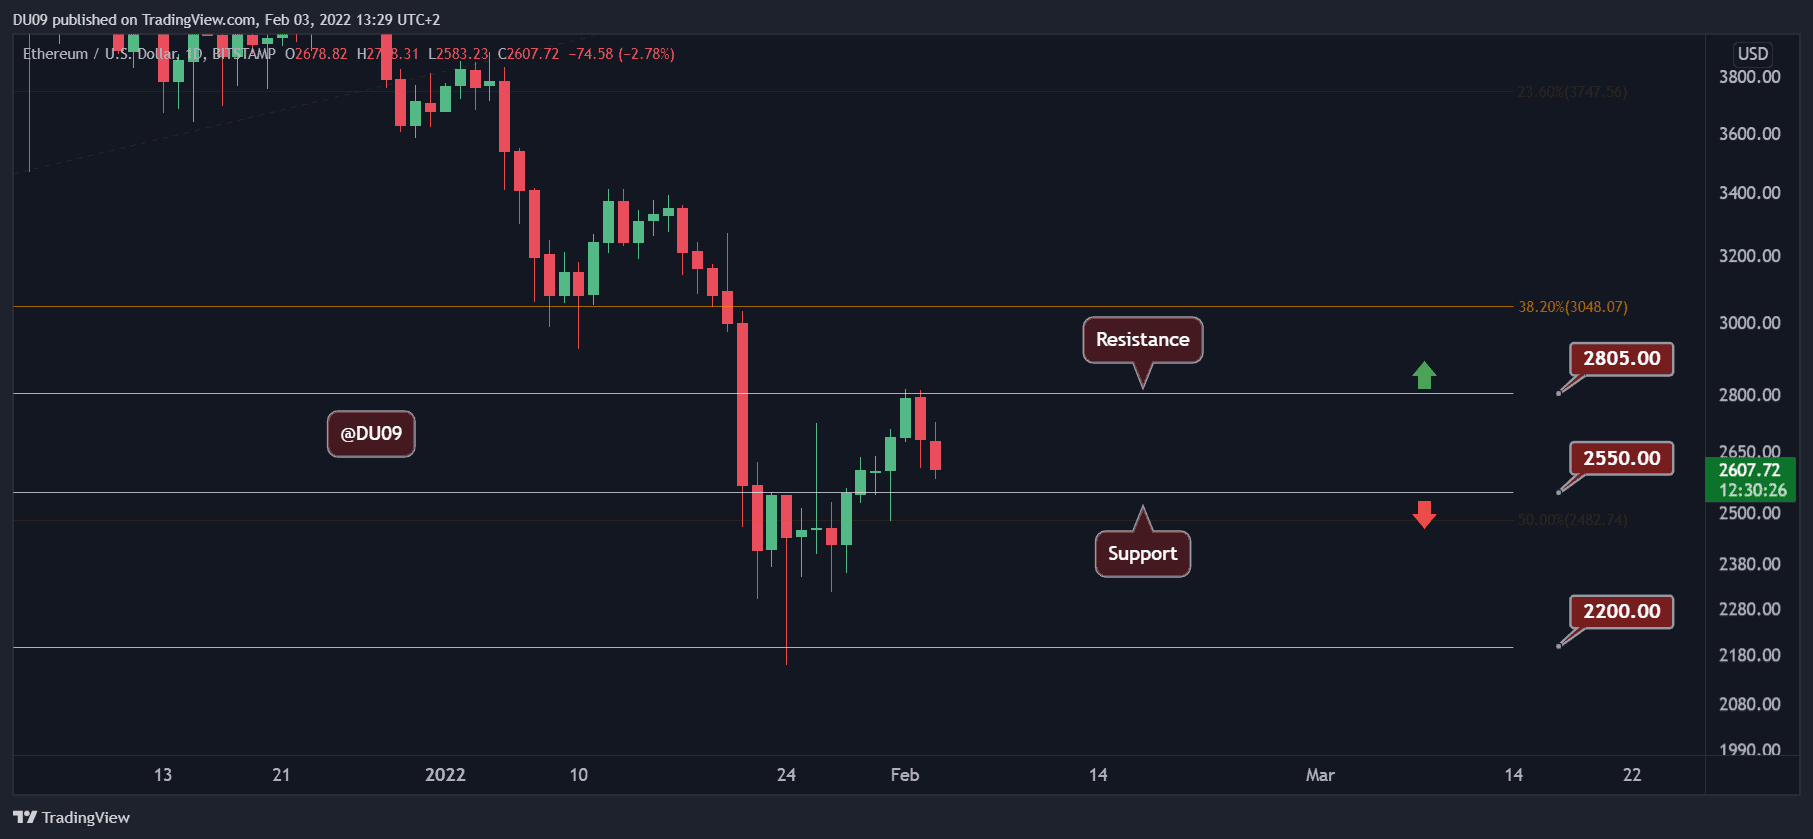
Key Support levels: $2,550, $2,200
Key Resistance levels: $2,800, $3,000
Despite a worthy attempt by ETH to move higher, the sellers stood firm at the $2,800 resistance, which rejected the price and propelled it into a pullback.
The buyers will have to defend the support at $2,500 to avoid further losses as the next key support is found at $2,200. So long the current support holds, this can be an expected pullback after a 30% rally.
Technical Indicators
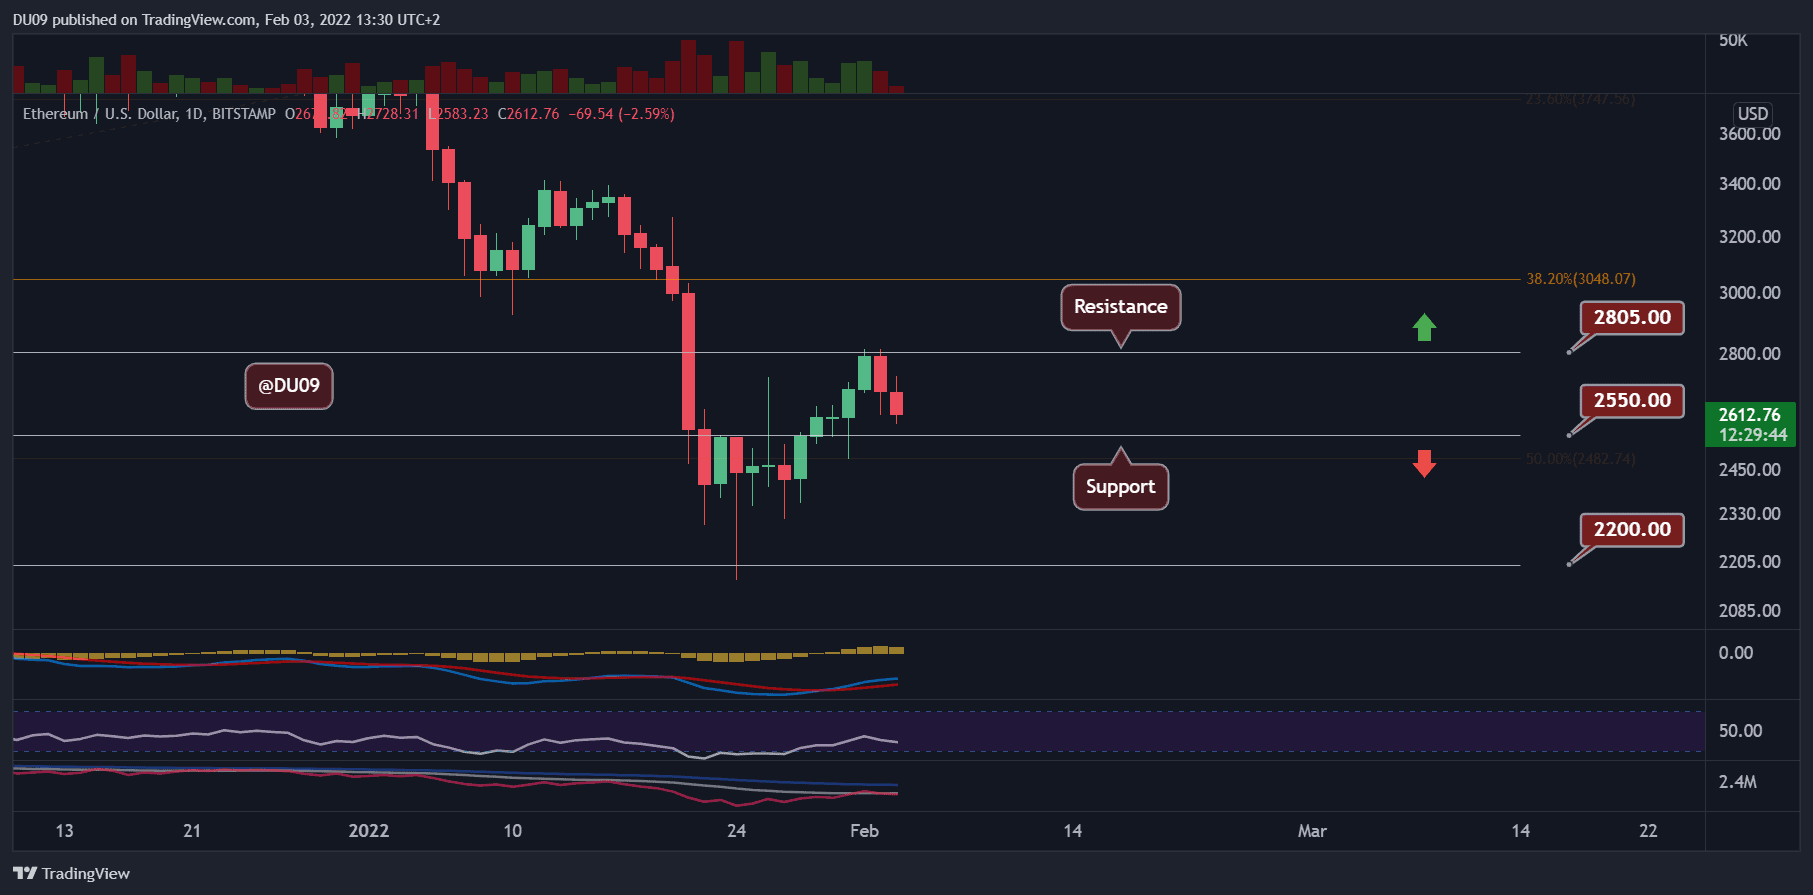
Trading Volume: Despite the fall in price, the selling volume has been weak. This gives bulls a good chance to defend ETH at $2,500.
RSI: After making a higher high, the RSI has turned down due to the rejection at resistance. Nevertheless, this pullback could be temporary, particularly if the RSI makes a higher low.
MACD: The daily MACD remains bullish even if the histogram has made a lower high. Bears have to push ETH under $2,500 to seriously challenge the latest price increase.
Bias
The current bias for ETH is neutral. The strength of buyers faded as the price approached $2,800. Thus, ETH may consolidate in a range before a new trend emerges.
Short-Term Price Prediction for ETH
ETH failed to break the key resistance at $2,800 and has been falling back towards the key support at $2,500. Considering the volume profile, the sellers may not be too interested in pushing prices much lower. For this reason, the cryptocurrency may consolidate in this range between the key levels.