Ethereum managed to break above ,600 after buyers took control of the short-term price action. Since recording a 6-month low on Monday (60), ETH recovered over 20%. Key Support levels: ,550, ,200 Key Resistance levels: ,805, ,000 ETH had seen a positive weekend so far, managing to break and daily close above the critical resistance at ,550 which has now turned into support. The immediate resistance is now found at ,805 and if ETH maintains the bullish momentum, then the price might target the K milestone, which is a key psychological level. Chart by TradingViewTechnical Indicators Trading Volume: Decent volume during this most recent rally. However, the weekend volume remains low, and best to wait for Monday to confirm the current price action’s
Topics:
Duo Nine considers the following as important: ETH Analysis, ETHBTC, Ethereum (ETH) Price, ethusd
This could be interesting, too:
Mandy Williams writes Ethereum Derivatives Metrics Signal Modest Downside Tail Risk Ahead: Nansen
Jordan Lyanchev writes Weekly Bitcoin, Ethereum ETF Recap: Light at the End of the Tunnel for BTC
CryptoVizArt writes Will Weak Momentum Drive ETH to .5K? (Ethereum Price Analysis)
Jordan Lyanchev writes Bybit Hack Fallout: Arthur Hayes, Samson Mow Push for Ethereum Rollback
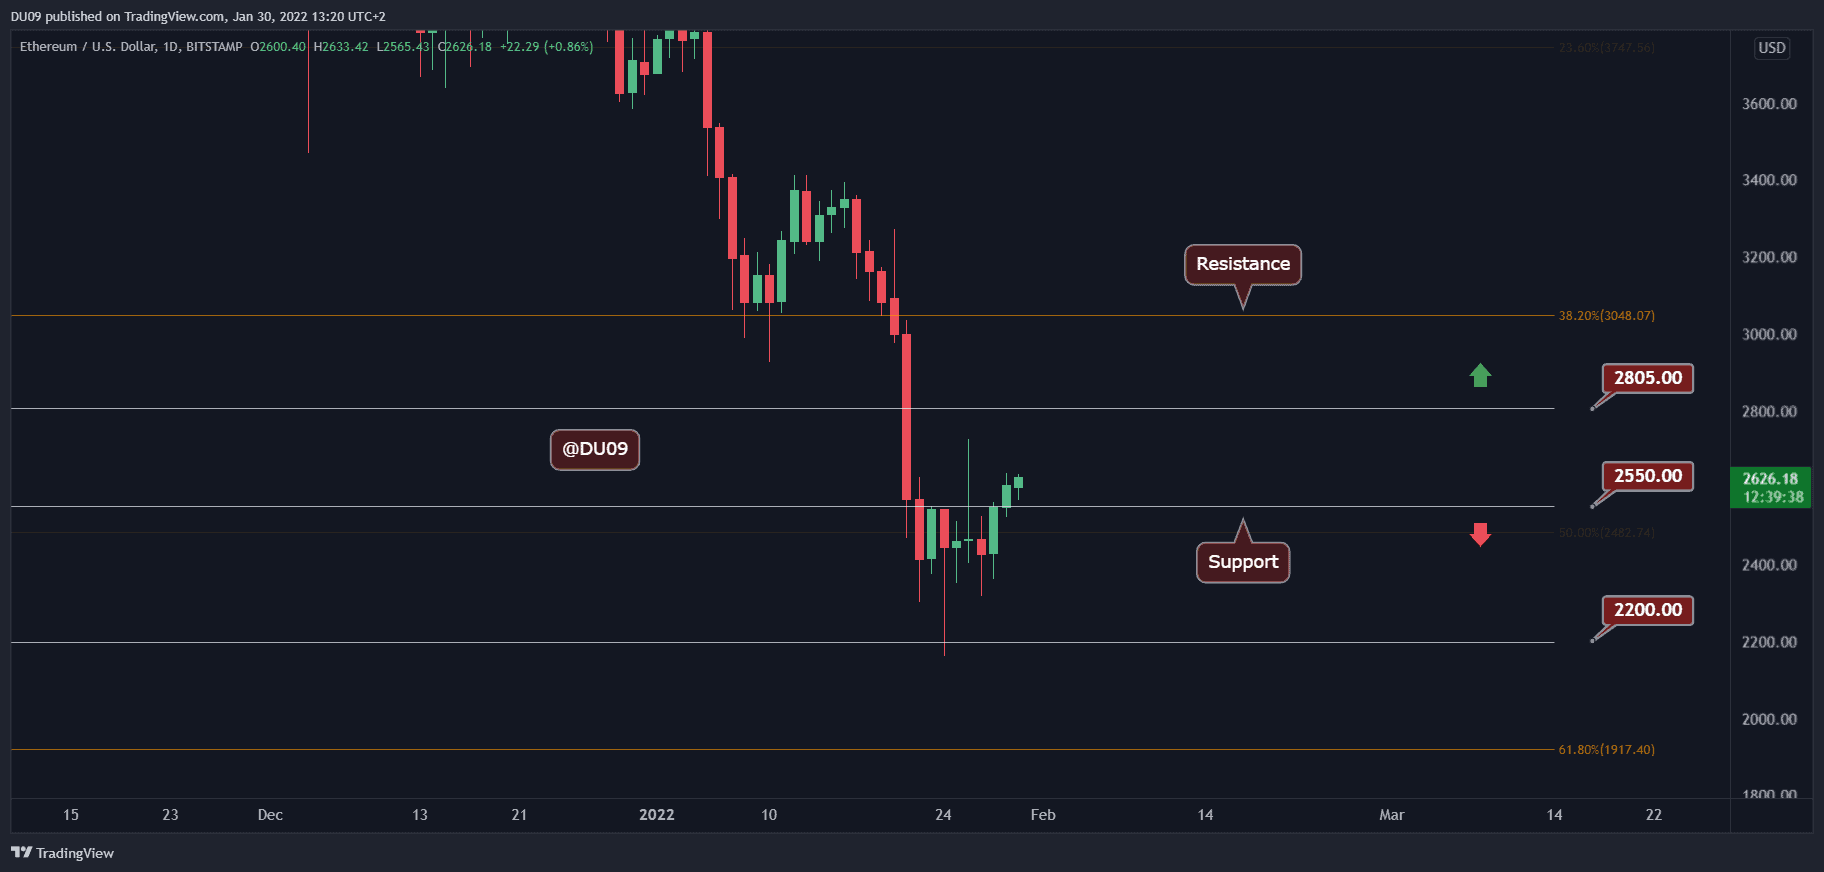
Ethereum managed to break above $2,600 after buyers took control of the short-term price action. Since recording a 6-month low on Monday ($2160), ETH recovered over 20%.
Key Support levels: $2,550, $2,200
Key Resistance levels: $2,805, $3,000
ETH had seen a positive weekend so far, managing to break and daily close above the critical resistance at $2,550 which has now turned into support. The immediate resistance is now found at $2,805 and if ETH maintains the bullish momentum, then the price might target the $3K milestone, which is a key psychological level.
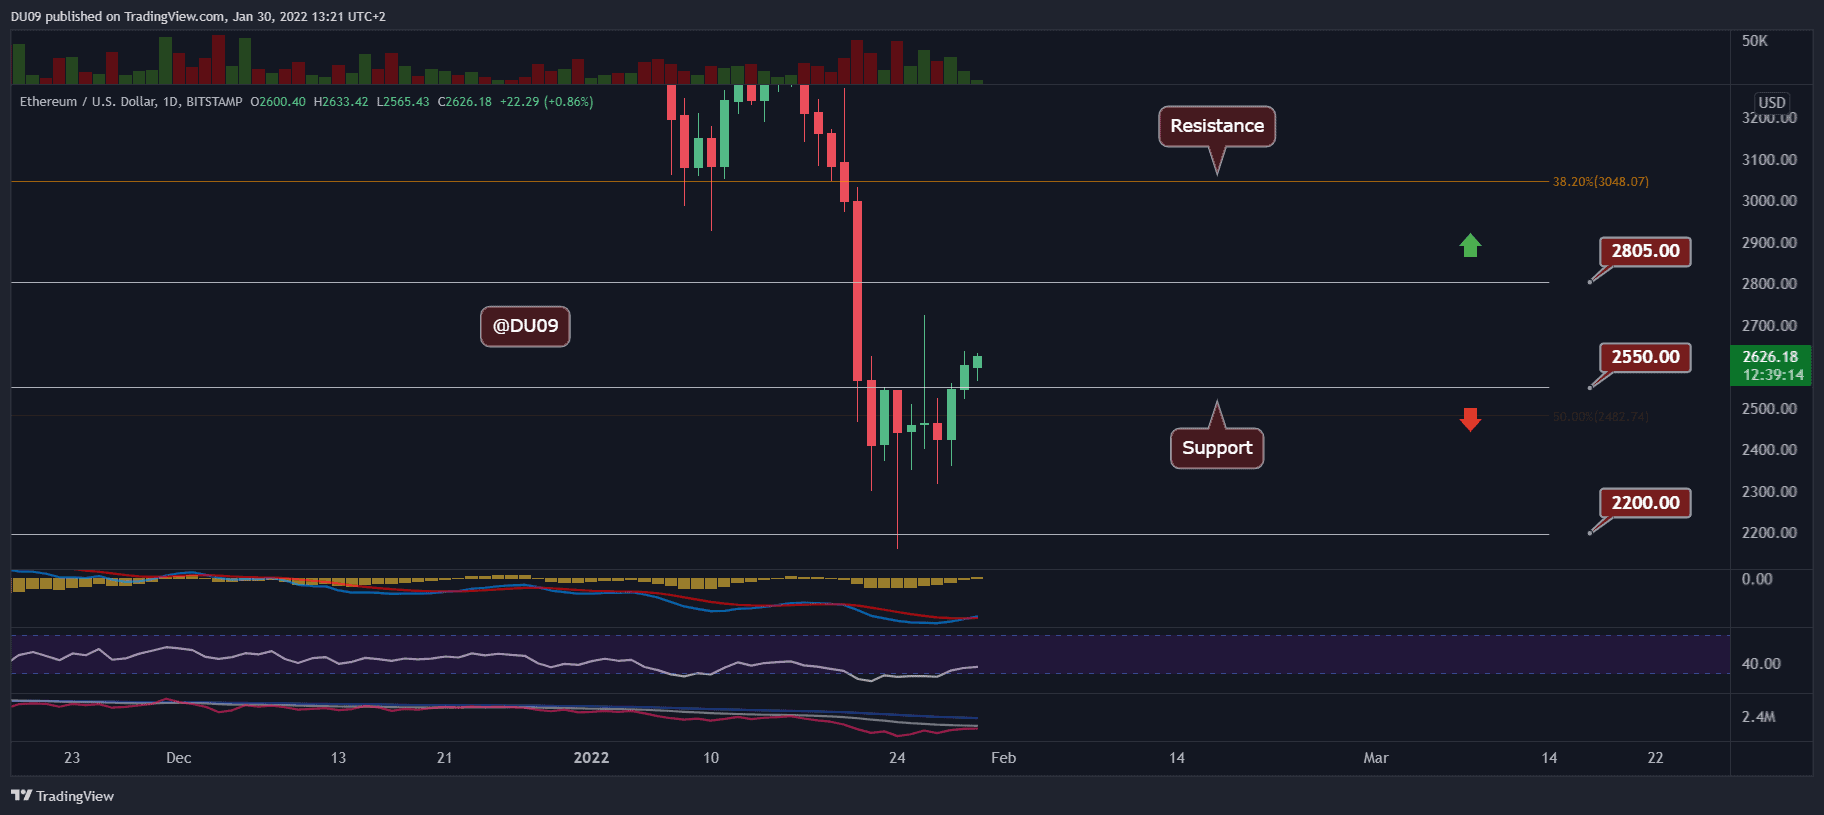
Technical Indicators
Trading Volume: Decent volume during this most recent rally. However, the weekend volume remains low, and best to wait for Monday to confirm the current price action’s momentum.
RSI: The RSI has surged above the oversold area and is moving higher. The most important thing is for the RSI to make a higher high and break away from the downtrend that has lasted since November.
MACD: Good news for buyers as the daily MACD did a bullish crossover today. This can indicate the start of a significant rally that can push ETH back towards $3,000.
Bias
The current bias for ETH is short-term bullish, as shown by the indicators.
Short-Term Price Prediction for ETH
ETH is giving some clear bullish signals and appears ready to move even higher. If ETH can break the resistance at $2,805 and then challenge the key psychological level at $3,000. The momentum over the weekend is not the strongest, thus best to wait for the Monday’s price action to confirm the current bias.