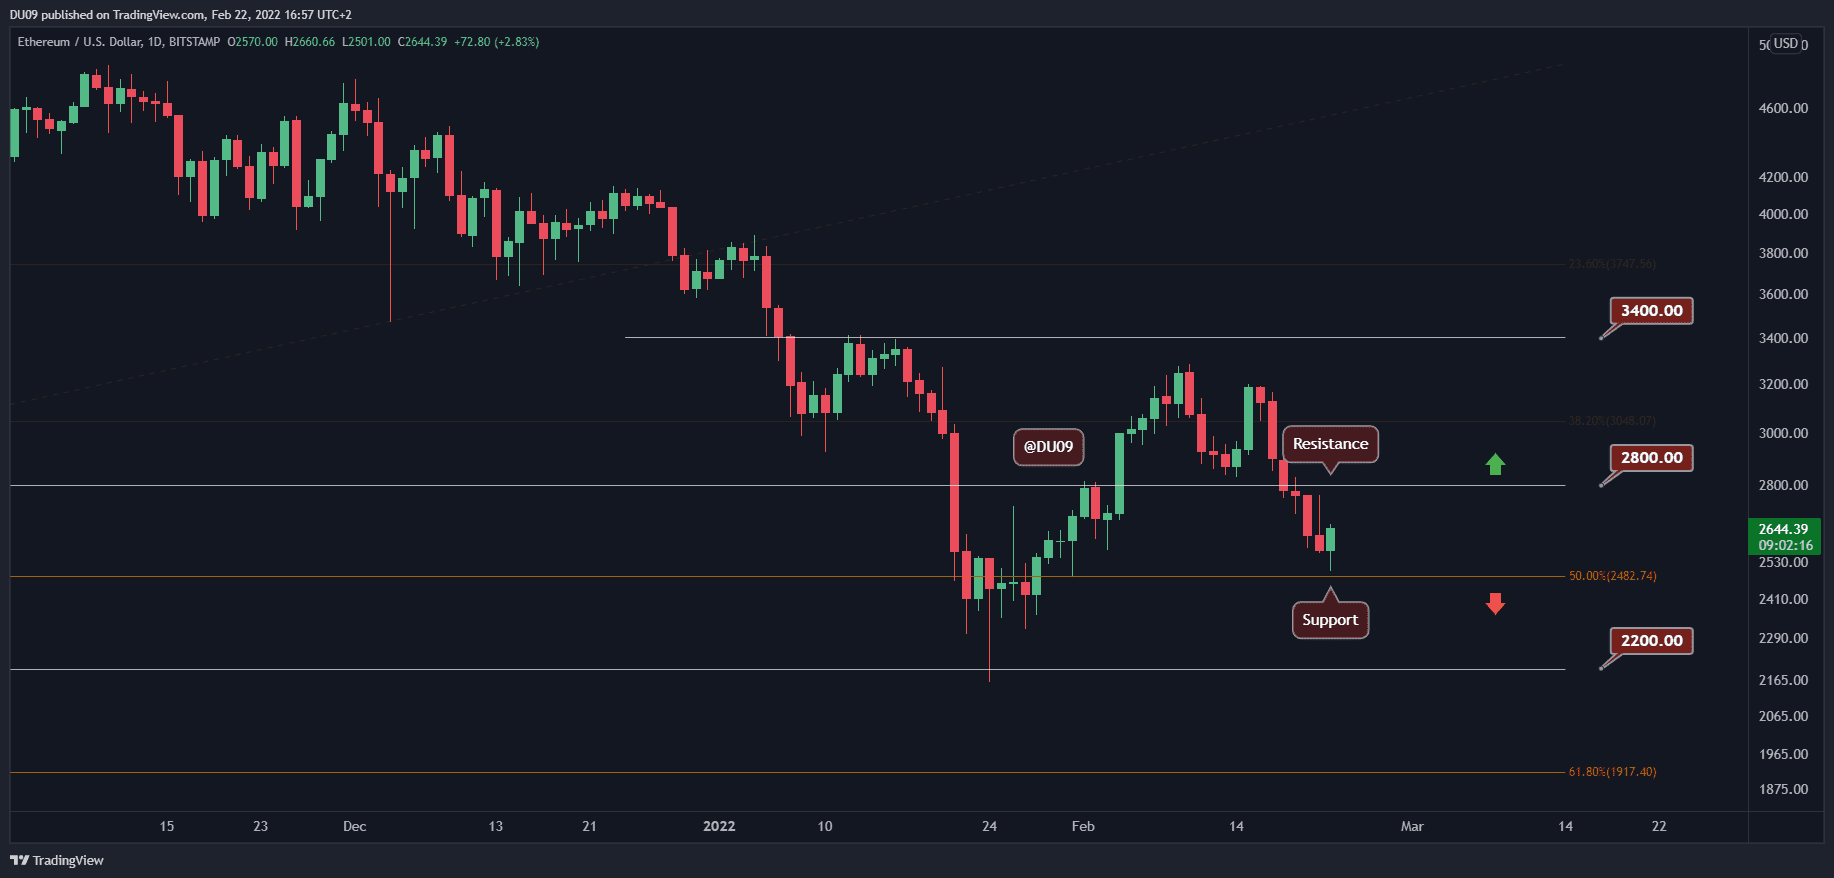
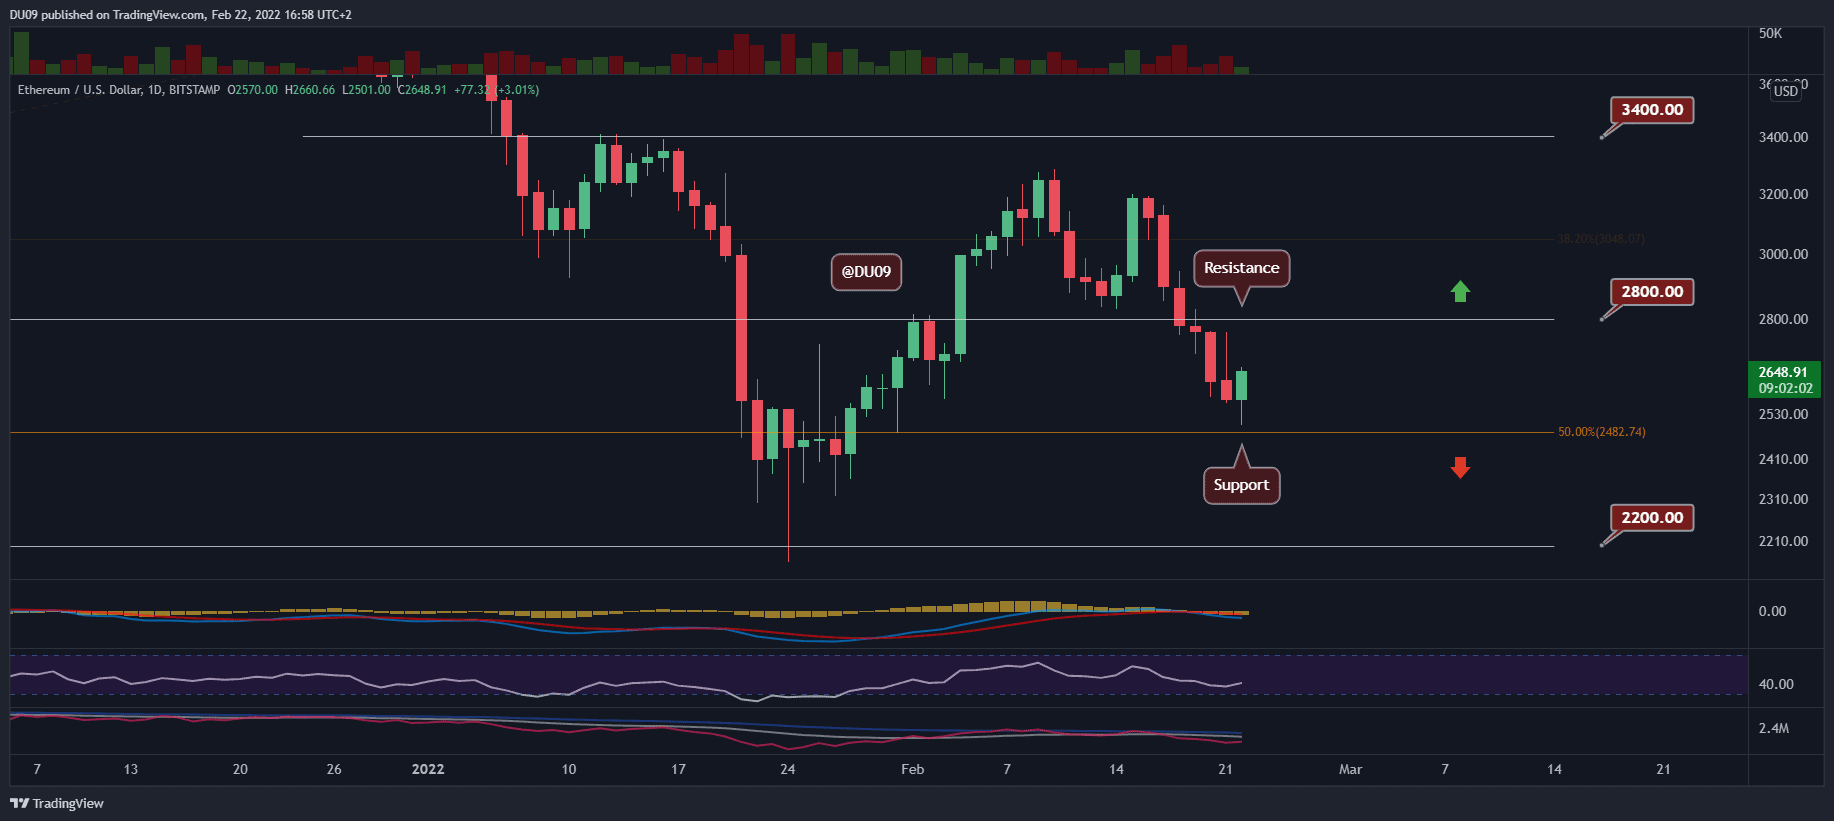
Key Support levels: ,500, ,200 Key Resistance levels: ,800, ,000 The correction appears to have ended, at least in the short term, with the price touching the key support at ,500. Now there is a worthy attempt to go higher towards the key resistance at ,800. After closing in red for six consecutive days, ETH may finally have a green one. Chart by TradingViewTechnical Indicators Trading Volume: Today’s volume is rather weak. If the reversal is to be trusted, then the volume has to go up too. RSI: The daily RSI is curving up after making a lower low. The question is if the price can move above 50 points where it will face resistance. MACD: The daily MACD histogram is showing a loss of momentum on the seller’s side. This is encouraging, and ETH may attempt a short
Topics:
Duo Nine considers the following as important: ETH Analysis, ETHBTC, Ethereum (ETH) Price, ethusd
This could be interesting, too:
Mandy Williams writes Ethereum Derivatives Metrics Signal Modest Downside Tail Risk Ahead: Nansen
Jordan Lyanchev writes Weekly Bitcoin, Ethereum ETF Recap: Light at the End of the Tunnel for BTC
CryptoVizArt writes Will Weak Momentum Drive ETH to .5K? (Ethereum Price Analysis)
Jordan Lyanchev writes Bybit Hack Fallout: Arthur Hayes, Samson Mow Push for Ethereum Rollback
Key Support levels: $2,500, $2,200
Key Resistance levels: $2,800, $3,000
The correction appears to have ended, at least in the short term, with the price touching the key support at $2,500. Now there is a worthy attempt to go higher towards the key resistance at $2,800. After closing in red for six consecutive days, ETH may finally have a green one.
Technical Indicators
Trading Volume: Today’s volume is rather weak. If the reversal is to be trusted, then the volume has to go up too.
RSI: The daily RSI is curving up after making a lower low. The question is if the price can move above 50 points where it will face resistance.
MACD: The daily MACD histogram is showing a loss of momentum on the seller’s side. This is encouraging, and ETH may attempt a short rally towards $2,800 soon.
Bias
The current bias for ETH is neutral. If ETH closes today’s candle in green, then buyers may have reasons to celebrate soon.
Short-Term Price Prediction for ETH
The cryptocurrency appears to be at the end of its correction, and a relief rally seems likely. The critical support at $2,500 was successfully tested, and the price may move higher from here. The resistance at $2,800 is the biggest obstacle at this time.