The Friday crash had driven ETH below ,500, wicking at ,300 – a price not seen since July 2021. Key Support levels: ,300, ,000. Key Resistance levels: ,500, ,750, 3,000 This week’s market carnage was not kind to ETH, which recorded a daily close below ,000 for the first time since the end of September. Furthermore, ETH saw a low of ,300 on Bitstamp, at the peak of the collapse. Since yesterday, ETH was able to rebound till encountering the ,500 support turned resistance. After losing the ,000 support, ETH likely entered a significant correction that may take months to recover. Chart by TradingViewTechnical Indicators Trading Volume: Very high volume was recorded during the selloff on Friday. The bears are in control. RSI: The daily RSI also got slammed
Topics:
Duo Nine considers the following as important: ETH Analysis, ETHBTC, Ethereum (ETH) Price, ethusd
This could be interesting, too:
Mandy Williams writes Ethereum Derivatives Metrics Signal Modest Downside Tail Risk Ahead: Nansen
Jordan Lyanchev writes Weekly Bitcoin, Ethereum ETF Recap: Light at the End of the Tunnel for BTC
CryptoVizArt writes Will Weak Momentum Drive ETH to .5K? (Ethereum Price Analysis)
Jordan Lyanchev writes Bybit Hack Fallout: Arthur Hayes, Samson Mow Push for Ethereum Rollback
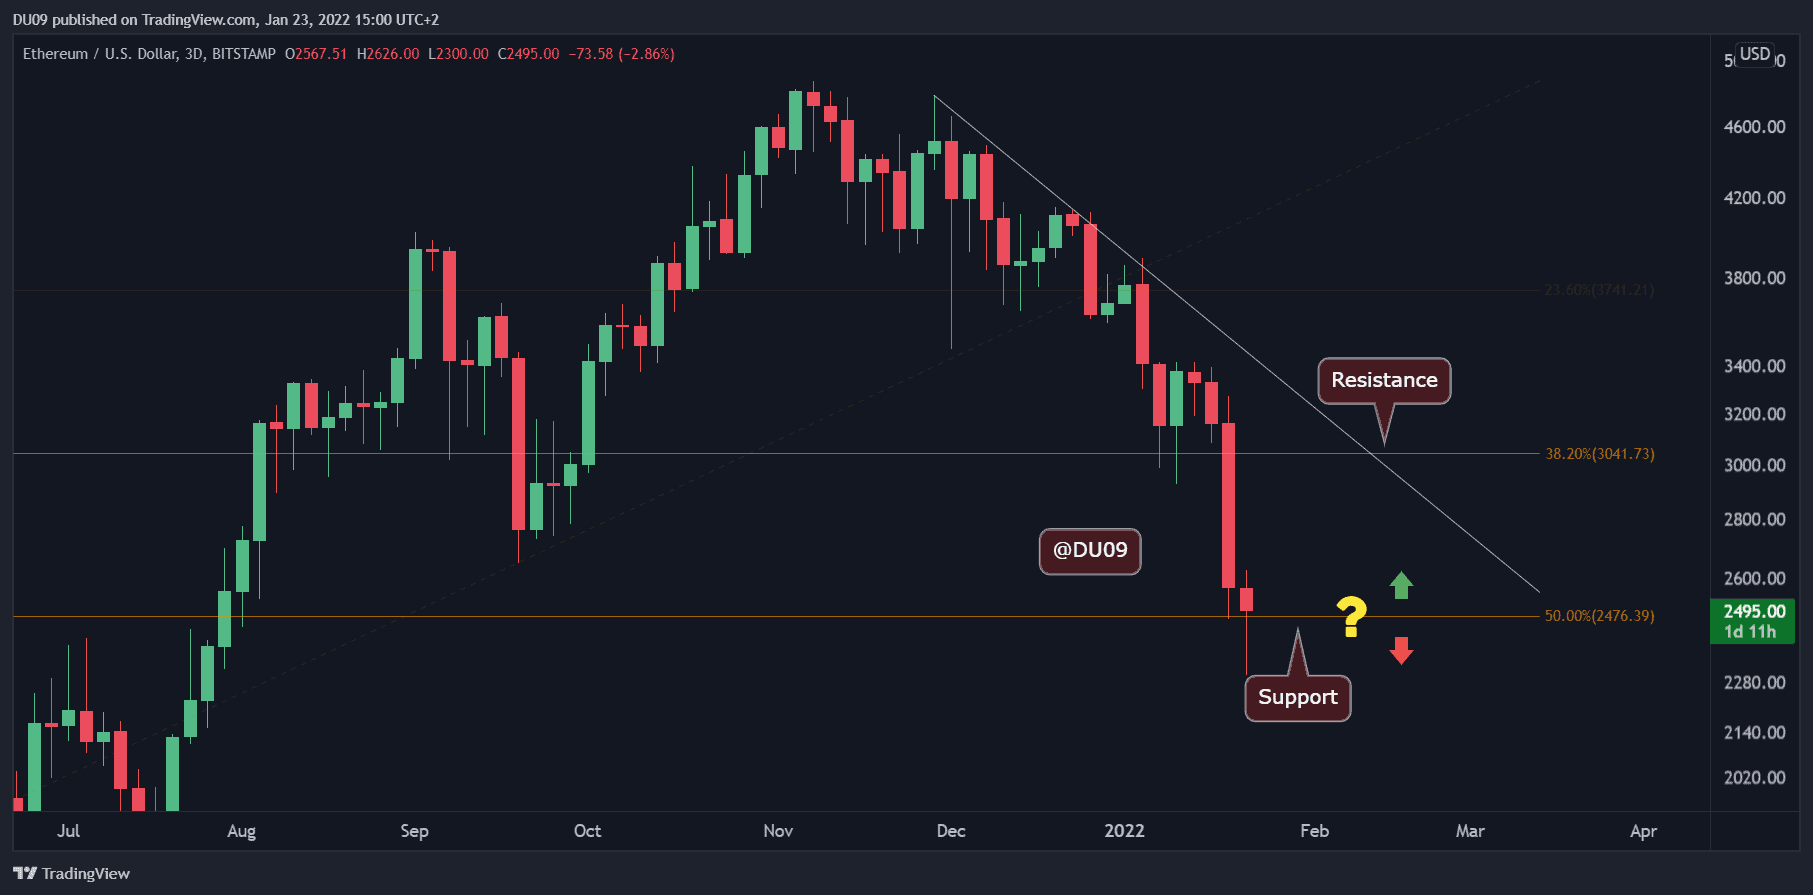
The Friday crash had driven ETH below $2,500, wicking at $2,300 – a price not seen since July 2021.
Key Support levels: $2,300, $2,000.
Key Resistance levels: $2,500, $2,750, 3,000
This week’s market carnage was not kind to ETH, which recorded a daily close below $3,000 for the first time since the end of September. Furthermore, ETH saw a low of $2,300 on Bitstamp, at the peak of the collapse.
Since yesterday, ETH was able to rebound till encountering the $2,500 support turned resistance. After losing the $3,000 support, ETH likely entered a significant correction that may take months to recover.
Technical Indicators
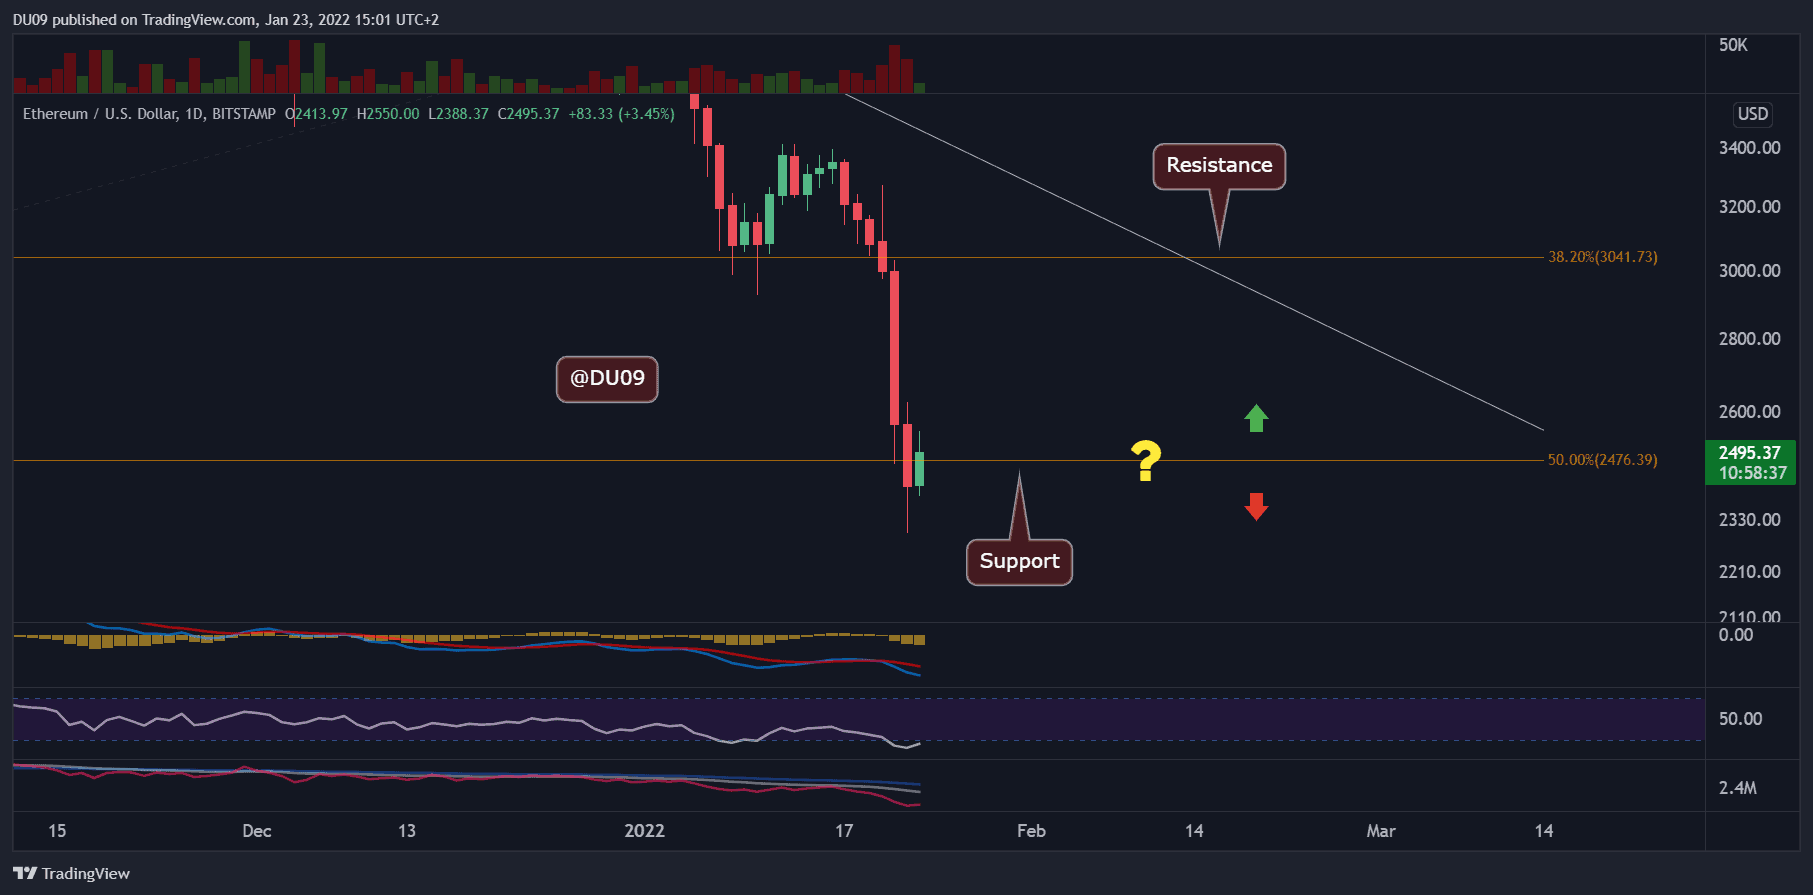
Trading Volume: Very high volume was recorded during the selloff on Friday. The bears are in control.
RSI: The daily RSI also got slammed in line with the price, reaching 21 points and, just as Bitcoin, the RSI is currently deep in the oversold area. Price may enter a relief rally, but unlikely for the mid-term correction to end even if that happens.
MACD: Daily MACD quickly fell into the bearish territory with the histogram and moving averages expanding on the negative side. A reversal appears unlikely in the short term, as sellers completely control the market.
Bias
The bias for ETH is currently bearish. With the $3,000 support breakdown, ETH entered an intense correction.
Short-Term Price Prediction for ETH
It is unlikely that the correction will end anytime soon and any relief rally will only be temporary as ETH seeks a bottom. Until that is found, the next support level, should $2,300 fail, is located at $2,000. The next major resistance is $2500, followed by September lows at $2750.