Over the past few days, ETH has been trading inside a descending wedge formation. The next significant price move will likely take place upon a breakout of the pattern. Key Support levels: ,600, ,300 Key Resistance levels: ,800, 4,000 ETH has managed to hold above the key support at ,600. Since then, the price is heading towards the upper boundary of the descending wedge (marked blue on the following chart), which will likely act as resistance. As of now, this level lies around ,800. Should ETH price manage to break above the wedge, which is a textbook bullish formation (most of the breakouts are to the bullish side), then ETH attempt to target the k resistance once again. Chart by TradingViewTechnical Indicators Trading Volume: Decent volume recorded when ETH
Topics:
Duo Nine considers the following as important: ETH Analysis, ETHBTC, Ethereum (ETH) Price, ethusd
This could be interesting, too:
Mandy Williams writes Ethereum Derivatives Metrics Signal Modest Downside Tail Risk Ahead: Nansen
Jordan Lyanchev writes Weekly Bitcoin, Ethereum ETF Recap: Light at the End of the Tunnel for BTC
CryptoVizArt writes Will Weak Momentum Drive ETH to .5K? (Ethereum Price Analysis)
Jordan Lyanchev writes Bybit Hack Fallout: Arthur Hayes, Samson Mow Push for Ethereum Rollback
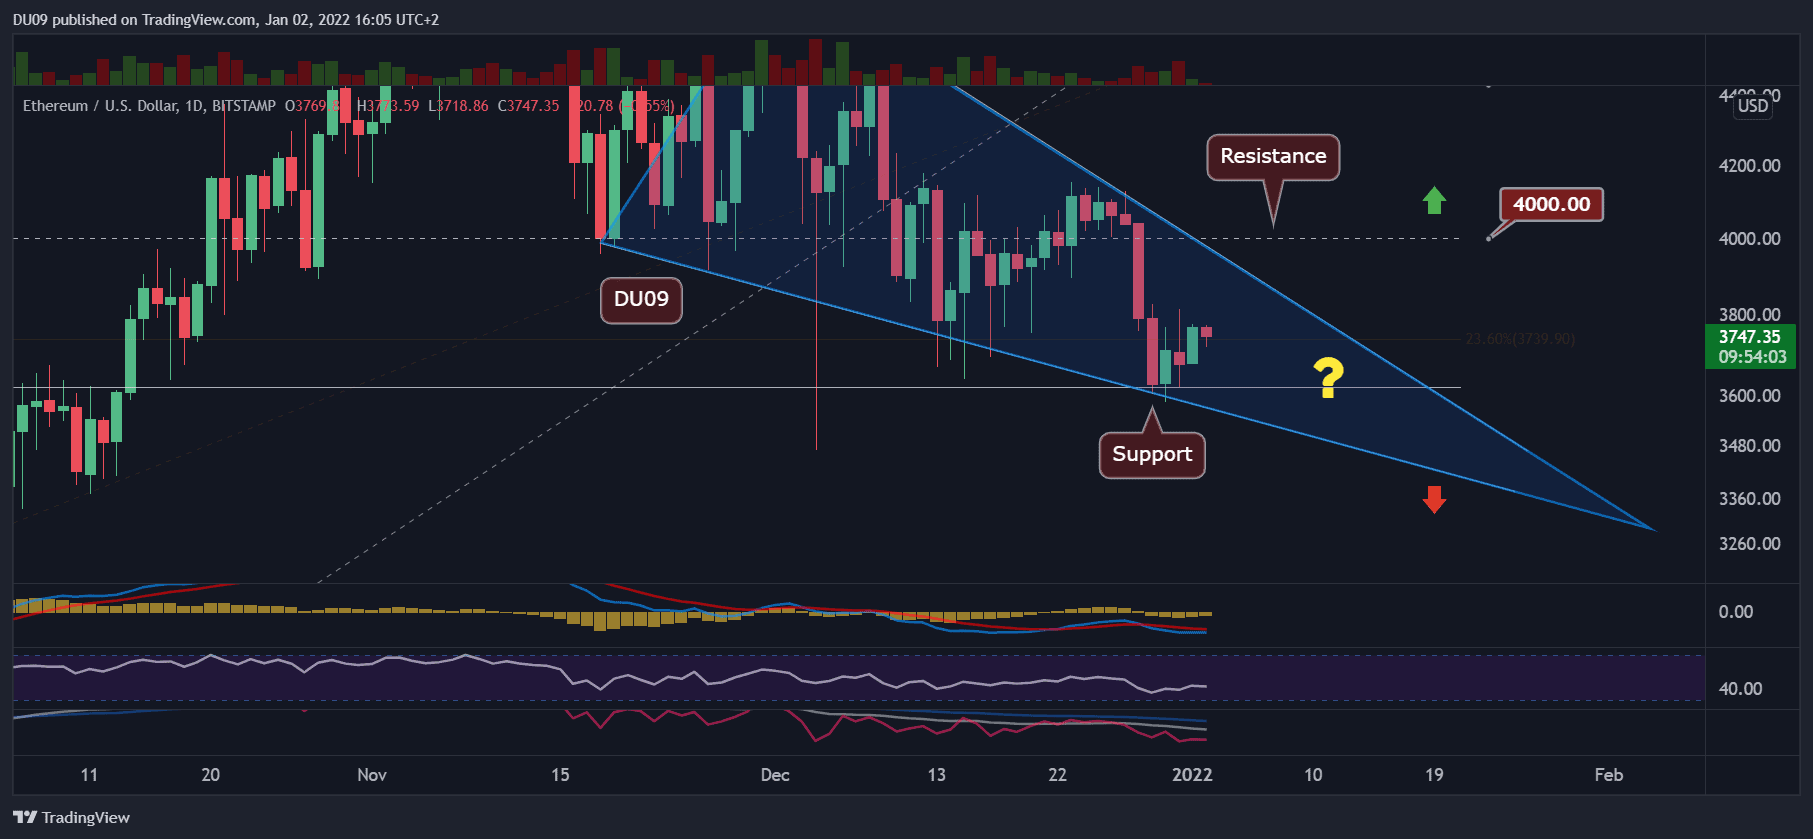
Over the past few days, ETH has been trading inside a descending wedge formation. The next significant price move will likely take place upon a breakout of the pattern.
Key Support levels: $3,600, $3,300
Key Resistance levels: $3,800, 4,000
ETH has managed to hold above the key support at $3,600. Since then, the price is heading towards the upper boundary of the descending wedge (marked blue on the following chart), which will likely act as resistance. As of now, this level lies around $3,800.
Should ETH price manage to break above the wedge, which is a textbook bullish formation (most of the breakouts are to the bullish side), then ETH attempt to target the $4k resistance once again.

Technical Indicators
Trading Volume: Decent volume recorded when ETH had tested the key support level of $3,600. However, the price is struggling to move higher and volume vanished as it moved up, which is usually a bearish sign, that shows that bears are in control of the market. Likely for ETH to drop again due to lack of momentum in the near term.
RSI: The daily RSI has gone through a lower low and so far has failed to make a higher high. This is a bearish sign and is likely not change until the price breaks out of the wedge.
MACD: While the daily MACD is bearish, the histogram makes higher lows, which is a bullish divergence that may come into play as soon as ETH breaks above the wedge (in the bullish case).
Bias
The bias for ETH is bearish. This bias might change in case ETH breaks above the wedge, followed by a decent amount of volume.
Short-Term Price Prediction for ETH
ETH is looking bearish over the short term. However, on a longer timeframe, the ETH price may break above the descending wedge, leading to a renewed interest in ETH.
Until a breakout occurs, the price will likely continue to bounce within the wedge boundaries. In case of a bearish breakout, then ETH will probably test the next major support level at $3,300.