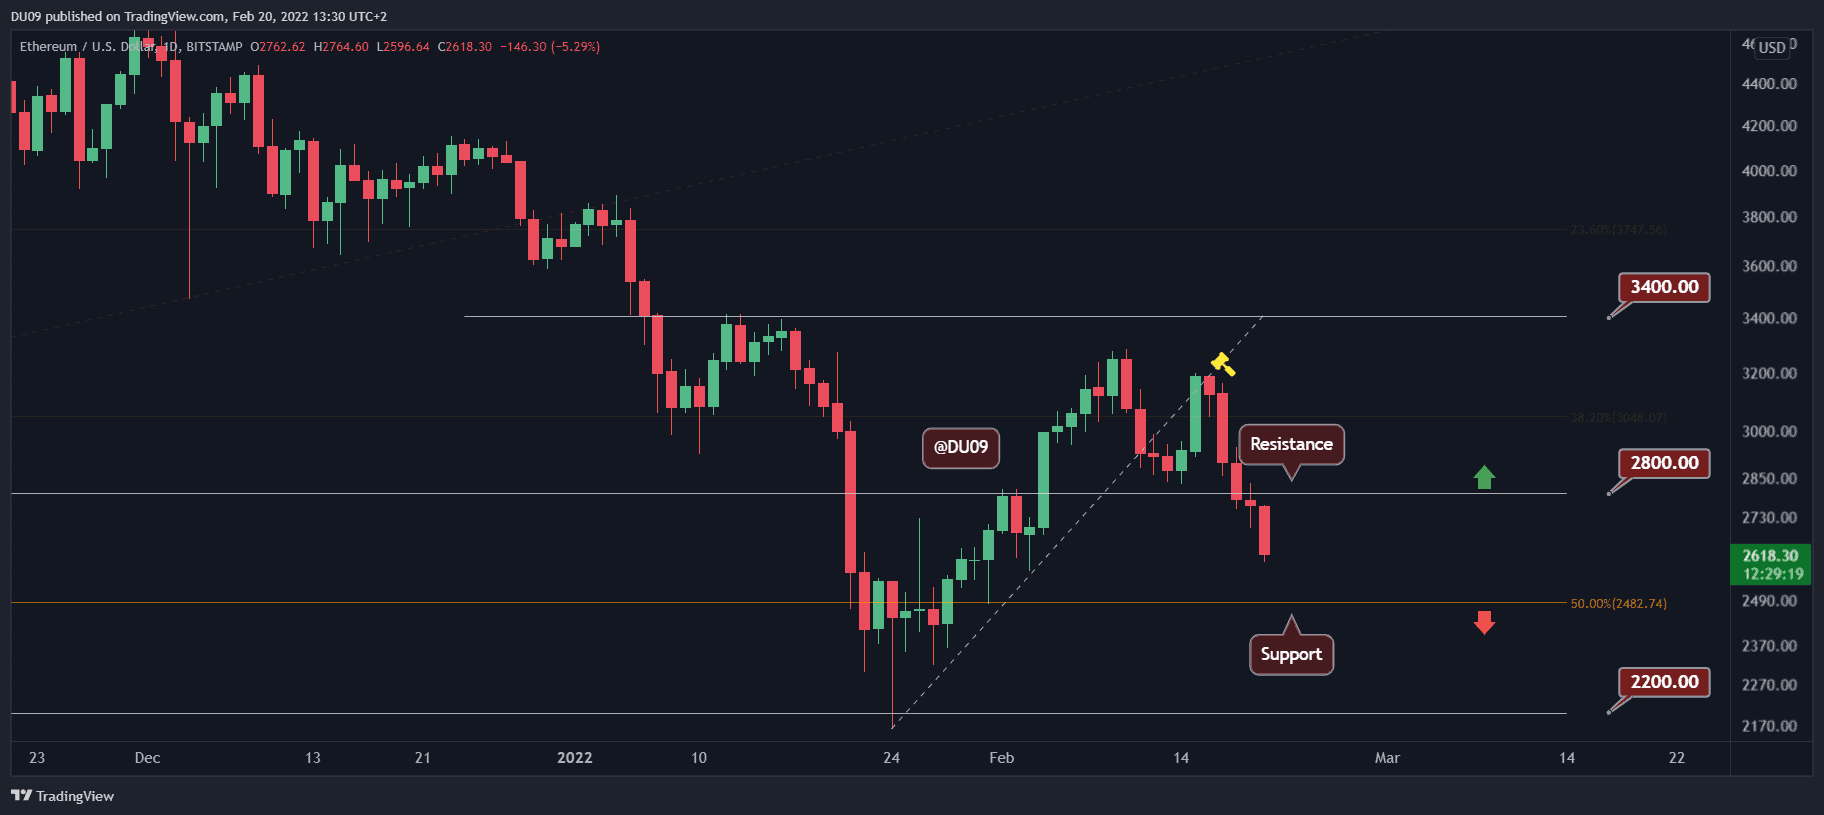
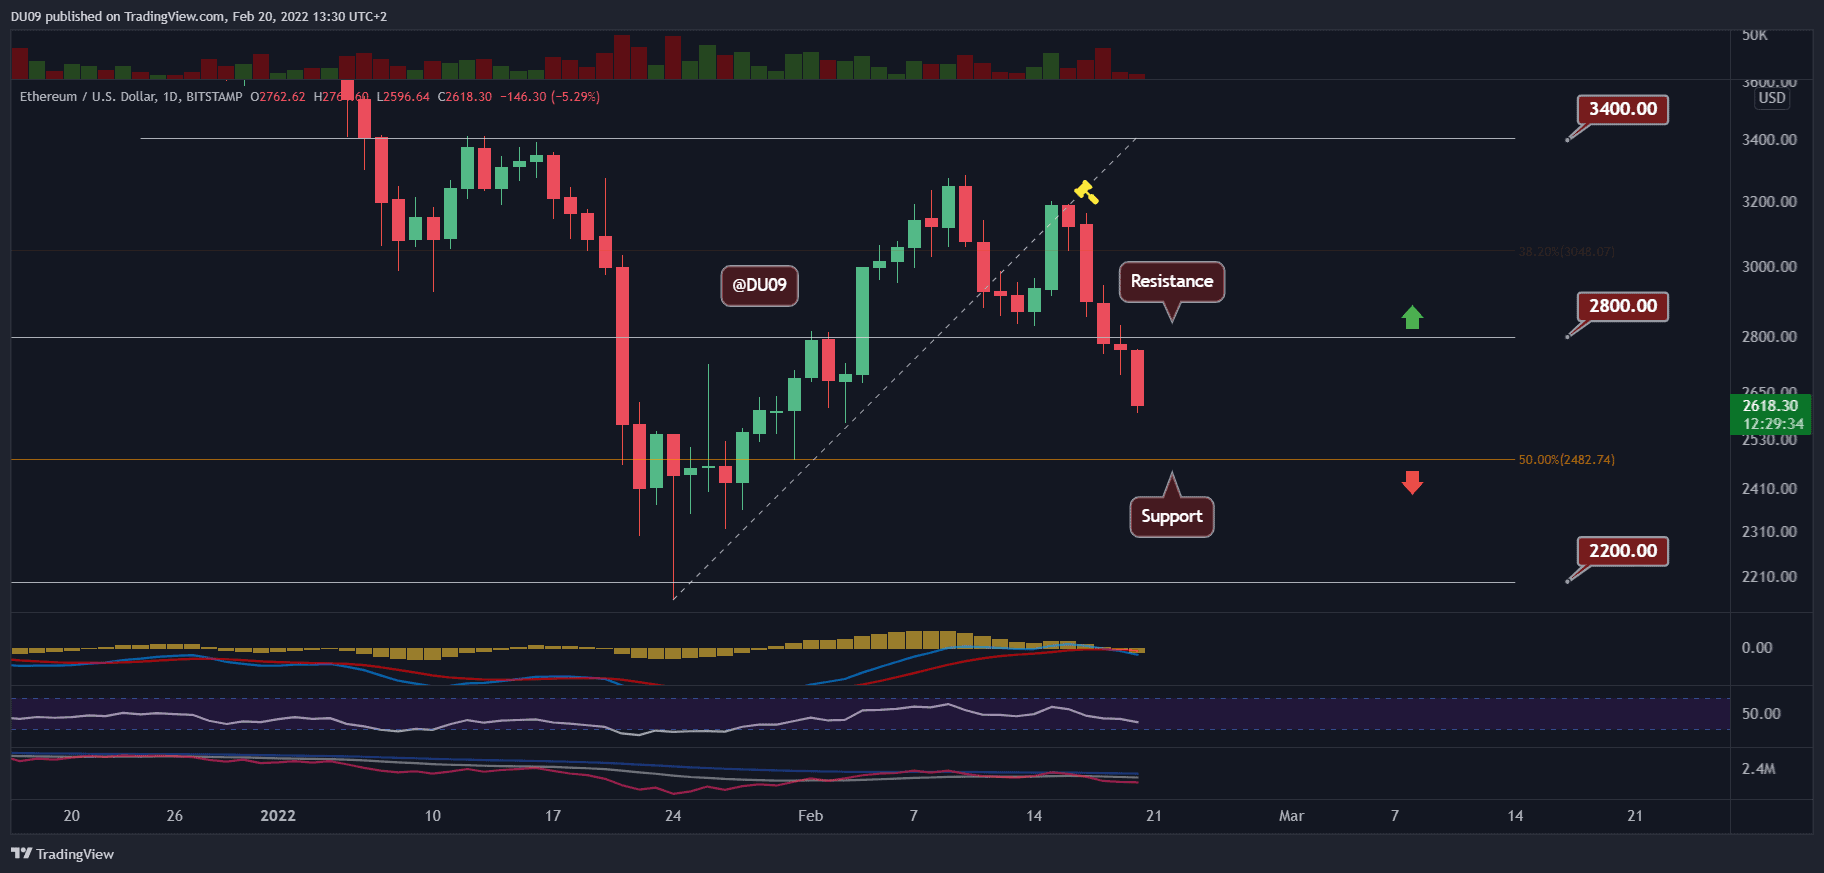
The market took a nosedive over the weekend, and now ETH is on a clear path to retest the ,500 support. According to market data by CoinGecko, ETH has been down 4% over the past day and 18% since Thursday. Key Support levels: ,500, ,200 Key Resistance levels: ,800, ,000 With a bearish cross on MACD and plunging price, the outlook for ETH is not great. The rejection at the ,800 resistance has intensified the sell-off. ETH is now heading towards the key support level at ,500. In case the latter level doesn’t hold, ETH might take another shot at January’s low amid 00. Chart by TradingViewTechnical Indicators Trading Volume: After five red days, the selling pressure was particularly strong last Friday, when the price moved below ,800, which is a bearish
Topics:
Duo Nine considers the following as important: ETH Analysis, ETHBTC, Ethereum (ETH) Price, ethusd
This could be interesting, too:
Mandy Williams writes Ethereum Derivatives Metrics Signal Modest Downside Tail Risk Ahead: Nansen
Jordan Lyanchev writes Weekly Bitcoin, Ethereum ETF Recap: Light at the End of the Tunnel for BTC
CryptoVizArt writes Will Weak Momentum Drive ETH to .5K? (Ethereum Price Analysis)
Jordan Lyanchev writes Bybit Hack Fallout: Arthur Hayes, Samson Mow Push for Ethereum Rollback
The market took a nosedive over the weekend, and now ETH is on a clear path to retest the $2,500 support. According to market data by CoinGecko, ETH has been down 4% over the past day and 18% since Thursday.
Key Support levels: $2,500, $2,200
Key Resistance levels: $2,800, $3,000
With a bearish cross on MACD and plunging price, the outlook for ETH is not great. The rejection at the $2,800 resistance has intensified the sell-off. ETH is now heading towards the key support level at $2,500.
In case the latter level doesn’t hold, ETH might take another shot at January’s low amid $2200.
Technical Indicators
Trading Volume: After five red days, the selling pressure was particularly strong last Friday, when the price moved below $2,800, which is a bearish sign.
RSI: The daily RSI is declining, in line with the recent price action. The RSI sits at 38 points at the time of this post, and there is still plenty of room to go lower until RSI reaches oversold conditions (below 30).
MACD: The daily MACD saw a bearish cross yesterday, and the price action today demonstrated it. This bearish momentum is expected to continue for some time.
Bias
The current bias for ETH is bearish. So far, support around $2,800 – $3K failed.
Short-Term Price Prediction for ETH
ETH is in a clear downtrend and appears ready to retest price levels not seen since last month. The first line of defense lies at $2,500, the next at $2,200. A breakdown below, and ETH will record a new low since July 2021.