Ethereum’s price has been trapped in a tight range recently, showing little intent to move significantly to either side. However, changes could be expected shortly. Technical Analysis By: Edris The Daily Chart On the daily timeframe, the price has been oscillating between the 50-day moving average located around the 00 mark and the 00 static support level, during the past 7 days. From a classical PA point of view, the market is likely to reach lower levels, as it has made a lower high and a lower low recently. In this case, 00 could break, and ETH could test the critical 200-day moving average, which is trending around the 00 level. On the other hand, if ETH climbs above the 50-day moving average, it would likely rally higher and eventually test the 00
Topics:
CryptoVizArt considers the following as important: ETH Analysis, ETHBTC, Ethereum (ETH) Price, ethusd
This could be interesting, too:
Mandy Williams writes Ethereum Derivatives Metrics Signal Modest Downside Tail Risk Ahead: Nansen
Jordan Lyanchev writes Weekly Bitcoin, Ethereum ETF Recap: Light at the End of the Tunnel for BTC
CryptoVizArt writes Will Weak Momentum Drive ETH to .5K? (Ethereum Price Analysis)
Jordan Lyanchev writes Bybit Hack Fallout: Arthur Hayes, Samson Mow Push for Ethereum Rollback
Ethereum’s price has been trapped in a tight range recently, showing little intent to move significantly to either side. However, changes could be expected shortly.
Technical Analysis
By: Edris
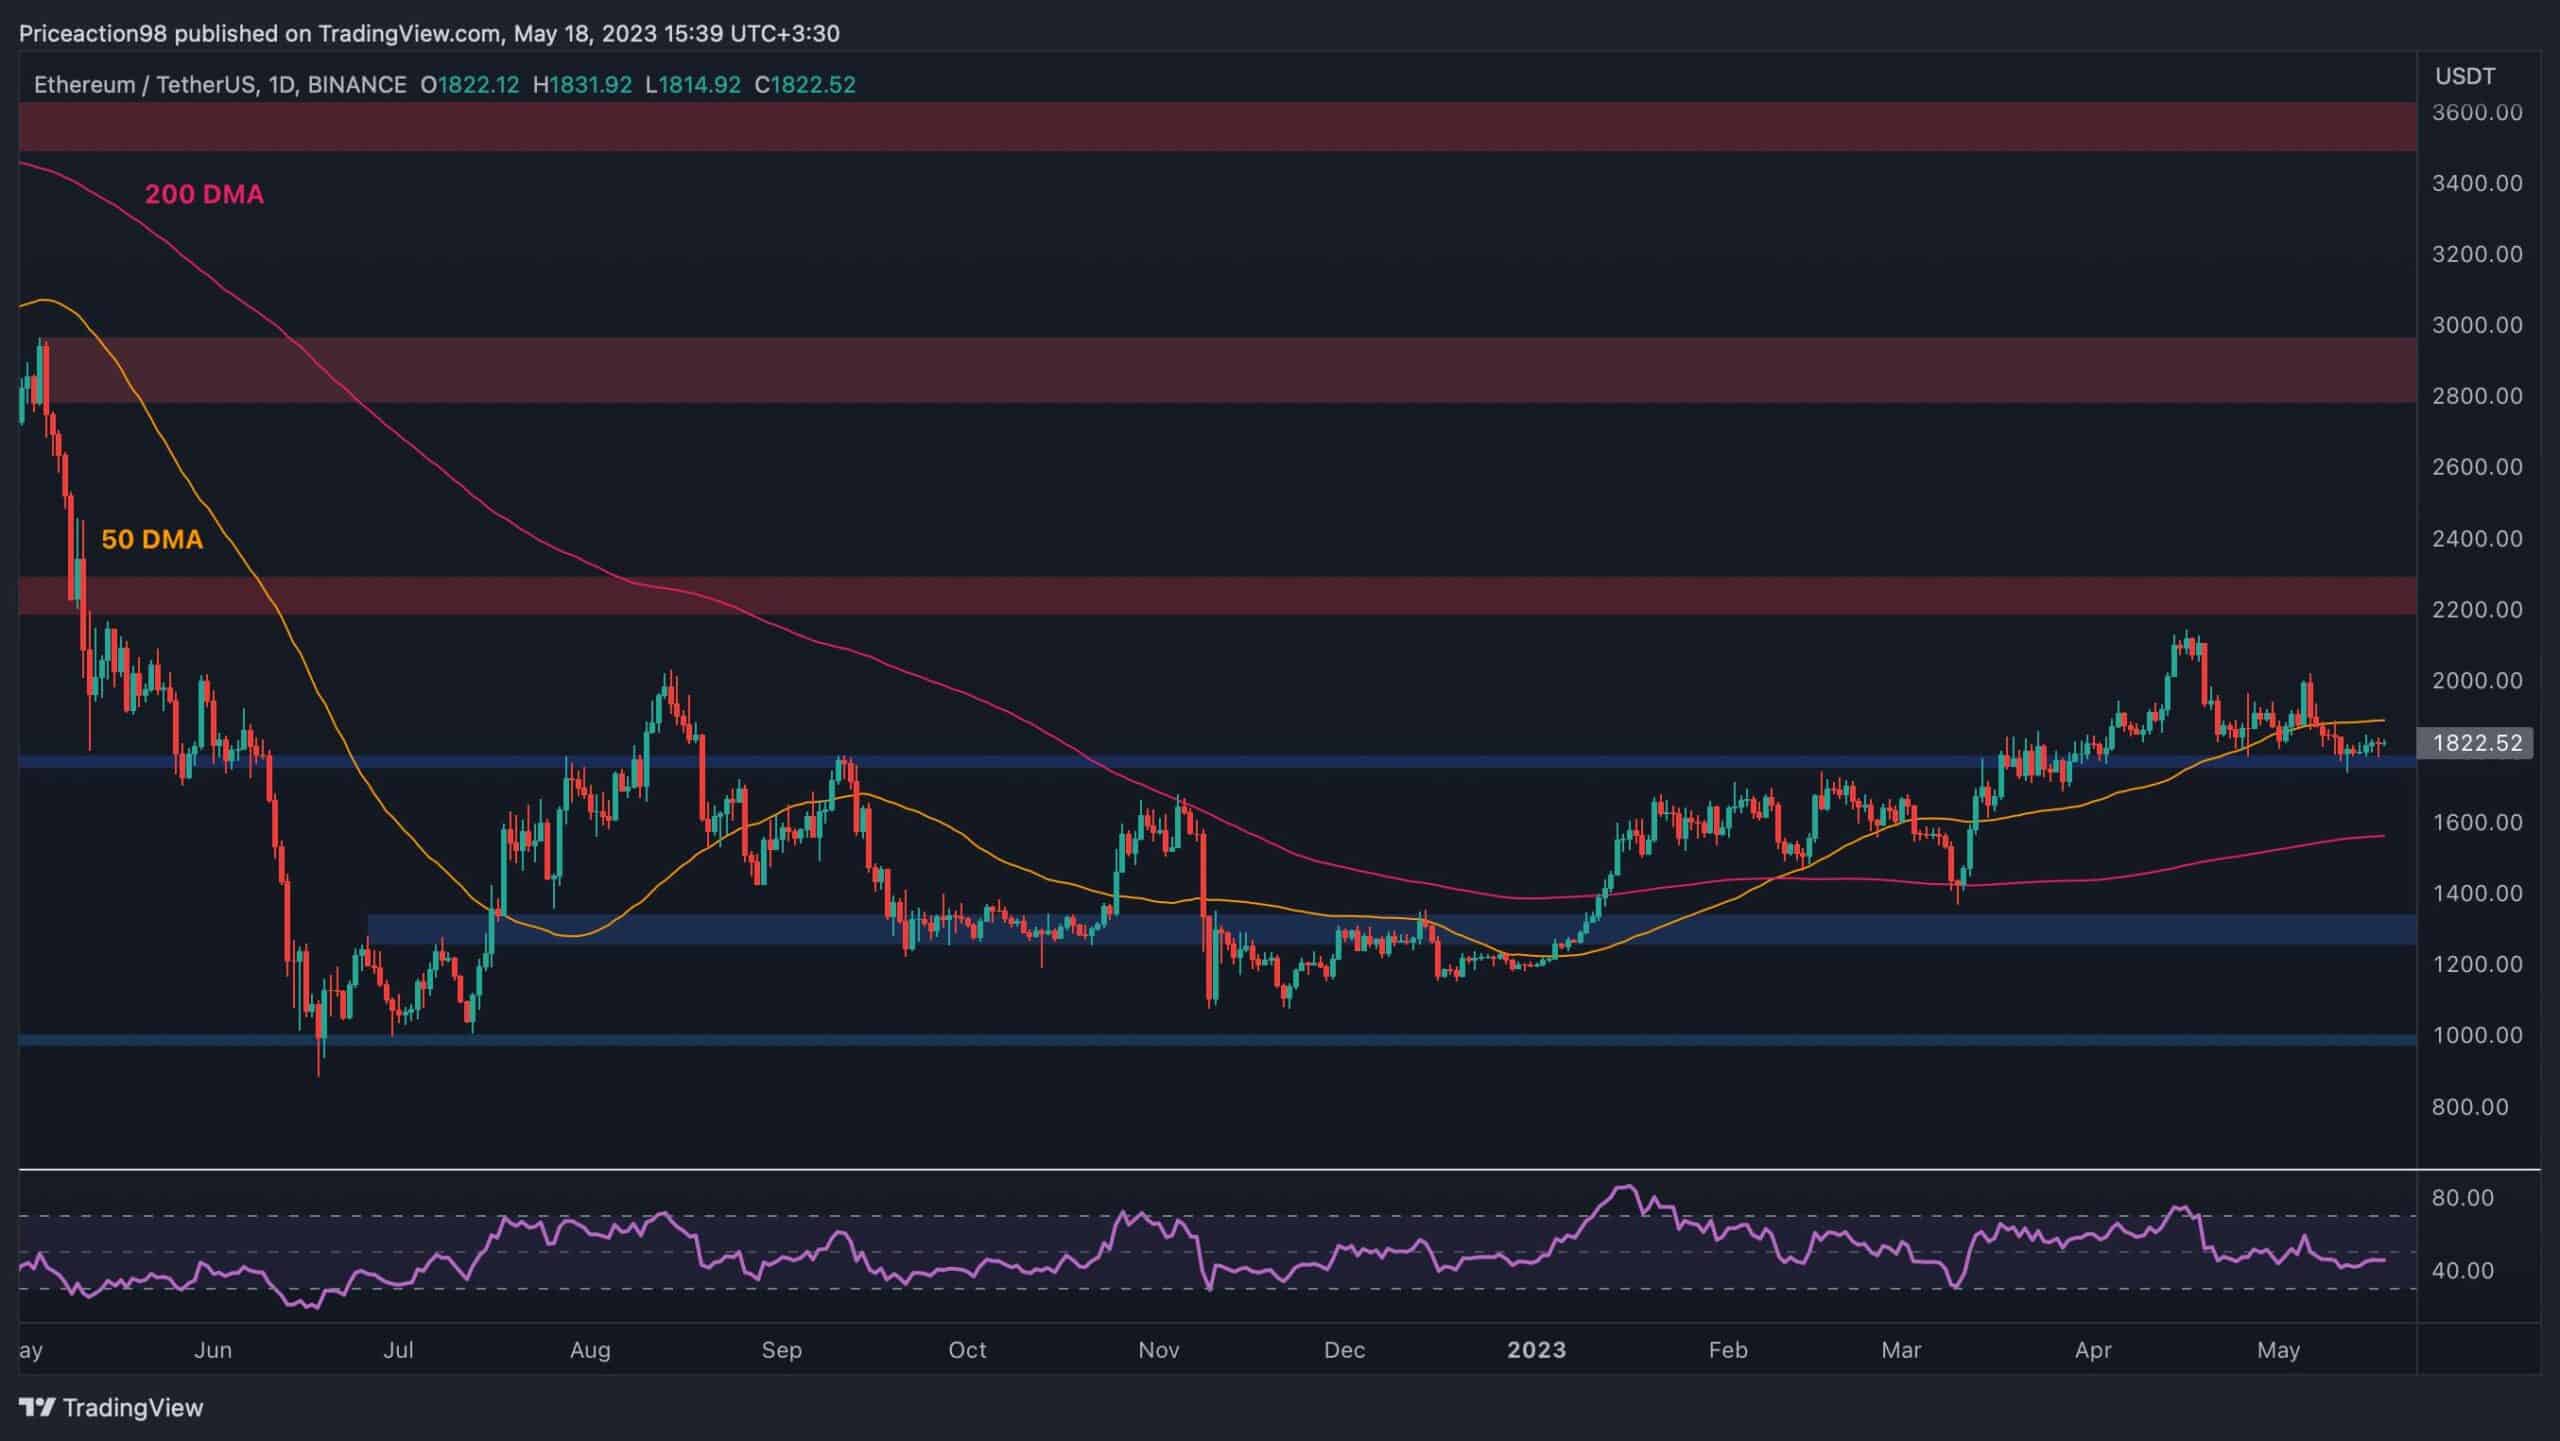
The Daily Chart
On the daily timeframe, the price has been oscillating between the 50-day moving average located around the $1900 mark and the $1800 static support level, during the past 7 days.
From a classical PA point of view, the market is likely to reach lower levels, as it has made a lower high and a lower low recently. In this case, $1800 could break, and ETH could test the critical 200-day moving average, which is trending around the $1600 level.
On the other hand, if ETH climbs above the 50-day moving average, it would likely rally higher and eventually test the $2200 resistance area in the short term.
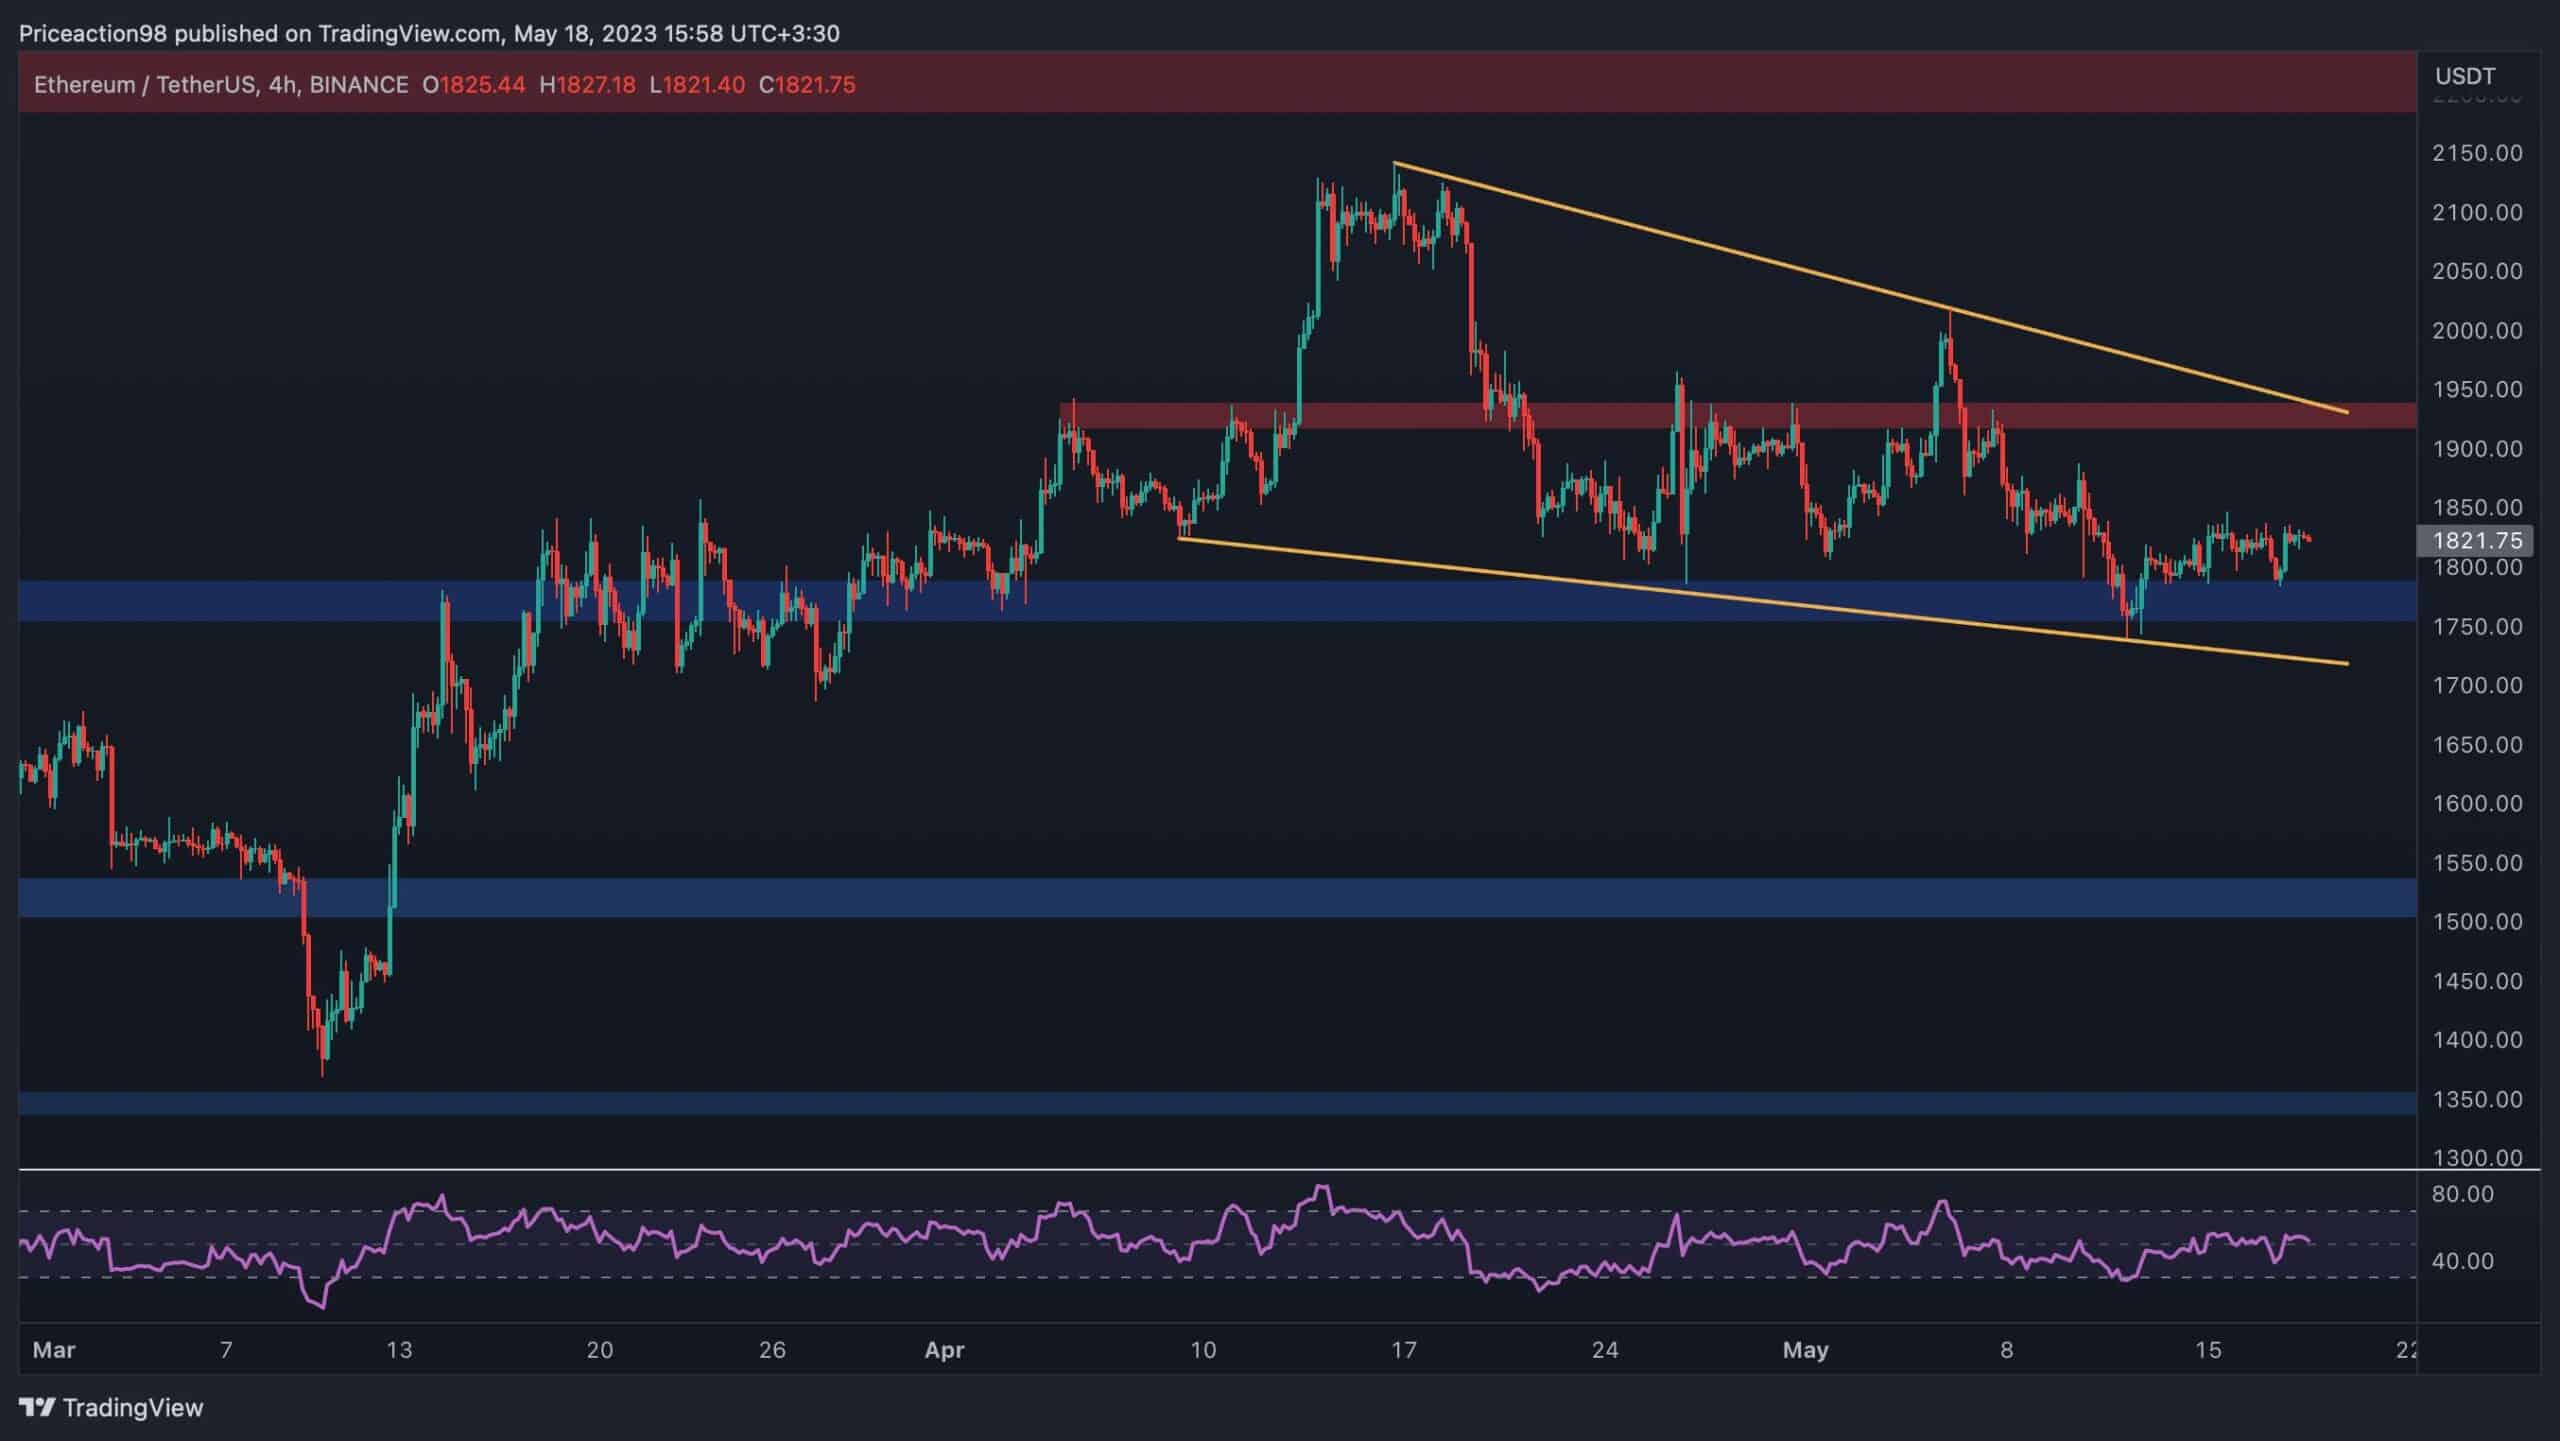
The 4-Hour Chart
Looking at the 4-hour chart, it is evident that the price has formed a large falling wedge pattern below the $2000 mark. A breakout above this pattern would be a classical continuation pattern, which would probably result in a run toward the $2200 resistance zone.
Even so, the price still has a long way to reach the higher boundary of the pattern, as it is currently testing the $1800 support area. The RSI indicator also provides minimal insight, as it has been running relatively flat around the 50% mark, pointing to an equilibrium in momentum.
Sentiment Analysis
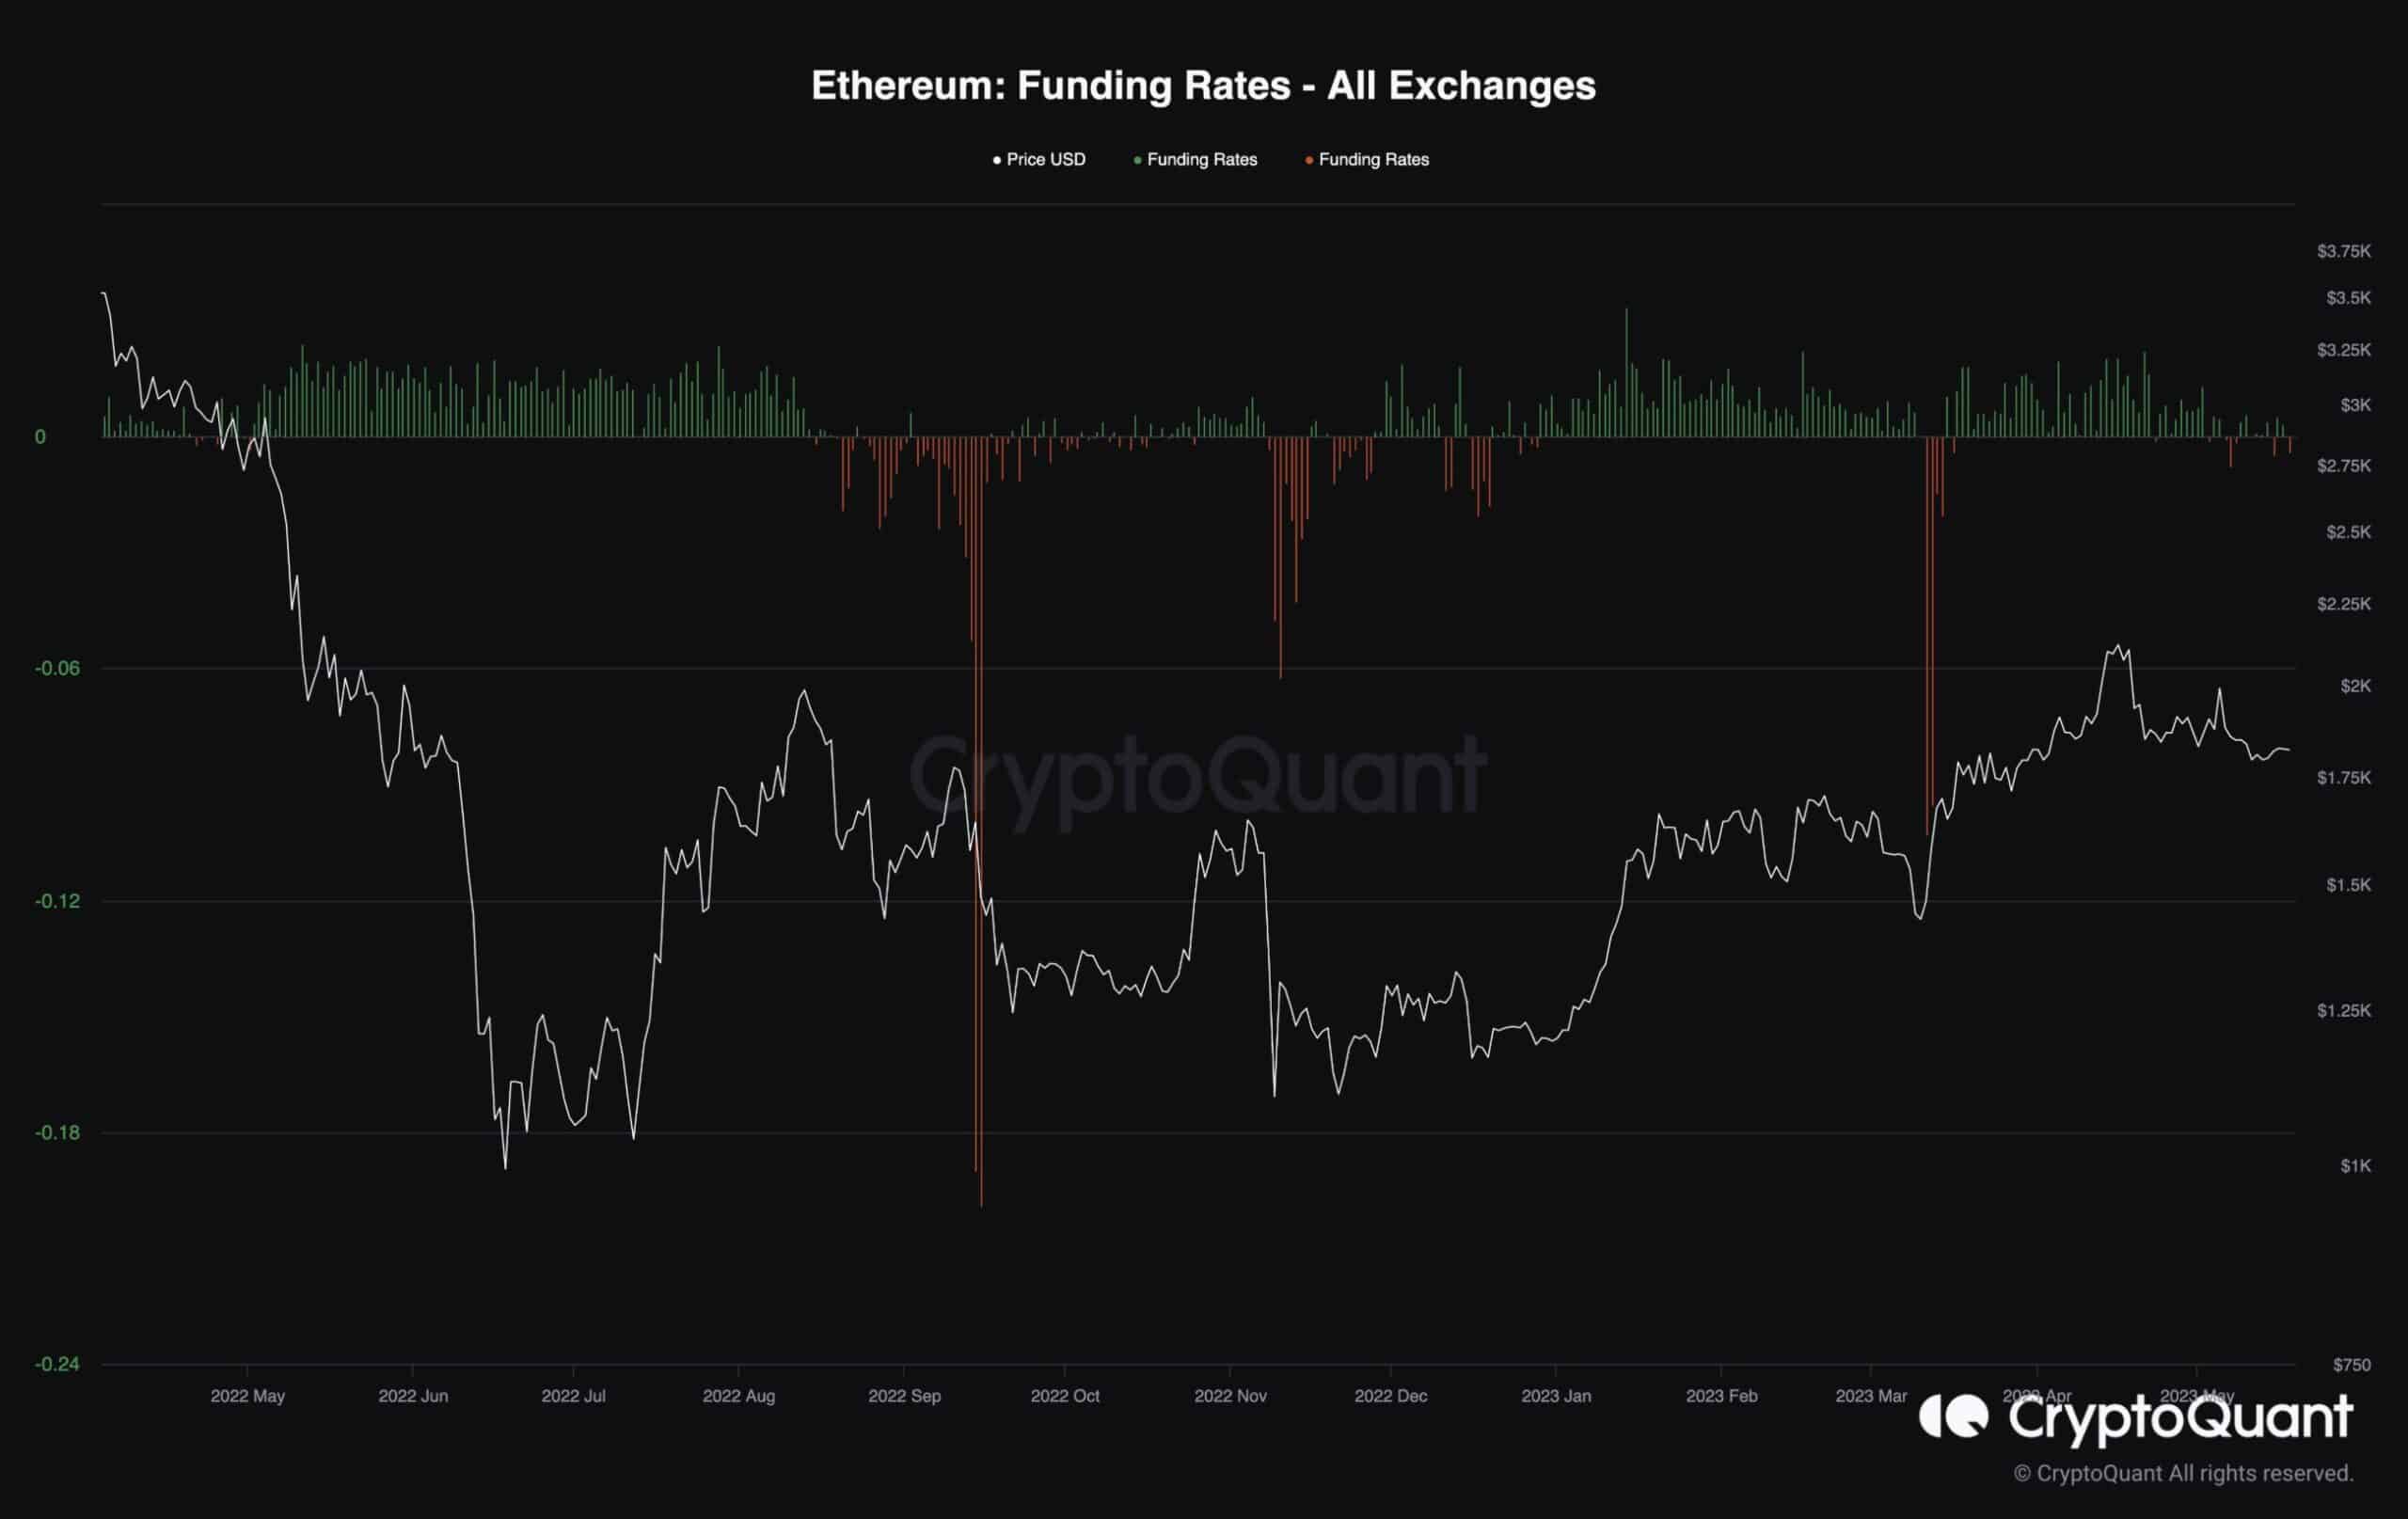
Ethereum Funding Rates
Ethereum’s price was rejected below the $2,000 mark over the last few weeks and has been consolidating ever since. The indecisiveness on the chart can also be witnessed by evaluating the futures market sentiment.
This chart demonstrates the funding rates metric, which indicates whether the futures market sentiment is relatively bullish or bearish. Positive values are associated with bullish market sentiment, while negative ones show bearish sentiment.
It is clear that following a period of consistently positive funding rates during the price rally since early 2023, this metric has been showing small positive and negative values with no particular consistency.
It could be interpreted that neither the bulls nor the bears have established their dominance in the futures market, and the price could still move rangebound until things change in the derivatives.