Ripple’s price has found support at the significant 200-day moving average at around %excerpt%.41, leading to a robust uptrend. Should it continue its surge, Ripple’s next destination will be the resistance zone at %excerpt%.56, but what if the bears take control? Technical Analysis By Shayan The Daily Chart Analyzing the daily chart reveals that following several weeks of rejection, the price has finally found support at the 200-day moving average of %excerpt%.41, initiating an upward trend. Consequently, the recent rejection phase can be described as a mid-term consolidation correction stage, which is vital for a healthy bullish rally. This indicates that XRP could attempt to breach the %excerpt%.56 barrier. If the price manages to surpass this critical zone, it is likely to enter a long-term
Topics:
CryptoVizArt considers the following as important: Ripple (XRP) Price, XRP Analysis, xrpbtc, xrpusd
This could be interesting, too:
Jordan Lyanchev writes Ripple’s (XRP) Surge to Triggers Over Million in Short Liquidations
Jordan Lyanchev writes Trump Confirms Work on Strategic Crypto Reserve: XRP, ADA, SOL Included
Dimitar Dzhondzhorov writes Is a Major Ripple v. SEC Lawsuit Development Expected This Week? Here’s Why
Mandy Williams writes Ripple Releases Institutional DeFi Roadmap for XRP Ledger in 2025
Ripple’s price has found support at the significant 200-day moving average at around $0.41, leading to a robust uptrend. Should it continue its surge, Ripple’s next destination will be the resistance zone at $0.56, but what if the bears take control?
Technical Analysis
By Shayan
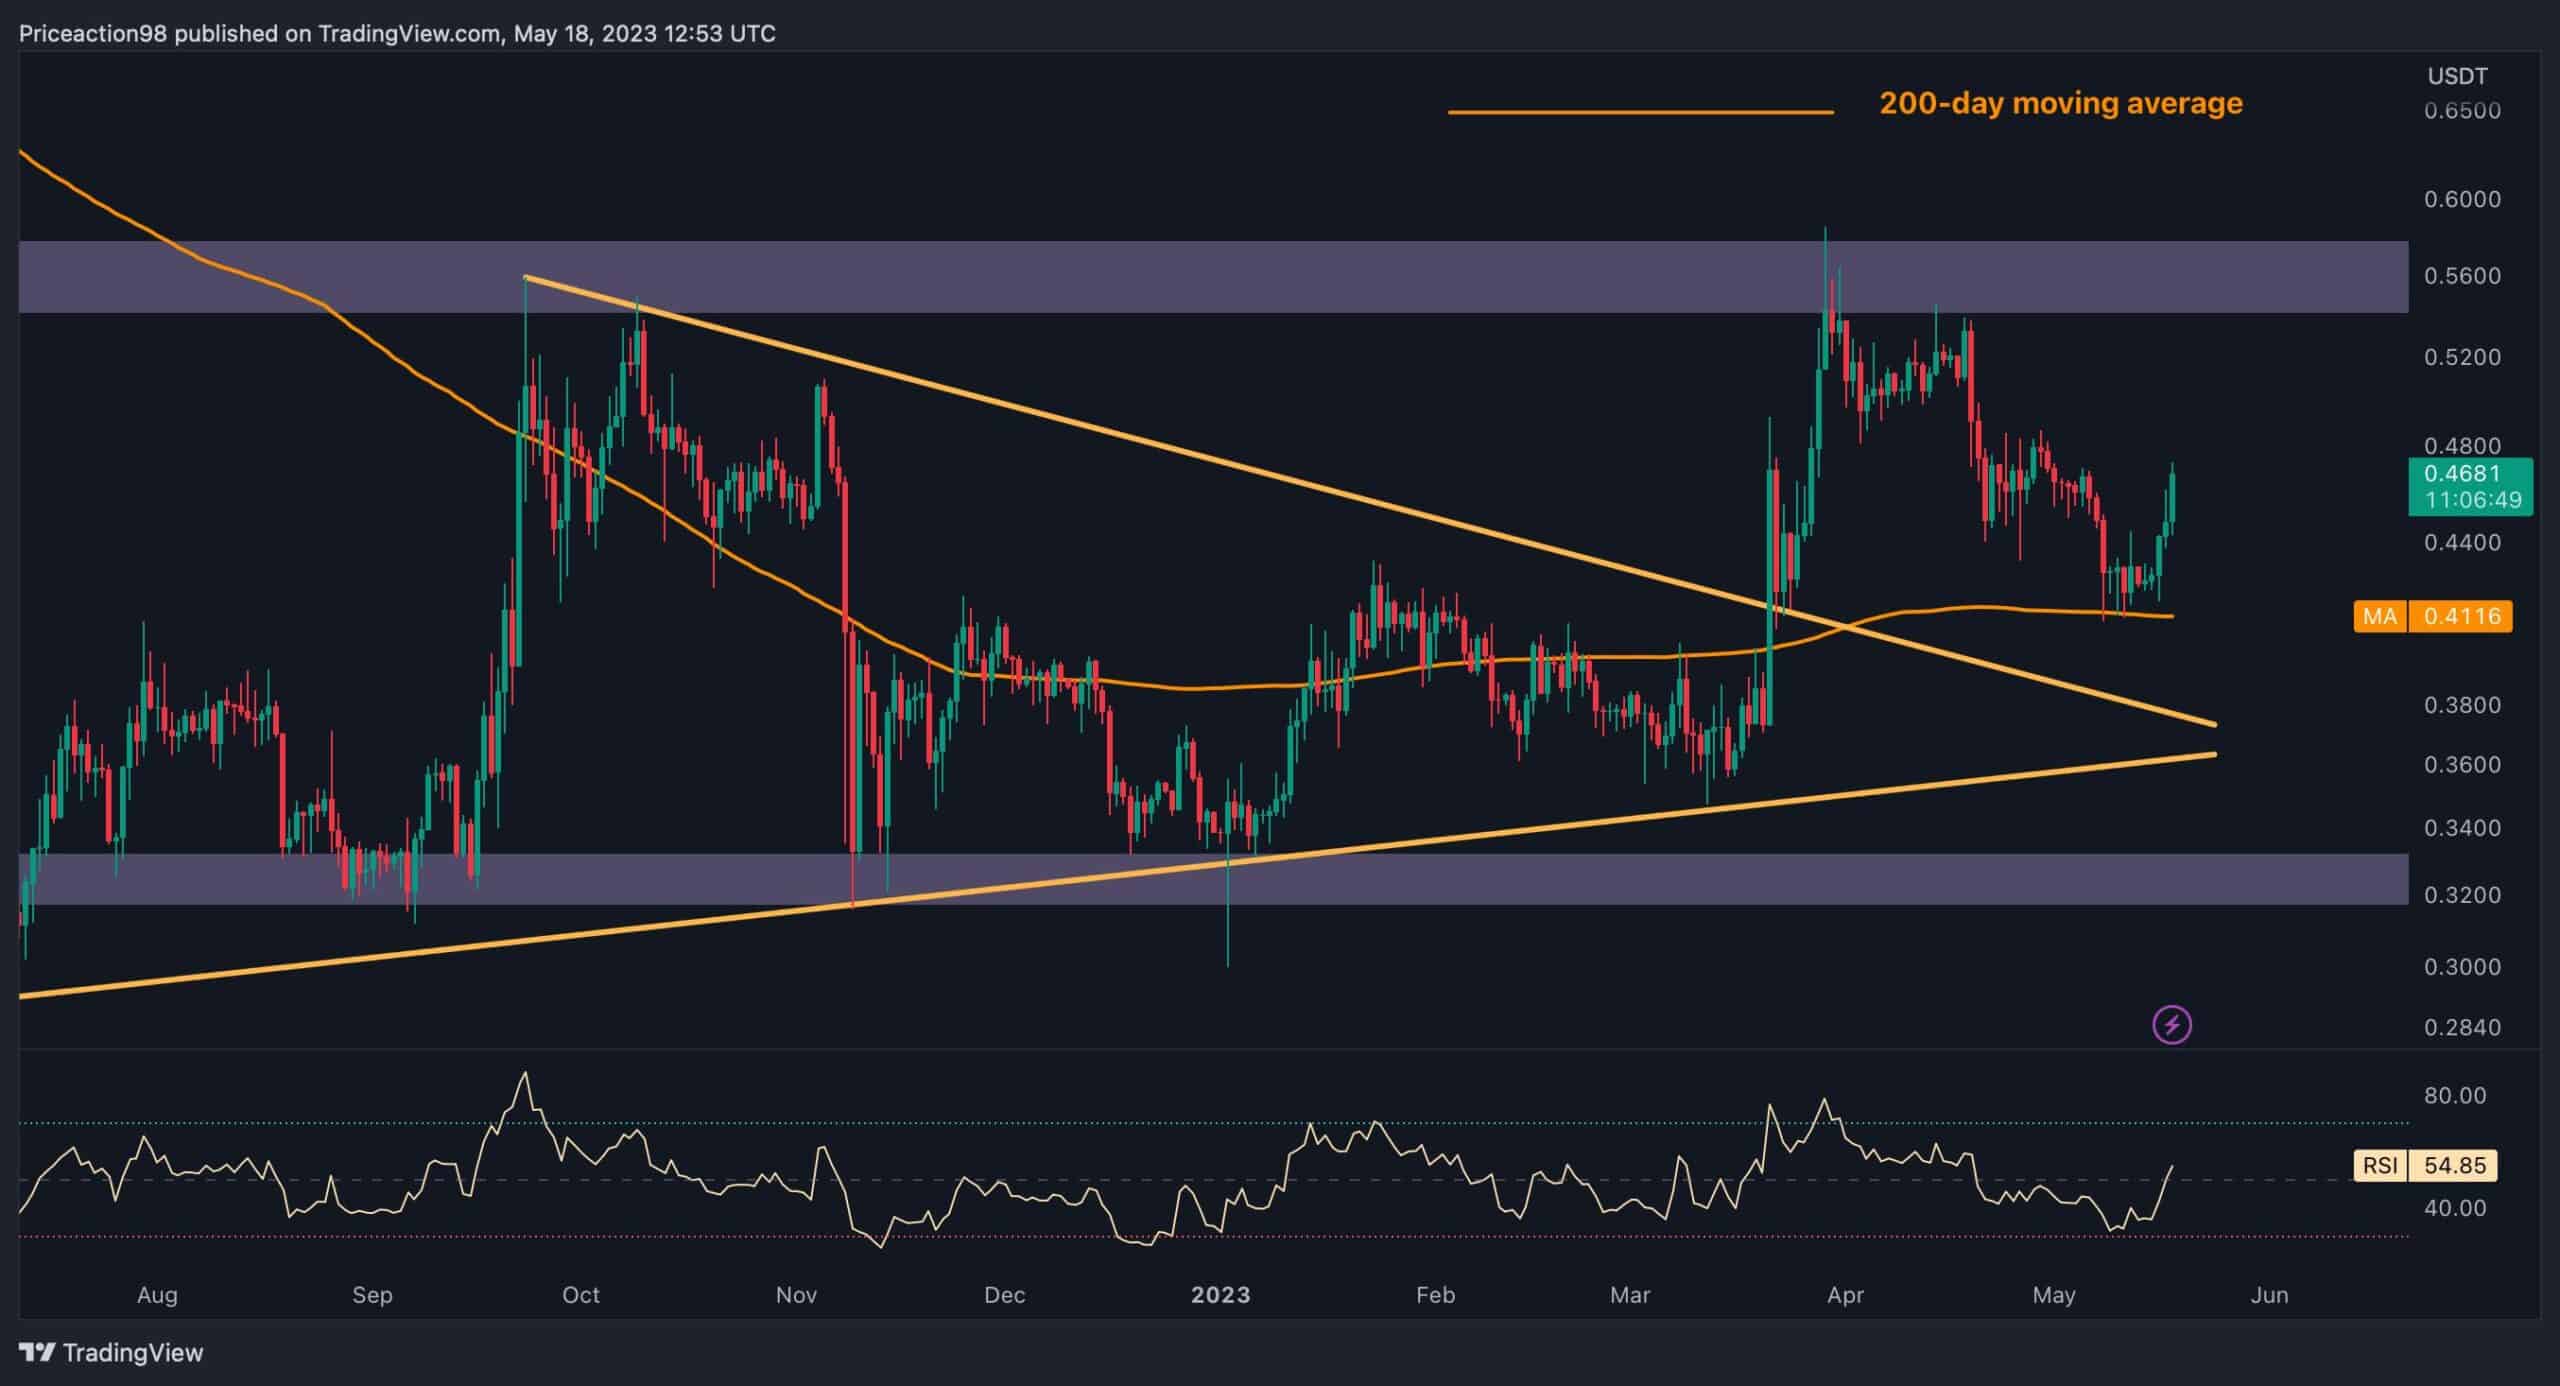
The Daily Chart
Analyzing the daily chart reveals that following several weeks of rejection, the price has finally found support at the 200-day moving average of $0.41, initiating an upward trend. Consequently, the recent rejection phase can be described as a mid-term consolidation correction stage, which is vital for a healthy bullish rally.
This indicates that XRP could attempt to breach the $0.56 barrier. If the price manages to surpass this critical zone, it is likely to enter a long-term bullish rally.
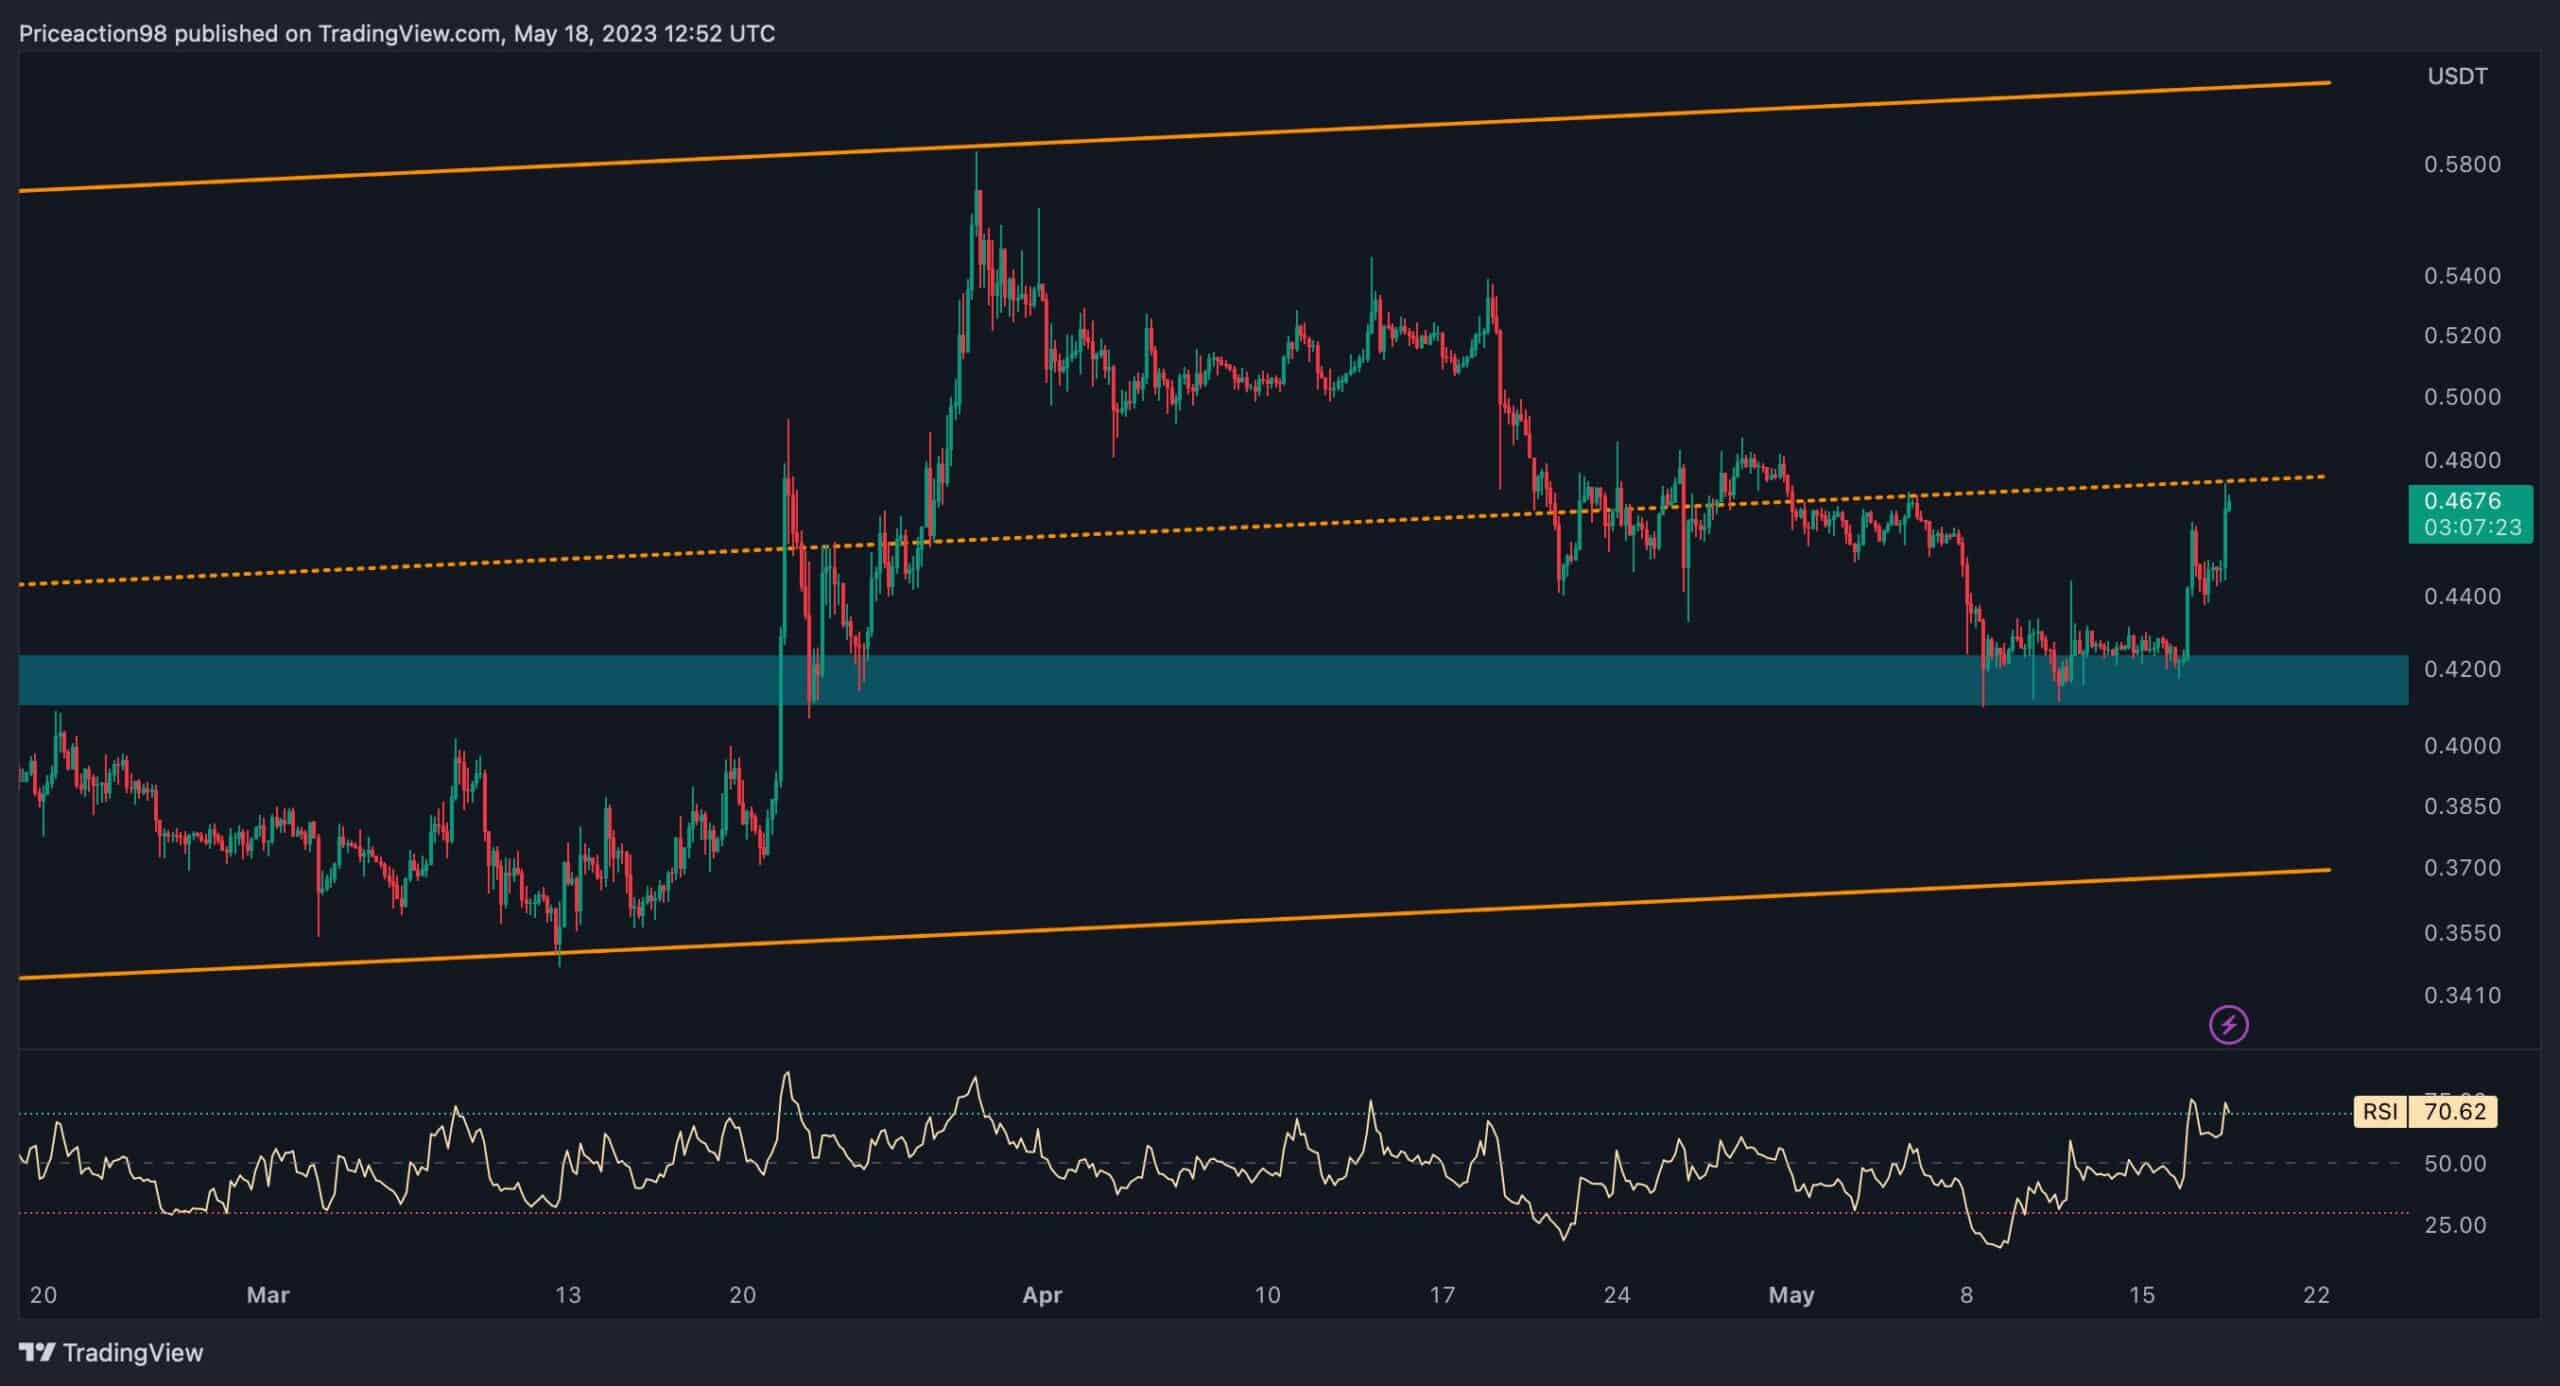
The 4-Hour Chart
Turning to the 4-hour chart, XRP initially dropped to the static resistance region of $0.42, which coincides with the 200-day moving average. However, the price found support and began rallying toward the mid-trend line of the channel.
There is a significant resistance region at $0.4675, which currently serves as the primary barrier on the 4-hour timeframe. Should the price surpass this resistance, its next target will be the channel’s upper boundary, approximately at $0.6.