Ethereum’s price action has been very choppy in recent weeks after facing rejection from a significant resistance. However, there are multiple levels that could provide support and hold the price in the event of a deeper pullback. Technical Analysis By: Edris The Daily Chart On the daily chart, the price was rejected from the 00 level and the higher boundary of the large symmetrical triangle pattern earlier in February. It has since broken below the 50-day moving average, located around the 00 mark. Currently, the price is consolidating below the broken MA and is yet to show an impulsive move after the bearish breakout. If the cryptocurrency fails to reclaim the broken 50-day moving average, the 200-day moving average, trending around the 00 level, could be the
Topics:
CryptoVizArt considers the following as important: ETH Analysis, ETHBTC, Ethereum (ETH) Price, ethusd
This could be interesting, too:
Mandy Williams writes Ethereum Derivatives Metrics Signal Modest Downside Tail Risk Ahead: Nansen
Jordan Lyanchev writes Weekly Bitcoin, Ethereum ETF Recap: Light at the End of the Tunnel for BTC
CryptoVizArt writes Will Weak Momentum Drive ETH to .5K? (Ethereum Price Analysis)
Jordan Lyanchev writes Bybit Hack Fallout: Arthur Hayes, Samson Mow Push for Ethereum Rollback
Ethereum’s price action has been very choppy in recent weeks after facing rejection from a significant resistance. However, there are multiple levels that could provide support and hold the price in the event of a deeper pullback.
Technical Analysis
By: Edris
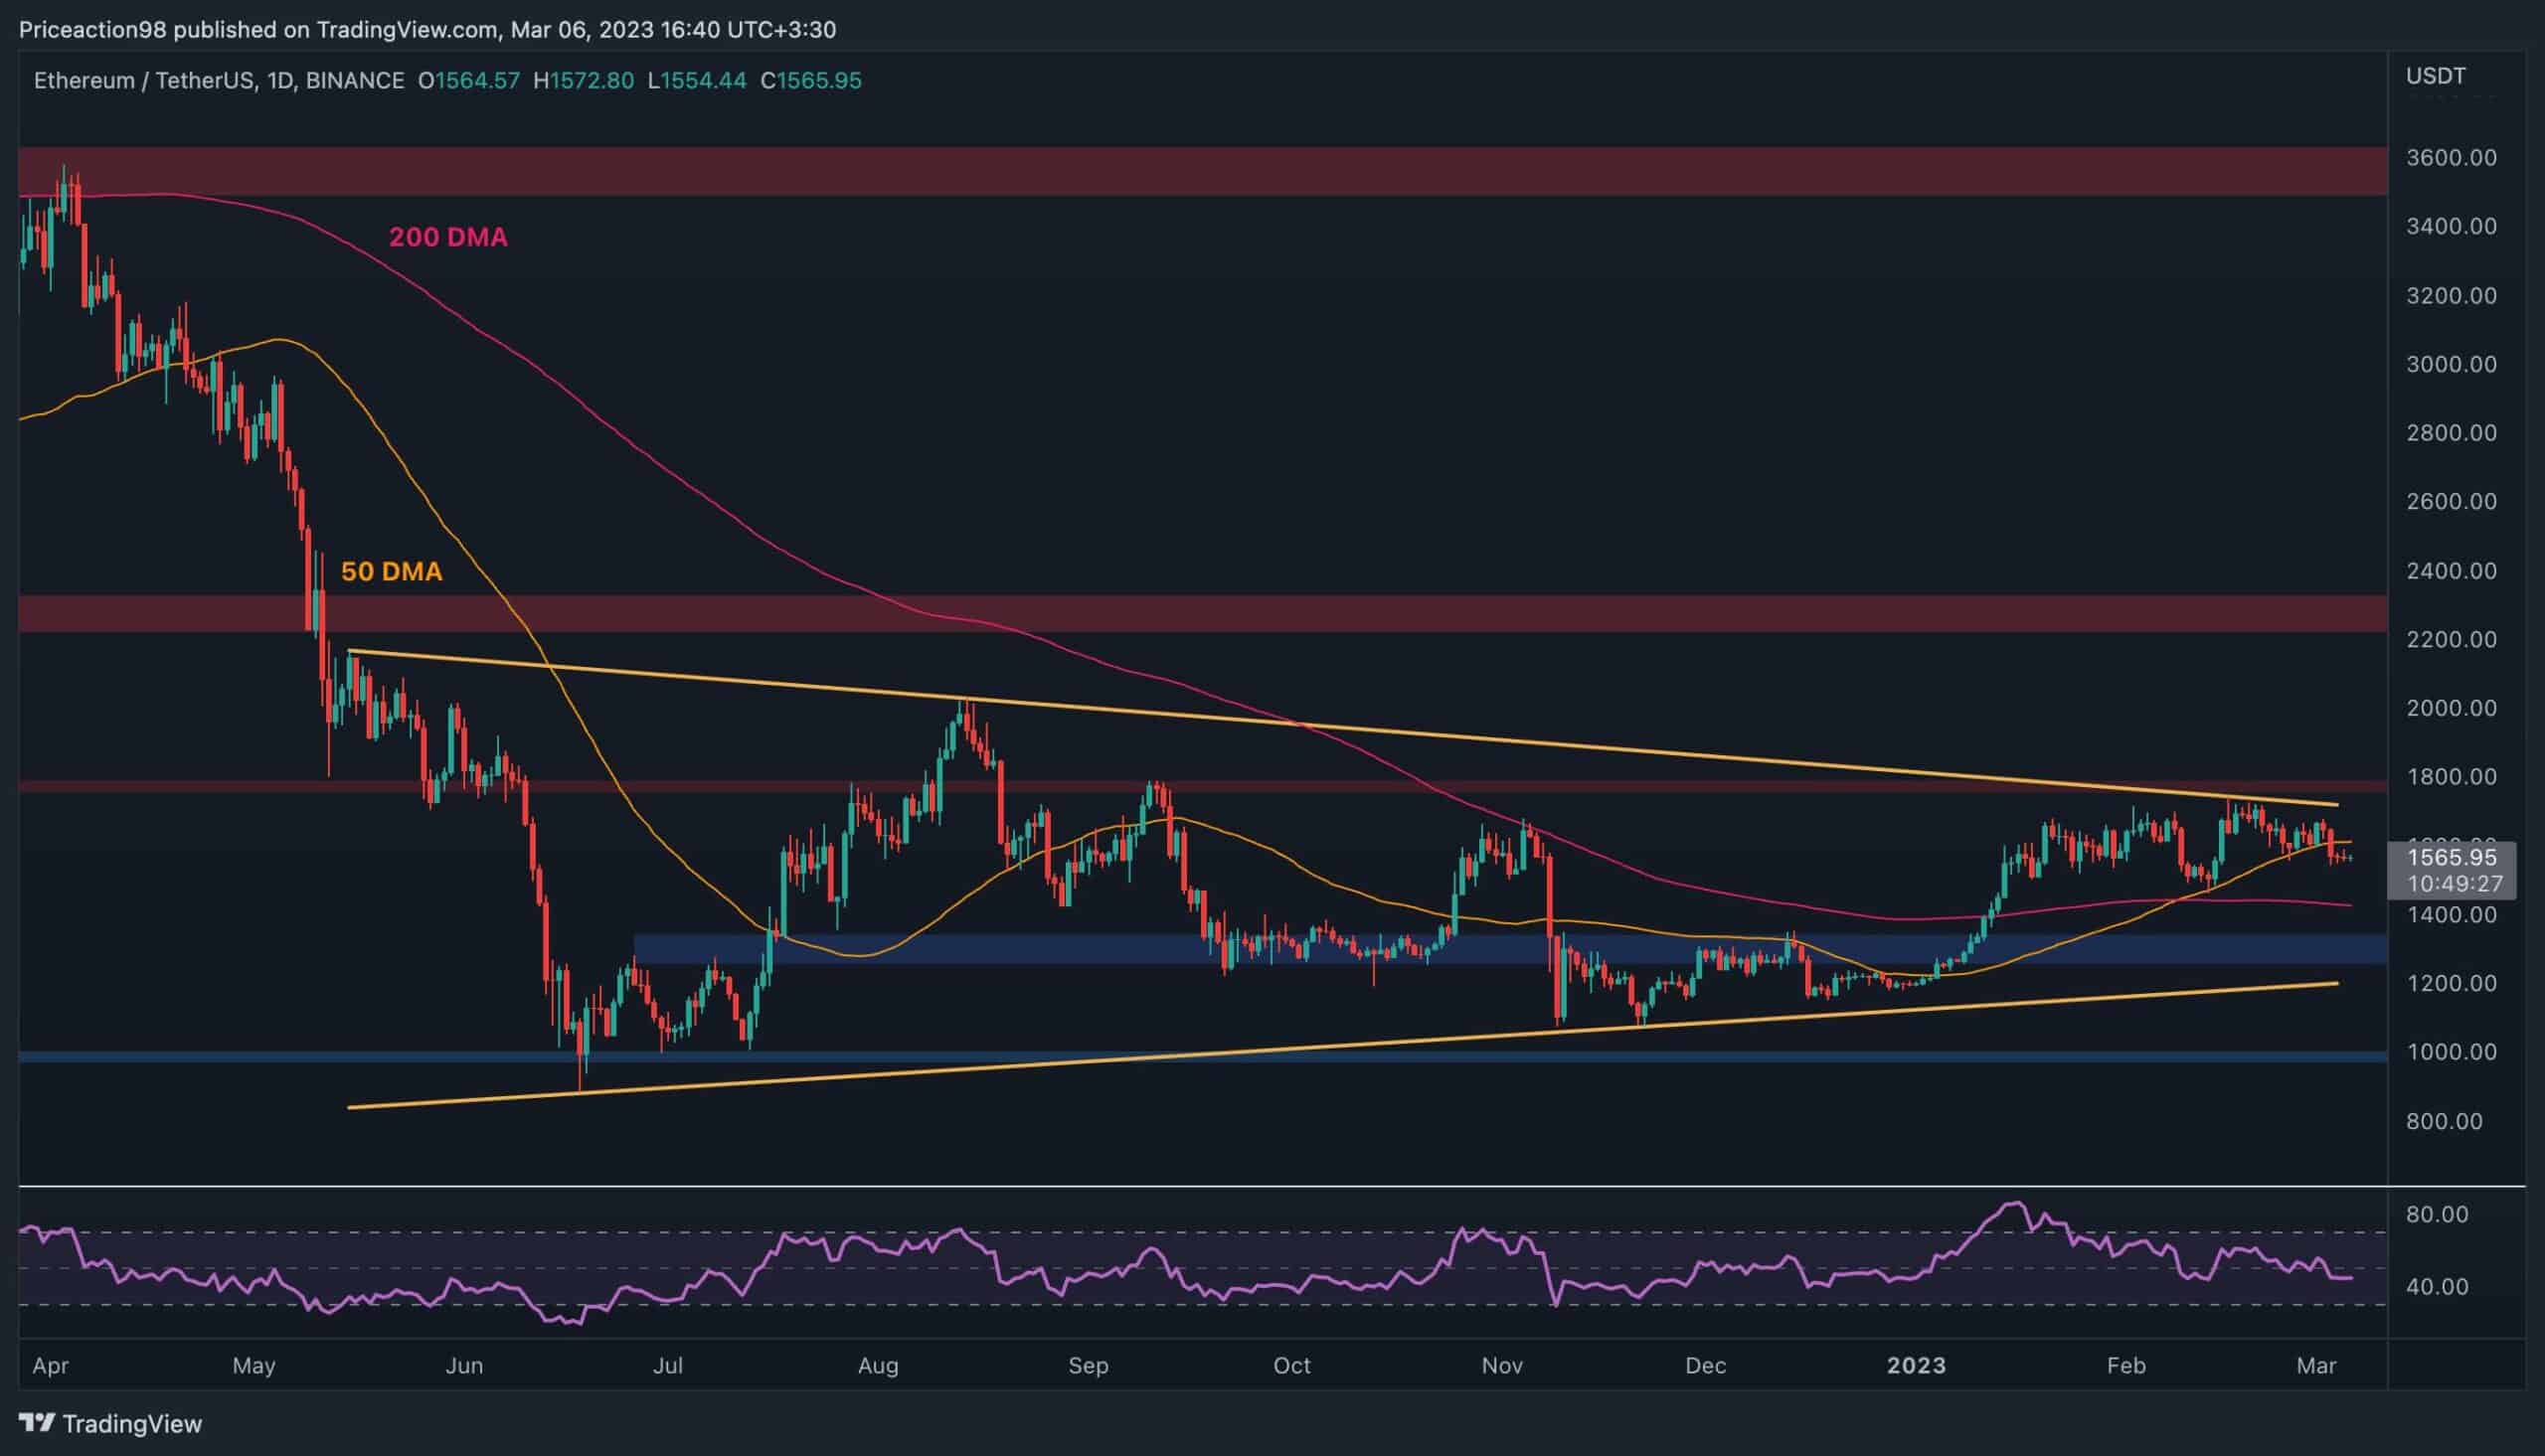
The Daily Chart
On the daily chart, the price was rejected from the $1800 level and the higher boundary of the large symmetrical triangle pattern earlier in February. It has since broken below the 50-day moving average, located around the $1600 mark.
Currently, the price is consolidating below the broken MA and is yet to show an impulsive move after the bearish breakout. If the cryptocurrency fails to reclaim the broken 50-day moving average, the 200-day moving average, trending around the $1400 level, could be the next support, followed closely by the $1300 static zone.
On the other hand, a break back above the 50-day moving average would likely lead to an eventual breakout above the symmetrical triangle and a bullish rally in the short term.
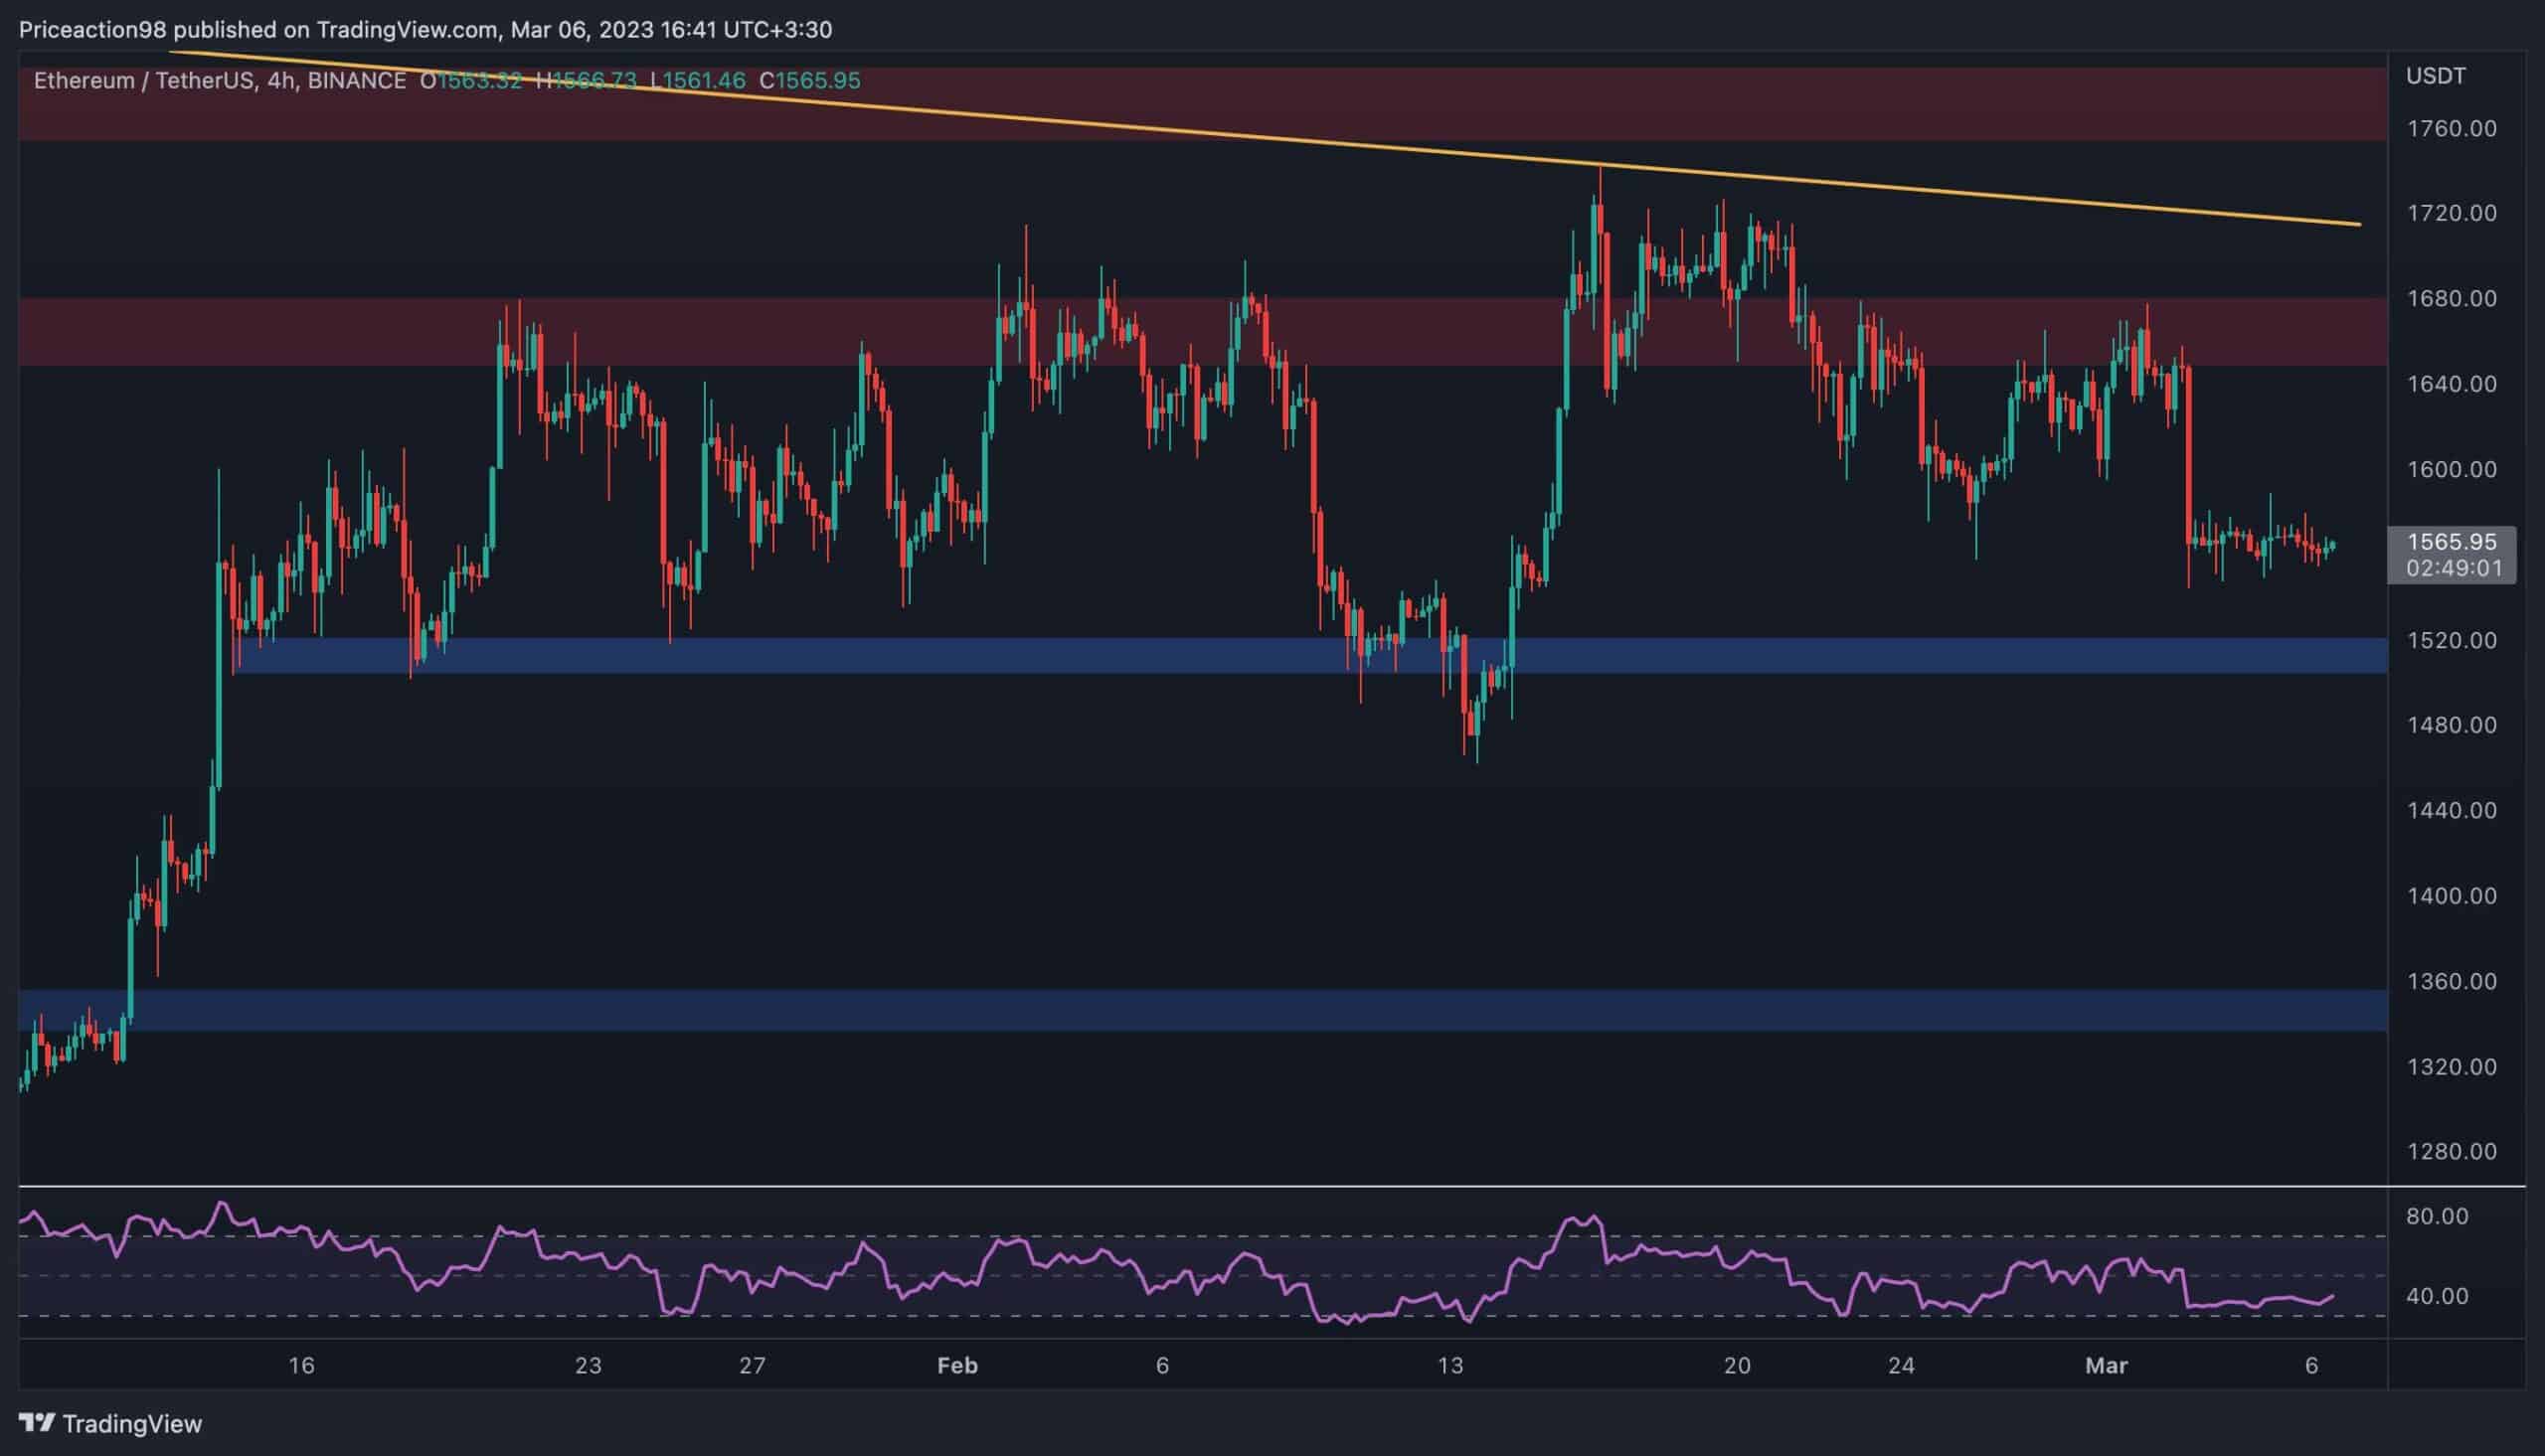
The 4-Hour Chart
Looking at the 4-hour timeframe, it is evident that the price has been oscillating in a very tight range following an impulsive rejection from the $1650 resistance level a few days ago. $1500 seems likely to be tested in the short term, and if it fails to hold the market, the price could plunge toward the next support area, which is located around the $1350 mark.
The RSI indicator is also moving sideways, but it is still showing values below 50%, which points to the bearish momentum and further boosts the probability of a bearish continuation in the coming days.
Sentiment Analysis
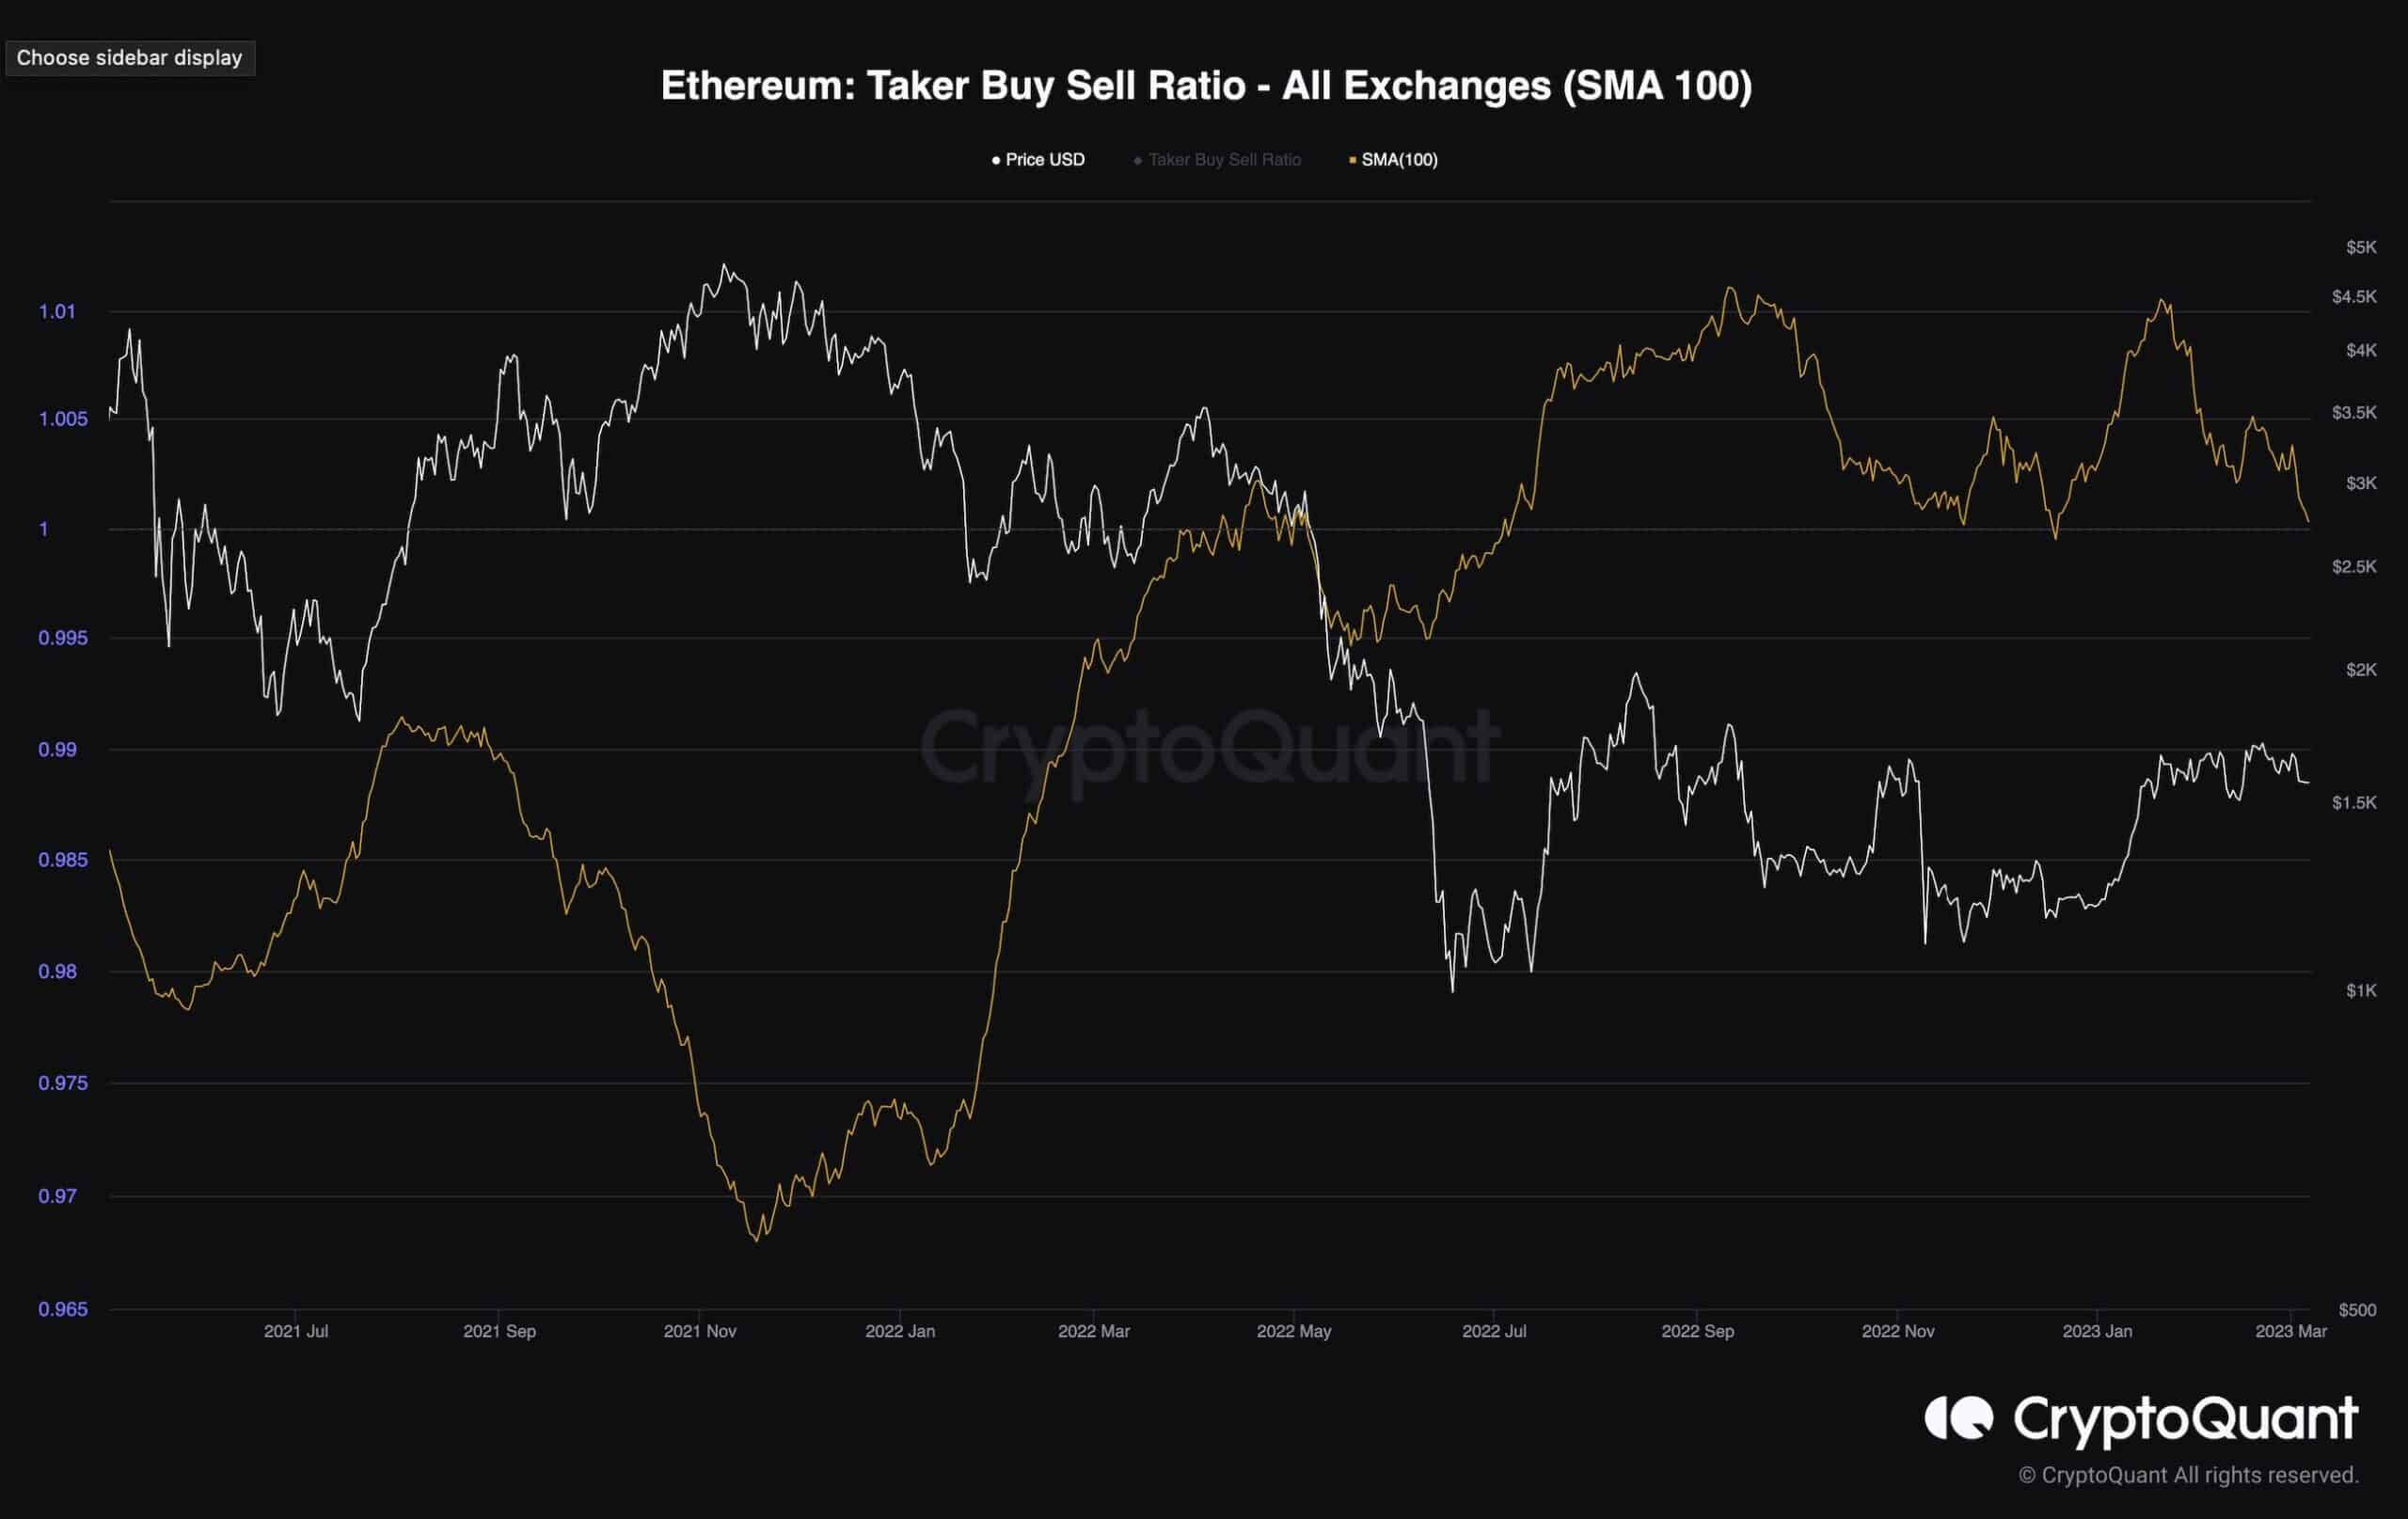
Ethereum Taker Buy Sell Ratio (SMA 100)
As Ethereum’s price has been consolidating below significant resistance levels in the past few weeks, it would be useful to evaluate the futures market sentiment to gather further insights into what the market would do next.
The Taker Buy Sell Ratio is one of the most useful metrics to achieve this, as it measures whether the bulls or the bears are currently executing their trades more aggressively. Values above one indicate dominant buying pressure, while values below 1 are associated with negative sentiment.
This metric has been trending down for the last few weeks, indicating that the buying pressure is fading in the futures market, and the recent consolidating price action also validates this interpretation.
Yet, the metric is currently approaching the 1 threshold, and a drop below would mean that the bears are in control once more, which could lead to a price decline in the coming weeks if this trend continues.