Following an extended period of uncertainty and consolidation, XRP has approached the narrow range of its multi-month triangle. The mid-term outlook of XRP will be determined by a breakout from this triangle, while the current price action suggests a bearish trend. Technical Analysis By Shayan The Daily Chart On the daily timeframe, XRP has been forming a symmetrical triangle pattern and has now reached the narrow range of the triangle. However, the cryptocurrency was recently rejected by the 200-day moving average at around %excerpt%.4, indicating a bearish sentiment in the market. Despite all this, the price has since fallen and is now facing the lower trendline of the triangle, which serves as a strong support level. In case of a breakout, a shakeout towards the %excerpt%.32 support
Topics:
CryptoVizArt considers the following as important: Ripple (XRP) Price, XRP Analysis, xrpbtc, xrpusd
This could be interesting, too:
Jordan Lyanchev writes Ripple’s (XRP) Surge to Triggers Over Million in Short Liquidations
Jordan Lyanchev writes Trump Confirms Work on Strategic Crypto Reserve: XRP, ADA, SOL Included
Dimitar Dzhondzhorov writes Is a Major Ripple v. SEC Lawsuit Development Expected This Week? Here’s Why
Mandy Williams writes Ripple Releases Institutional DeFi Roadmap for XRP Ledger in 2025
Following an extended period of uncertainty and consolidation, XRP has approached the narrow range of its multi-month triangle. The mid-term outlook of XRP will be determined by a breakout from this triangle, while the current price action suggests a bearish trend.
Technical Analysis
By Shayan
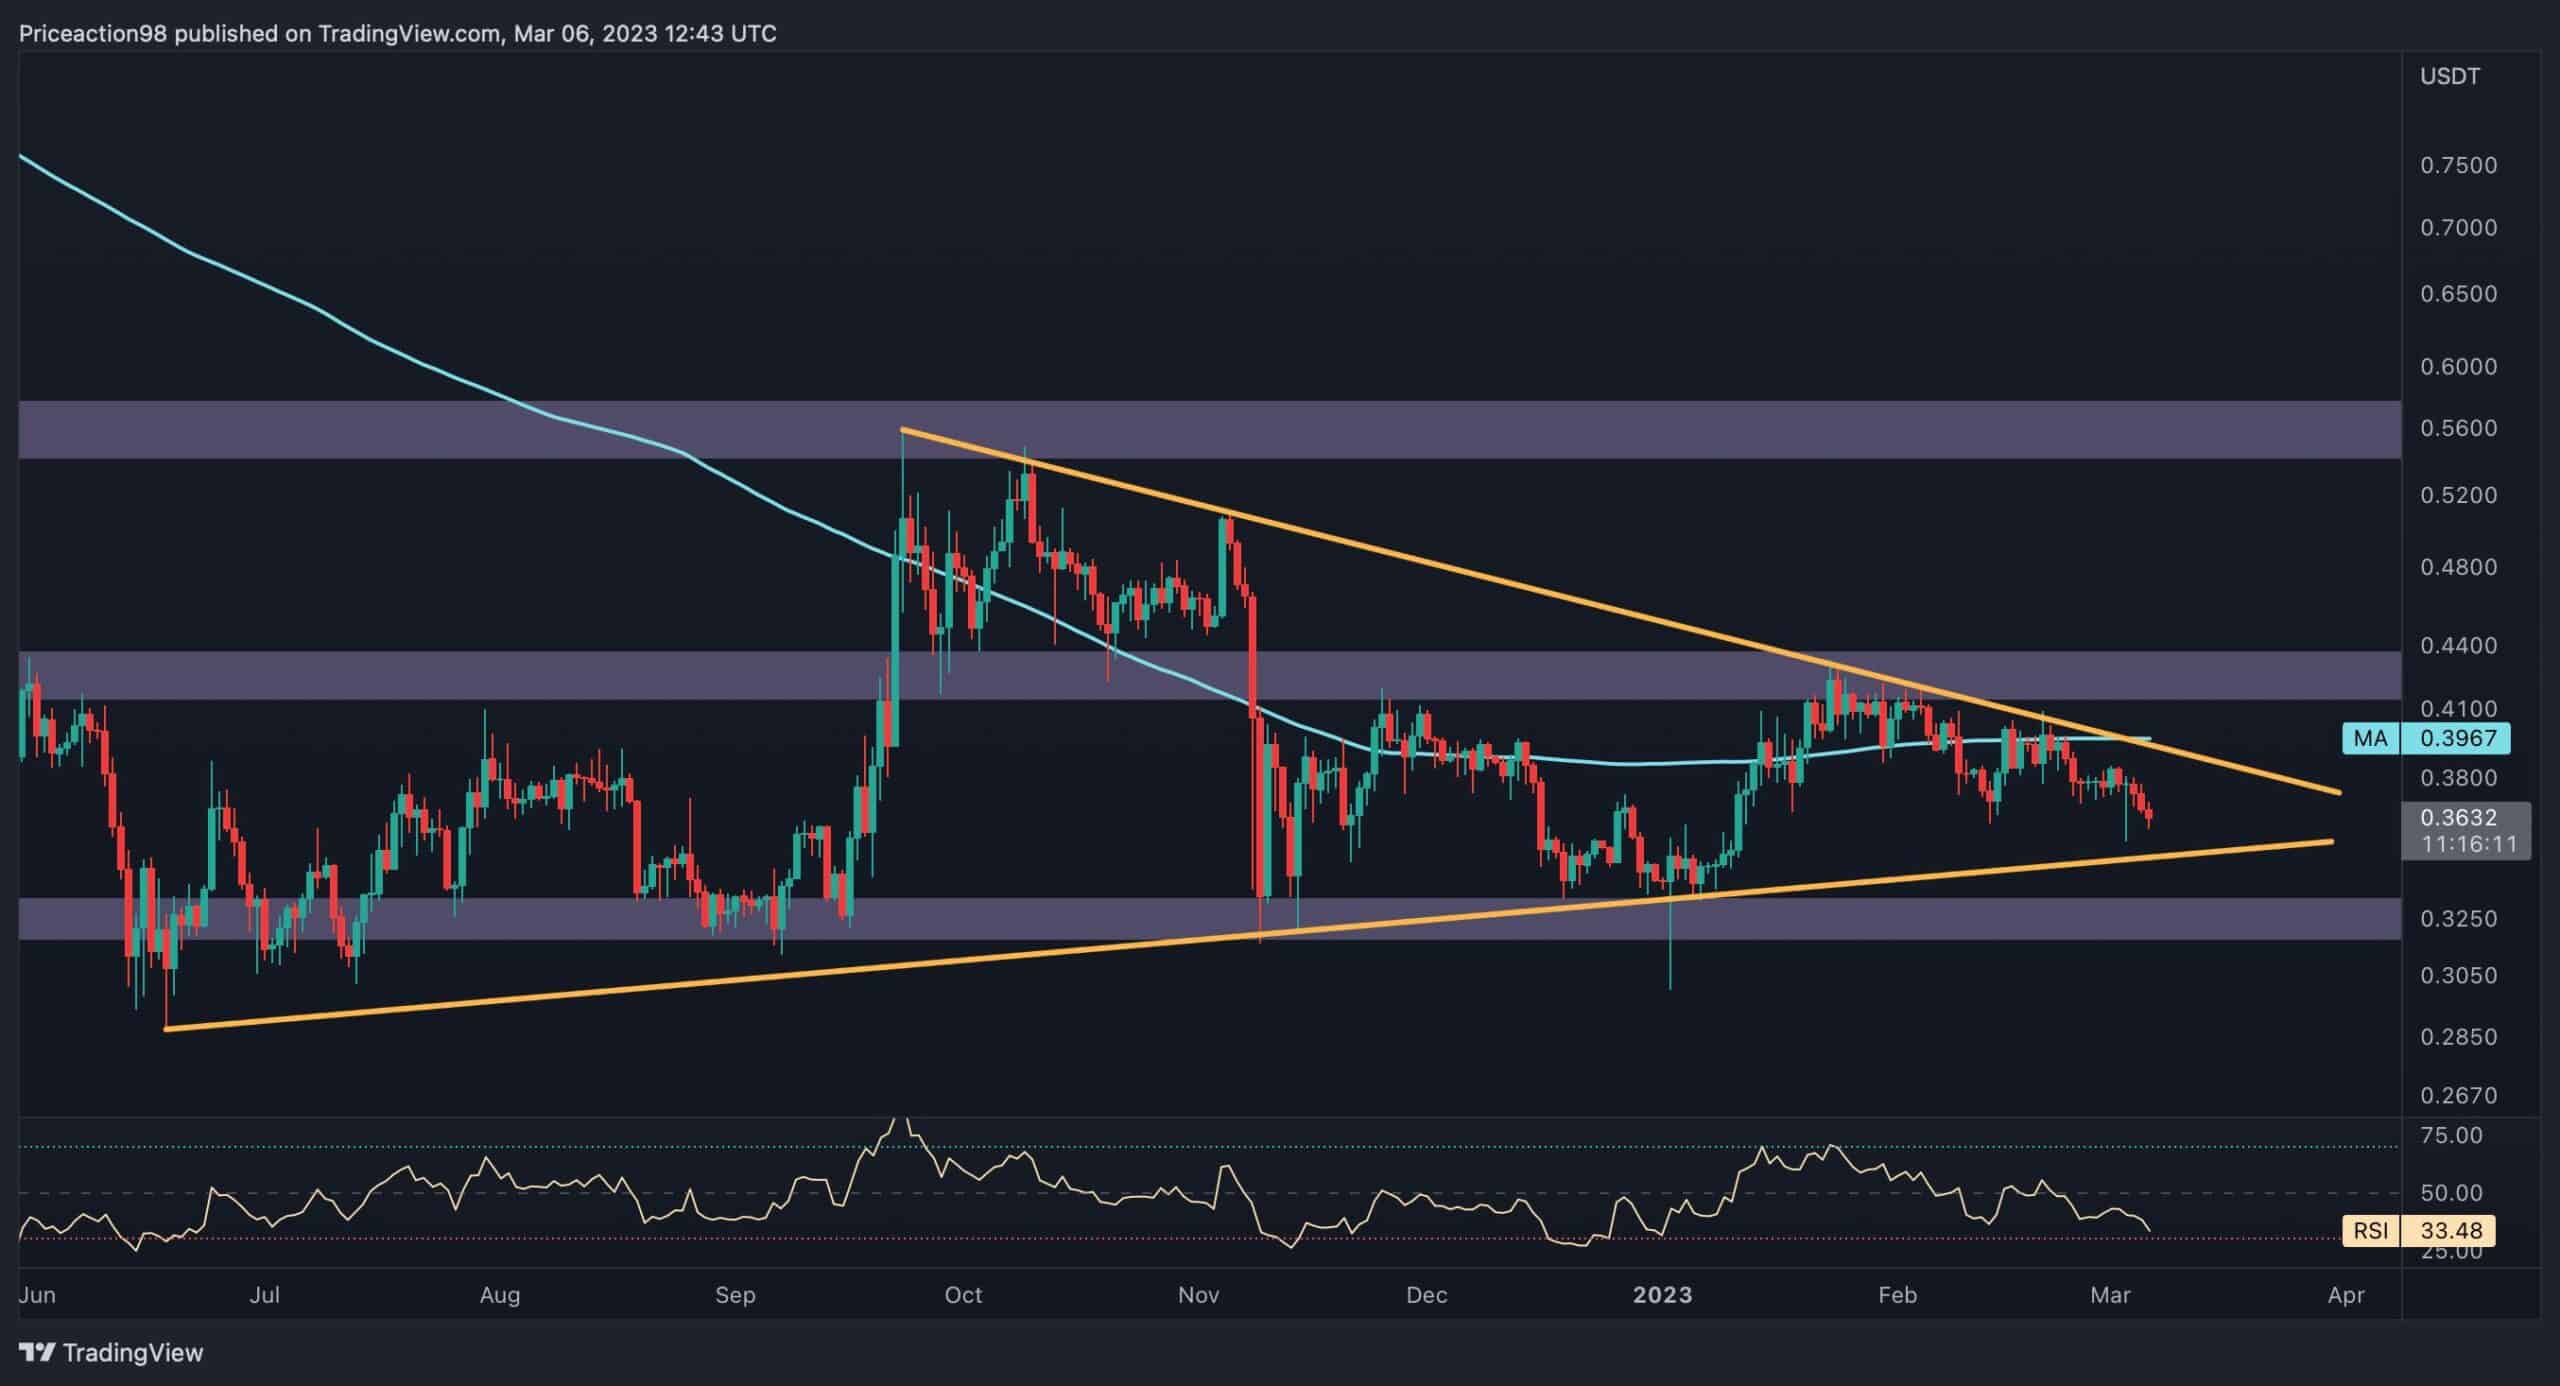
The Daily Chart
On the daily timeframe, XRP has been forming a symmetrical triangle pattern and has now reached the narrow range of the triangle. However, the cryptocurrency was recently rejected by the 200-day moving average at around $0.4, indicating a bearish sentiment in the market.
Despite all this, the price has since fallen and is now facing the lower trendline of the triangle, which serves as a strong support level. In case of a breakout, a shakeout towards the $0.32 support level will be expected.
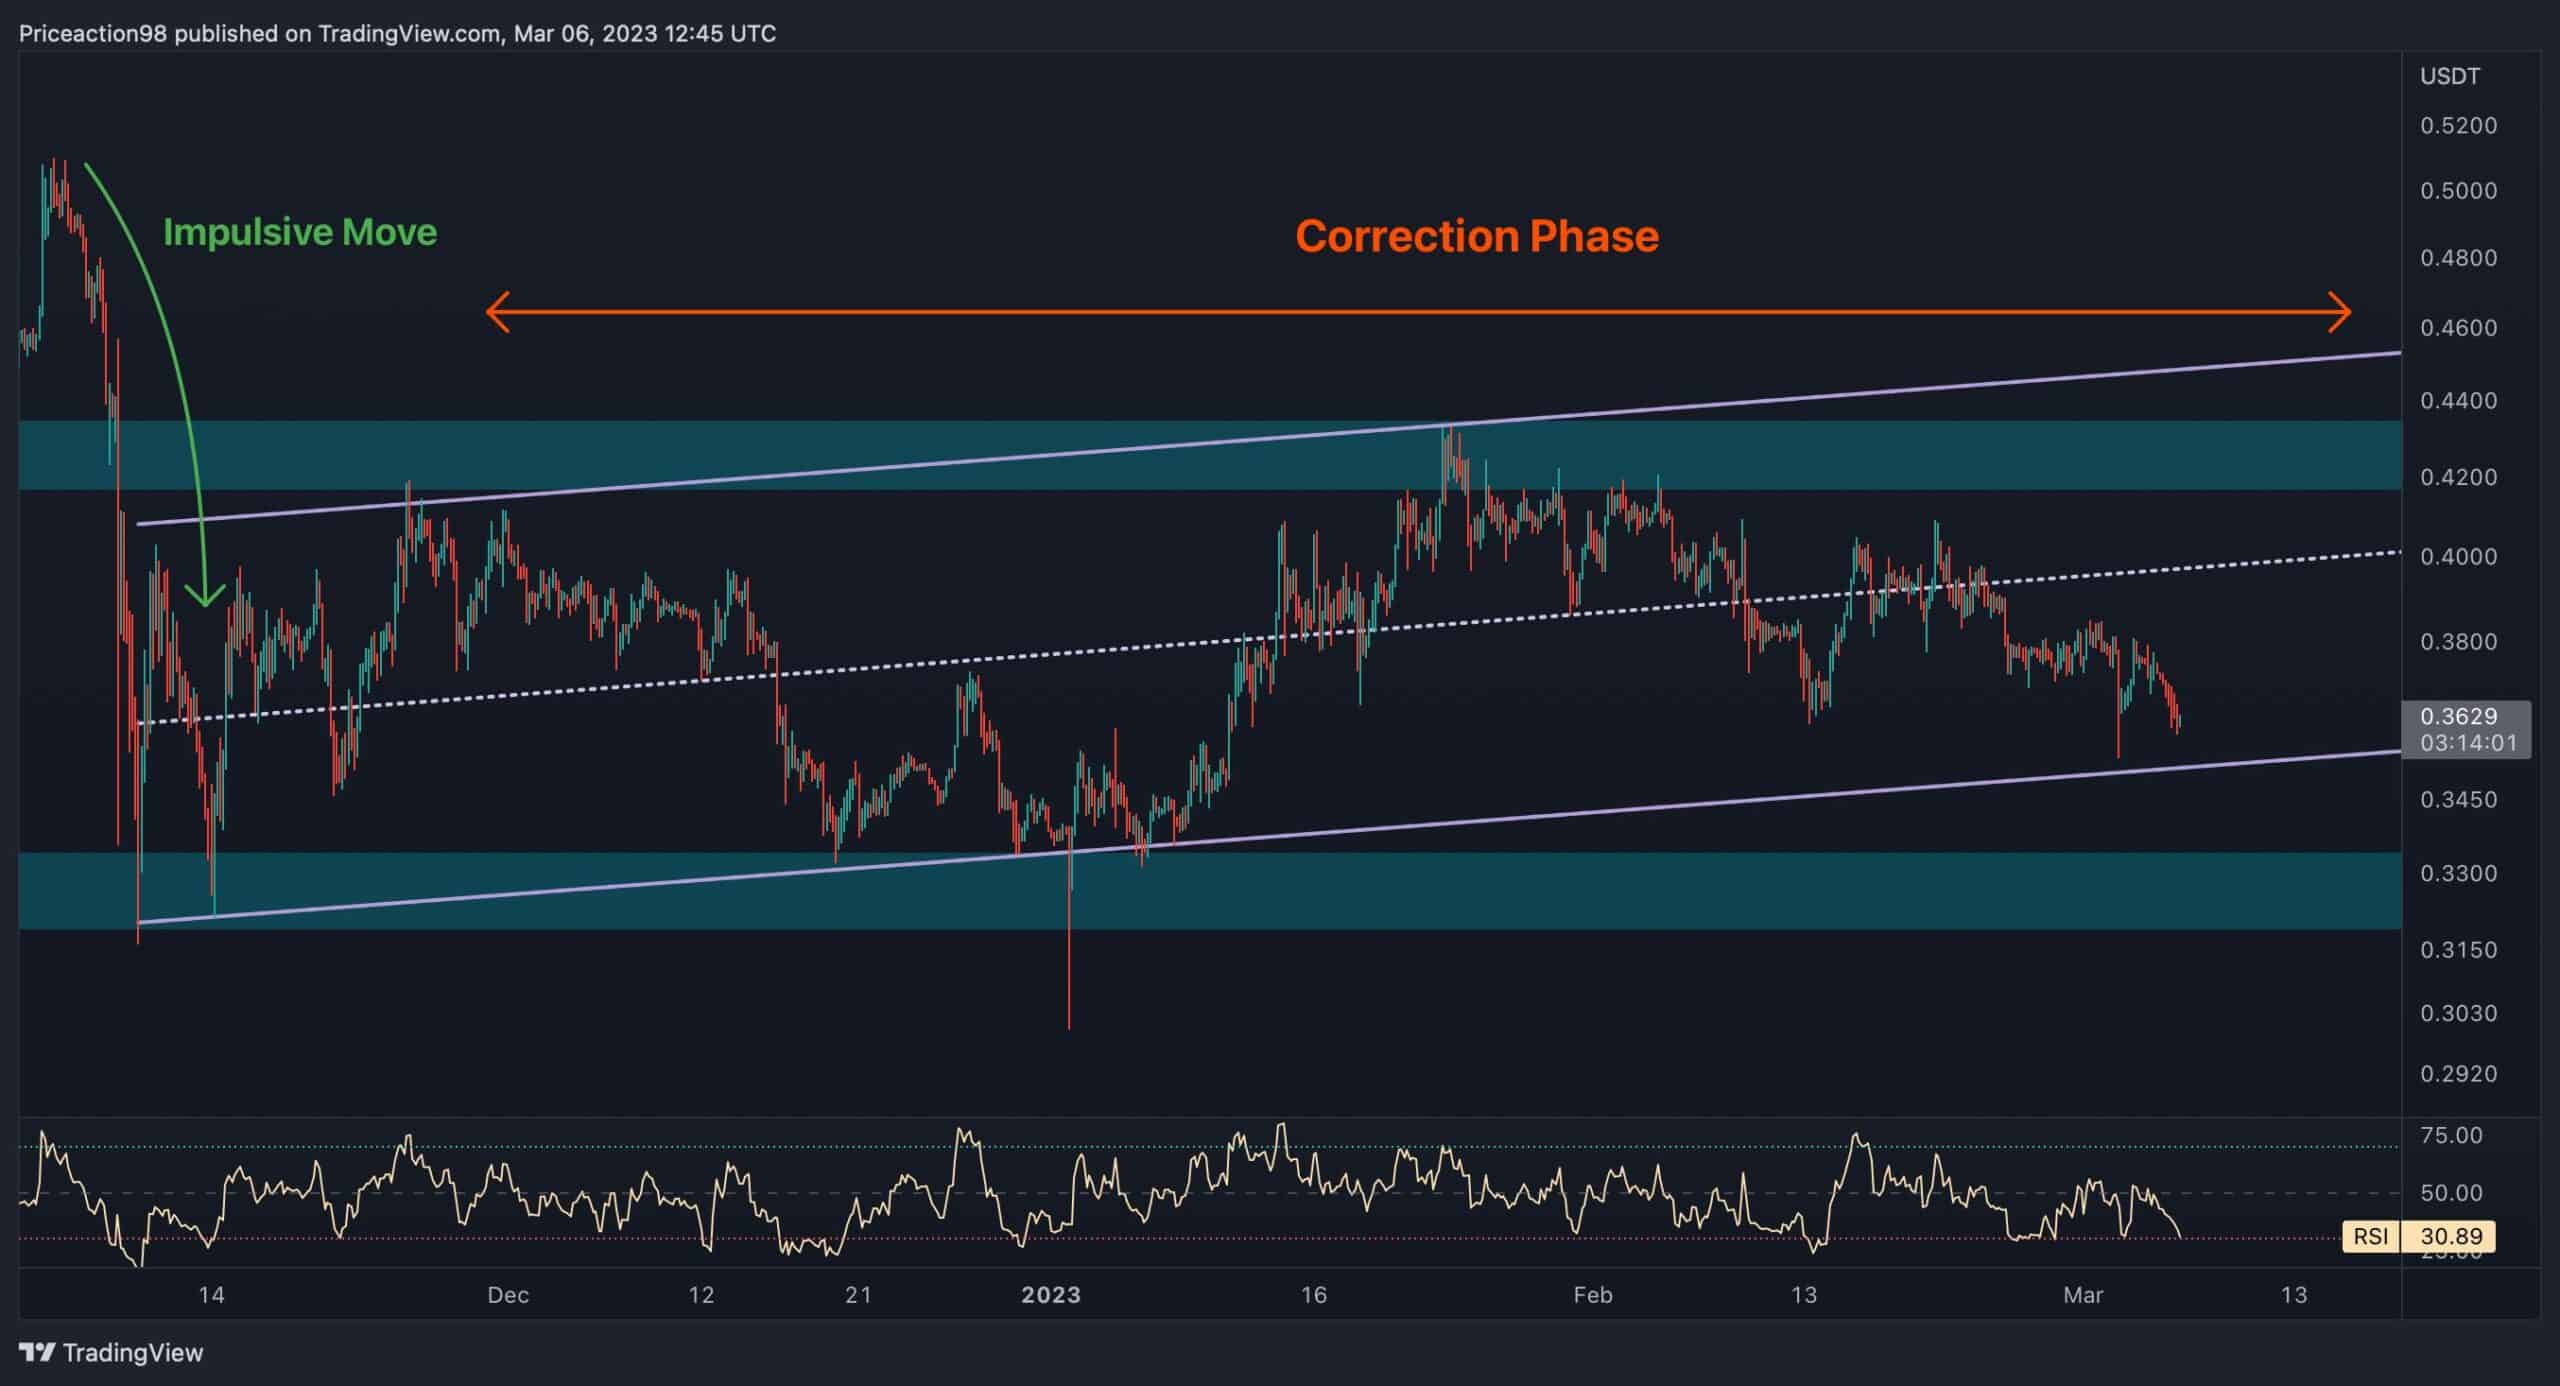
The 4-Hour Chart
Following an impulsive downtrend, XRP is currently in a correction phase and has formed an ascending price channel. The cryptocurrency was recently rejected by the channel’s middle boundary and has experienced a slight decline, reaching the lower threshold.
The lower threshold of the channel has already provided support to the price twice, making it a crucial level to monitor. If the price falls below this level, traders should expect another downtrend toward the next support level of $0.3.
However, there is also a possibility that the trendline will support the price and initiate a short-term uptrend towards the middle boundary of the channel. Nevertheless, it’s important to consider all possible scenarios in order to manage risks effectively since the cryptocurrency market can be unpredictable.