Ethereum price is moving higher above the ,000 resistance against the US Dollar. ETH price is now trading above ,000 and the 55 simple moving average (4 hours). There is a key bullish trend line forming with support near ,980 on the 4-hour chart (data feed from Coinbase). The pair could climb further if it stays above the ,950 support zone. Ethereum price is rising above the ,950 level against the US Dollar. ETH/USD could rise further if it clears the ,150 resistance zone. Ethereum Price Analysis In the past few sessions, Ethereum saw a decent increase above the ,920 level against the US Dollar. ETH price was able to gain pace for a move above the ,950 level and the 55 simple moving average (4 hours). The bulls even pushed the price above the
Topics:
Aayush Jindal considers the following as important: Altcoin News, ETH, News, Trading
This could be interesting, too:
Emily John writes GRVT Launches Alertatron Trading Event and Airdrop Before TGE
Bilal Hassan writes Coinbase Expands in Nigeria with Onboard Global Partnership
Guest User writes XRP Price Faces Potential Drop: Leading KOL Warns of Imminent Correction with TD Sequential Sell Signal!
Bilal Hassan writes Bitget Expands in South Africa with Callpay Integration
- Ethereum price is moving higher above the $2,000 resistance against the US Dollar.
- ETH price is now trading above $2,000 and the 55 simple moving average (4 hours).
- There is a key bullish trend line forming with support near $1,980 on the 4-hour chart (data feed from Coinbase).
- The pair could climb further if it stays above the $1,950 support zone.
Ethereum price is rising above the $1,950 level against the US Dollar. ETH/USD could rise further if it clears the $2,150 resistance zone.
Ethereum Price Analysis
In the past few sessions, Ethereum saw a decent increase above the $1,920 level against the US Dollar. ETH price was able to gain pace for a move above the $1,950 level and the 55 simple moving average (4 hours).
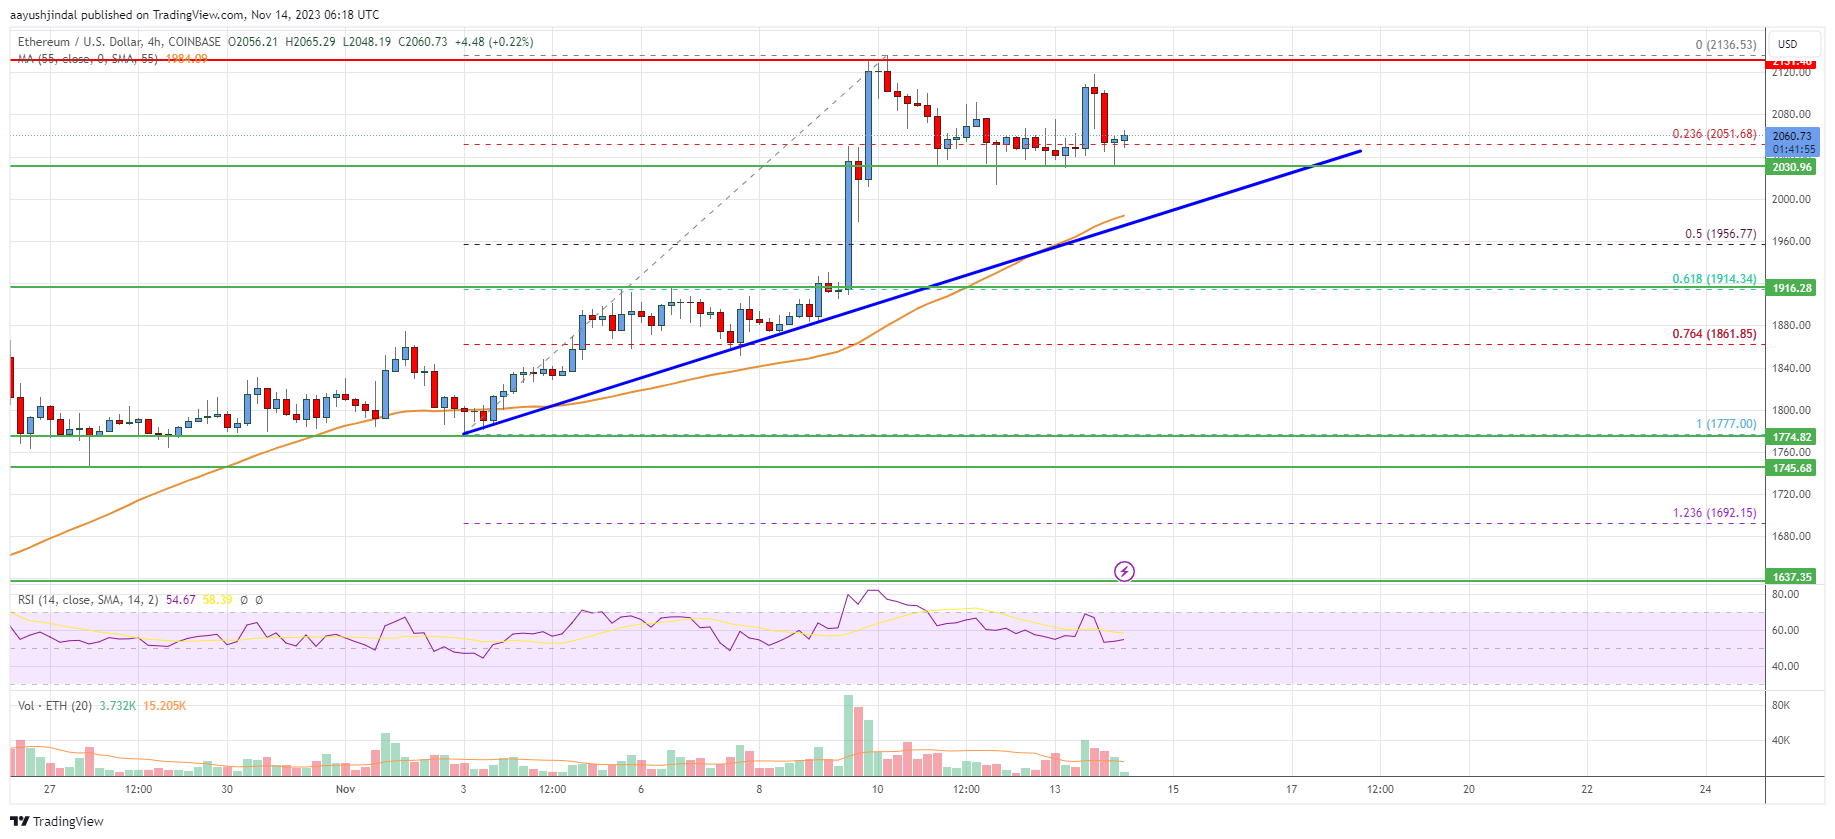
The bulls even pushed the price above the $2,000 resistance zone. A high is formed near $2,136 and the price is now consolidating gains. It is trading above the $2,000 level. It is testing the 23.6% Fib retracement level of the upward wave from the $1,777 swing low to the $2,136 high.
Ether’s price is showing positive signs above $1,950 and the 55 simple moving average (4 hours). There is also a key bullish trend line forming with support near $1,980 on the 4-hour chart.
Immediate resistance on the upside is near the $2,080 level. The next major resistance is near the $2,150 zone. A clear move above the $2,150 level could send the price toward $2,250. Any more gains could even send the price toward the $2,340 resistance zone or $2,420 in the near term.
On the downside, initial support is near the $2,000 level. The next major support is now near the $1,980 level or the trend line, below which the price might test the 50% Fib retracement level of the upward wave from the $1,777 swing low to the $2,136 high at $1,950.
A break below the $1,950 support could push the price to $1,920. Any more losses could lead the price towards $1,780.
Looking at the chart, Ethereum’s price is trading above the $1,980 zone and the 55 simple moving average (4 hours). Overall, Ether’s price could climb further if it stays above the $1,950 support zone.
Technical indicators
4 hours MACD – The MACD for ETH/USD is now gaining momentum in the bullish zone.
4 hours RSI (Relative Strength Index) – The RSI for ETH/USD is now above the 50 level.
Key Support Levels – $1,980, followed by the $1,950 zone.
Key Resistance$ Levels – $2,080 and $2,150.