Ethereum price started a downside correction from the ,400 resistance against the US Dollar. ETH price is now trading below ,300 and the 55 simple moving average (4 hours). There is a key bullish trend line forming with support at ,195 on the 4-hour chart (data feed from Coinbase). The pair could continue to move down if it breaks the ,100 support zone. Ethereum price is declining below ,300 against the US Dollar. ETH/USD remains at a risk of more downsides below the ,275 support zone. Ethereum Price Analysis In the past few weeks, Ethereum started a decent increase above the ,200 resistance zone against the US Dollar. ETH price climbed above the ,250 and ,300 resistance levels. Finally, it tested the ,400 resistance zone. A high was formed
Topics:
Aayush Jindal considers the following as important: Altcoin News, ETH, News, Trading
This could be interesting, too:
Emily John writes GRVT Launches Alertatron Trading Event and Airdrop Before TGE
Bilal Hassan writes Coinbase Expands in Nigeria with Onboard Global Partnership
Guest User writes XRP Price Faces Potential Drop: Leading KOL Warns of Imminent Correction with TD Sequential Sell Signal!
Bilal Hassan writes Bitget Expands in South Africa with Callpay Integration
- Ethereum price started a downside correction from the $2,400 resistance against the US Dollar.
- ETH price is now trading below $2,300 and the 55 simple moving average (4 hours).
- There is a key bullish trend line forming with support at $2,195 on the 4-hour chart (data feed from Coinbase).
- The pair could continue to move down if it breaks the $2,100 support zone.
Ethereum price is declining below $2,300 against the US Dollar. ETH/USD remains at a risk of more downsides below the $2,275 support zone.
Ethereum Price Analysis
In the past few weeks, Ethereum started a decent increase above the $2,200 resistance zone against the US Dollar. ETH price climbed above the $2,250 and $2,300 resistance levels.
Finally, it tested the $2,400 resistance zone. A high was formed near $2,403 before there was a downside correction. There was a move below the $2,300 support zone. The price even traded below the 50% Fib retracement level of the upward move from the $1,986 swing low to the $2,403 high.
ETH is now trading below $2,300 and the 55 simple moving average (4 hours). There is also a key bullish trend line forming with support at $2,195 on the 4-hour chart.
On the upside, the price is now facing resistance near the $2,275 level. The next major resistance is near the $2,300 level. The next major resistance is near the $2,320 zone. A clear move above the $2,300 and $2,320 resistance levels might call for a fresh move to $2,400.
Any more gains could even send the price toward the $2,500 resistance zone or even $2,550 in the near term. On the downside, initial support is near the $2,195 level and the trend line.
The next major support is now near the $2,100 level or the 61.8% Fib retracement level of the upward move from the $1,986 swing low to the $2,403 high. A break below the $2,100 support could push the price to $2,000. If the bulls fail to protect the $2,000 support, the price might decline toward $1,920.
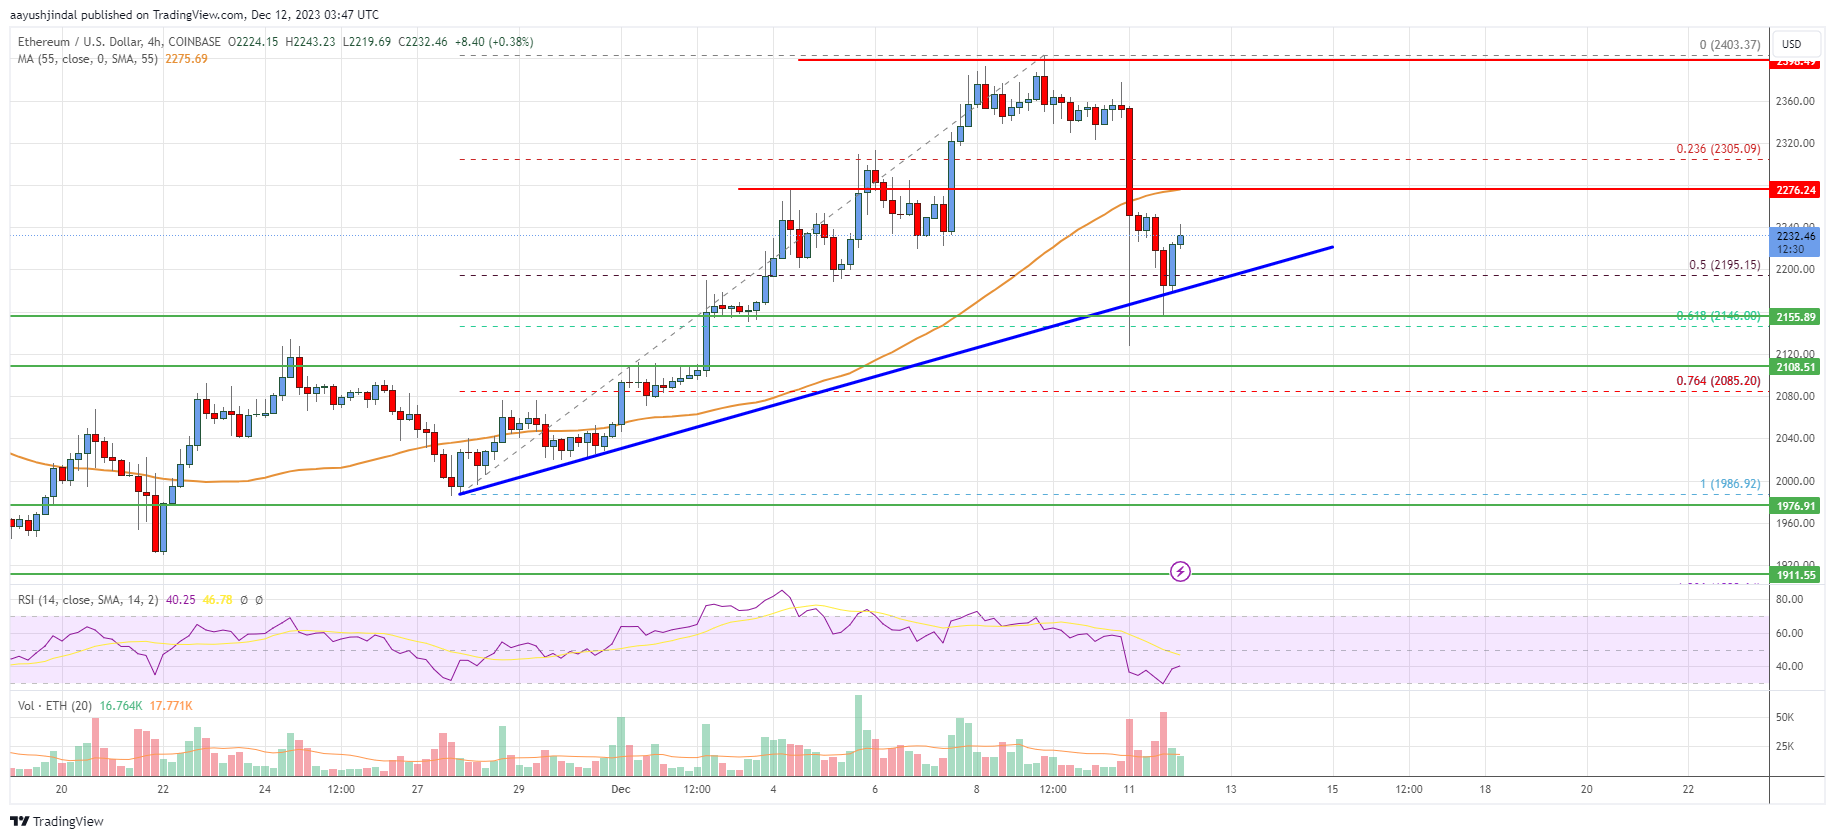
Looking at the chart, Ethereum price is clearly trading below $2,300 and the 55 simple moving average (4 hours). Overall, Ether price could continue to move down if it breaks the $2,100 support zone.
Technical indicators
4 hours MACD – The MACD for ETH/USD is now losing momentum in the bullish zone.
4 hours RSI (Relative Strength Index) – The RSI for ETH/USD is now below the 50 level.
Key Support Levels – $2,195, followed by the $2,100 zone.
Key Resistance Levels – $2,300 and $2,350.