Key Support level: 6 Key Resistance level: 0 Litecoin has been consolidating since May, and the price started to increase slowly from July. However, in the past two days, LTC had a major breakthrough and started to increase. It surged by around 20% in 24 hours. It also set a 6-month high. Litecoin also broke above the 6 resistance and turned it into support. Because of LTC’s lacking performance, the next major resistance can be measured at around 0, which is a long way from the current price and would definitely take sustained momentum from the bulls to get there. Chart by TradingViewTechnical Indicators of LTC Price Trading Volume: Good volume on this move. However, it’s important to be mindful of any exhaustion from the bulls as they’ve been pushing the price
Topics:
Duo Nine considers the following as important: Litecoin (LTC) Price, LTCBTC, ltcusd, Price Analysis
This could be interesting, too:
Chayanika Deka writes Bitcoin Ends Week with 5M Inflows as Multi-Asset Products Face 1M in Losses
Chayanika Deka writes Litecoin Network Activity Surges, Reaching 401,000 Daily Active Addresses
CryptoVizArt writes ETH’s Path to K Involves Maintaining This Critical Support (Ethereum Price Analysis)
Chayanika Deka writes Small Litecoin (LTC) Fishes Are ‘Jumping Ship,’ Here’s What it Means
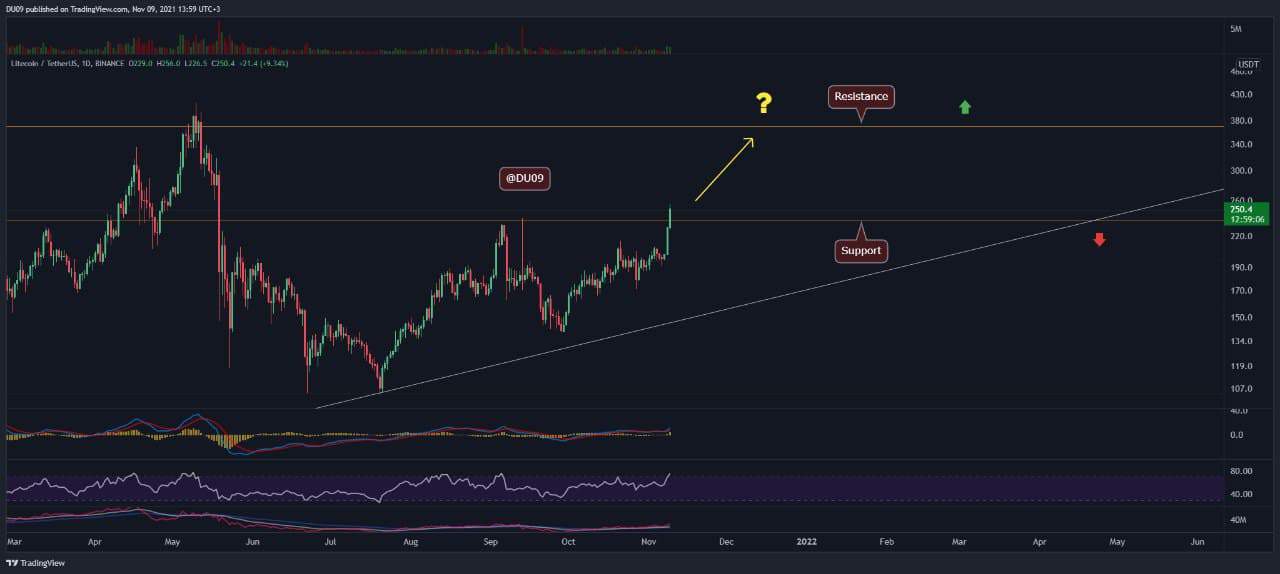
Key Support level: $236
Key Resistance level: $370
Litecoin has been consolidating since May, and the price started to increase slowly from July. However, in the past two days, LTC had a major breakthrough and started to increase. It surged by around 20% in 24 hours. It also set a 6-month high.
Litecoin also broke above the $236 resistance and turned it into support. Because of LTC’s lacking performance, the next major resistance can be measured at around $370, which is a long way from the current price and would definitely take sustained momentum from the bulls to get there.

Technical Indicators of LTC Price
Trading Volume: Good volume on this move. However, it’s important to be mindful of any exhaustion from the bulls as they’ve been pushing the price for some time, and the current volatility may lead to a short correction.
RSI: RSI has crossed above the 70 points on the daily timeframe, indicating strong bullish momentum. On the weekly timeframe, LTC seems to have plenty of room to move higher and set a new all-time high.
MACD: The MACD on the daily timeframe and above is very bullish. The price looks likely to continue trending higher before a potential pullback once major resistance levels are met. The weekly MACD can remain bullish despite any corrections showing that LTC has a long way up before it tops.
Bias
The bias is bullish. This is supported by the price action, volatility, and indicators. Remember, volatility can go in both ways during a bullish market, so be on guard.
Short-Term Prediction for LTC Price
It’s very interesting to see if the bulls will be able to sustain the momentum all the way up to $370 and, potentially, how the price will behave if it gets there. Until then, it seems reasonable to expect to see the price above the support at $236, which should hold – in case of a correction.