Bitcoin’s price has been consolidating above K over the last few months. Yet, the price has broken below the level today, and investors are in a state of panic, wondering if the bull market is over. Technical Analysis By TradingRage The Daily Chart On the daily chart, the price has created a large descending channel pattern since March. Yet, it has broken it to the downside, and the cryptocurrency is aggressively dropping toward the K support level. The 200-day moving average is also trending around the K mark and could be Bitcoin’s last resort in case of a deeper decline. Either way, if the market drops below these levels, the downward pressure would intensify. Source: TradingViewThe 4-Hour Chart Looking at the 4-hour timeframe, the price was rejected from the
Topics:
CryptoVizArt considers the following as important: Bitcoin (BTC) Price, BTC Analysis, BTCEUR, BTCGBP, btcusd, btcusdt
This could be interesting, too:
Chayanika Deka writes XRP, SOL, and ADA Inclusion in US Crypto Reserve Pushes Traders on Edge
Chayanika Deka writes Why Arthur Hayes Is Bullish on Bitcoin Under Trump’s Economic Strategy
Mandy Williams writes Why the Bitcoin Market Is Stuck—and the Key Metric That Could Change It: CryptoQuant CEO
Wayne Jones writes Metaplanet Acquires 156 BTC, Bringing Total Holdings to 2,391
Bitcoin’s price has been consolidating above $60K over the last few months. Yet, the price has broken below the level today, and investors are in a state of panic, wondering if the bull market is over.
Technical Analysis
By TradingRage
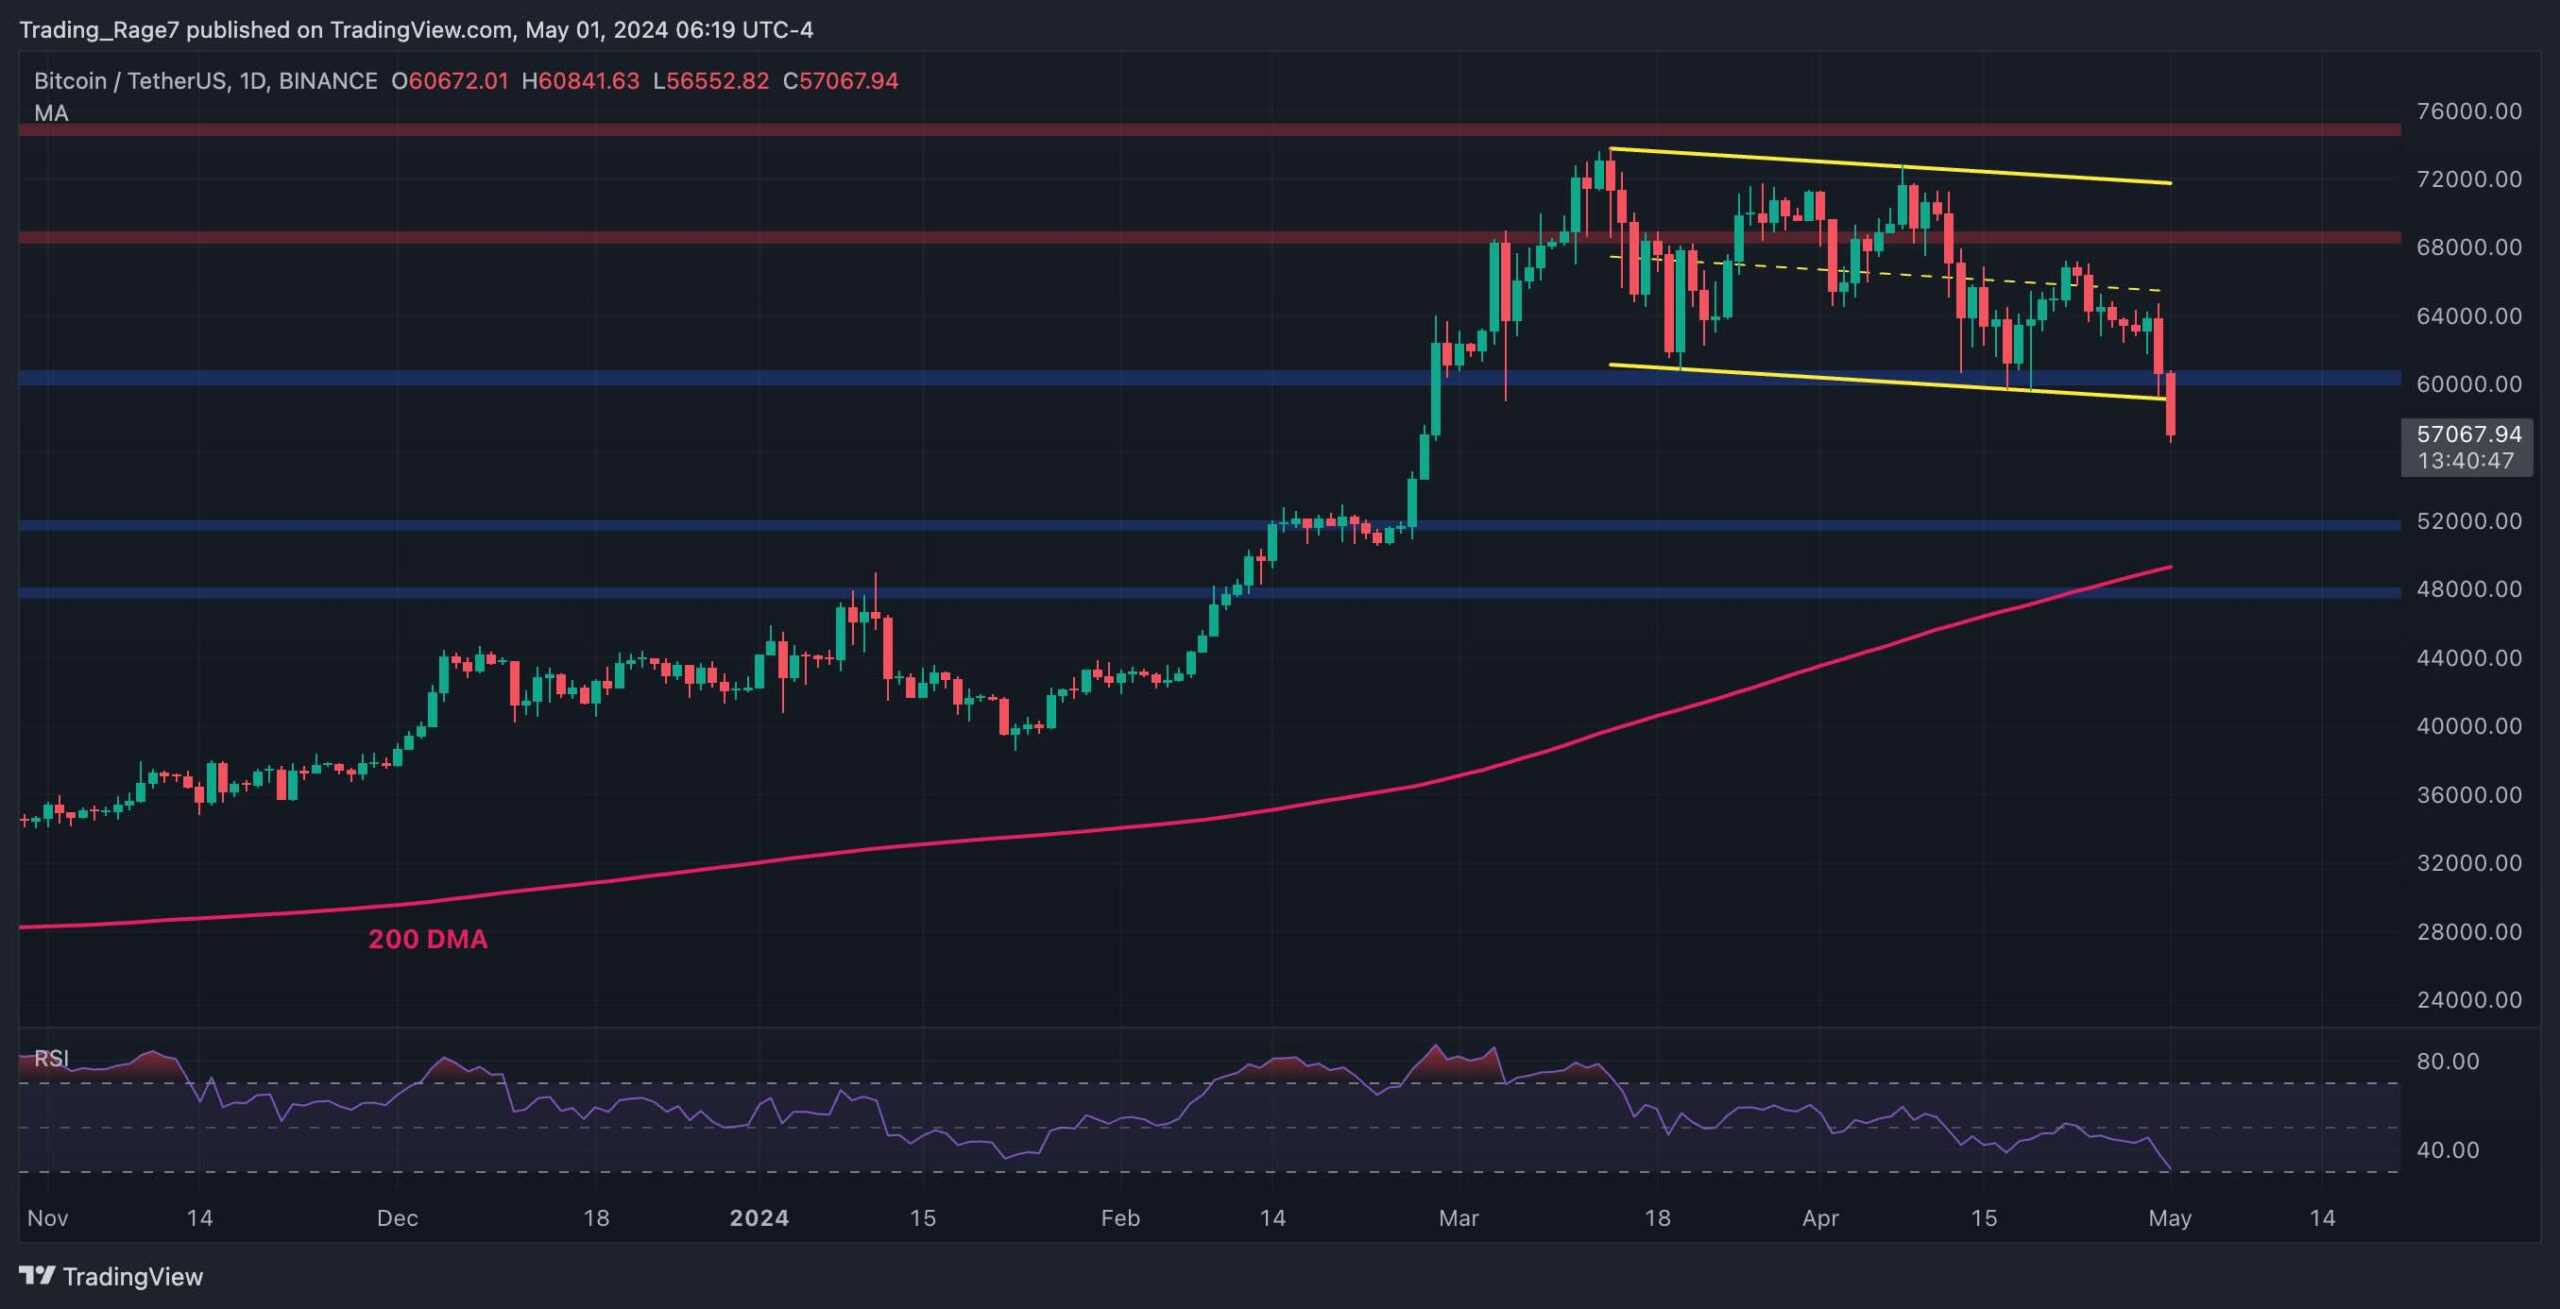
The Daily Chart
On the daily chart, the price has created a large descending channel pattern since March. Yet, it has broken it to the downside, and the cryptocurrency is aggressively dropping toward the $52K support level.
The 200-day moving average is also trending around the $50K mark and could be Bitcoin’s last resort in case of a deeper decline. Either way, if the market drops below these levels, the downward pressure would intensify.
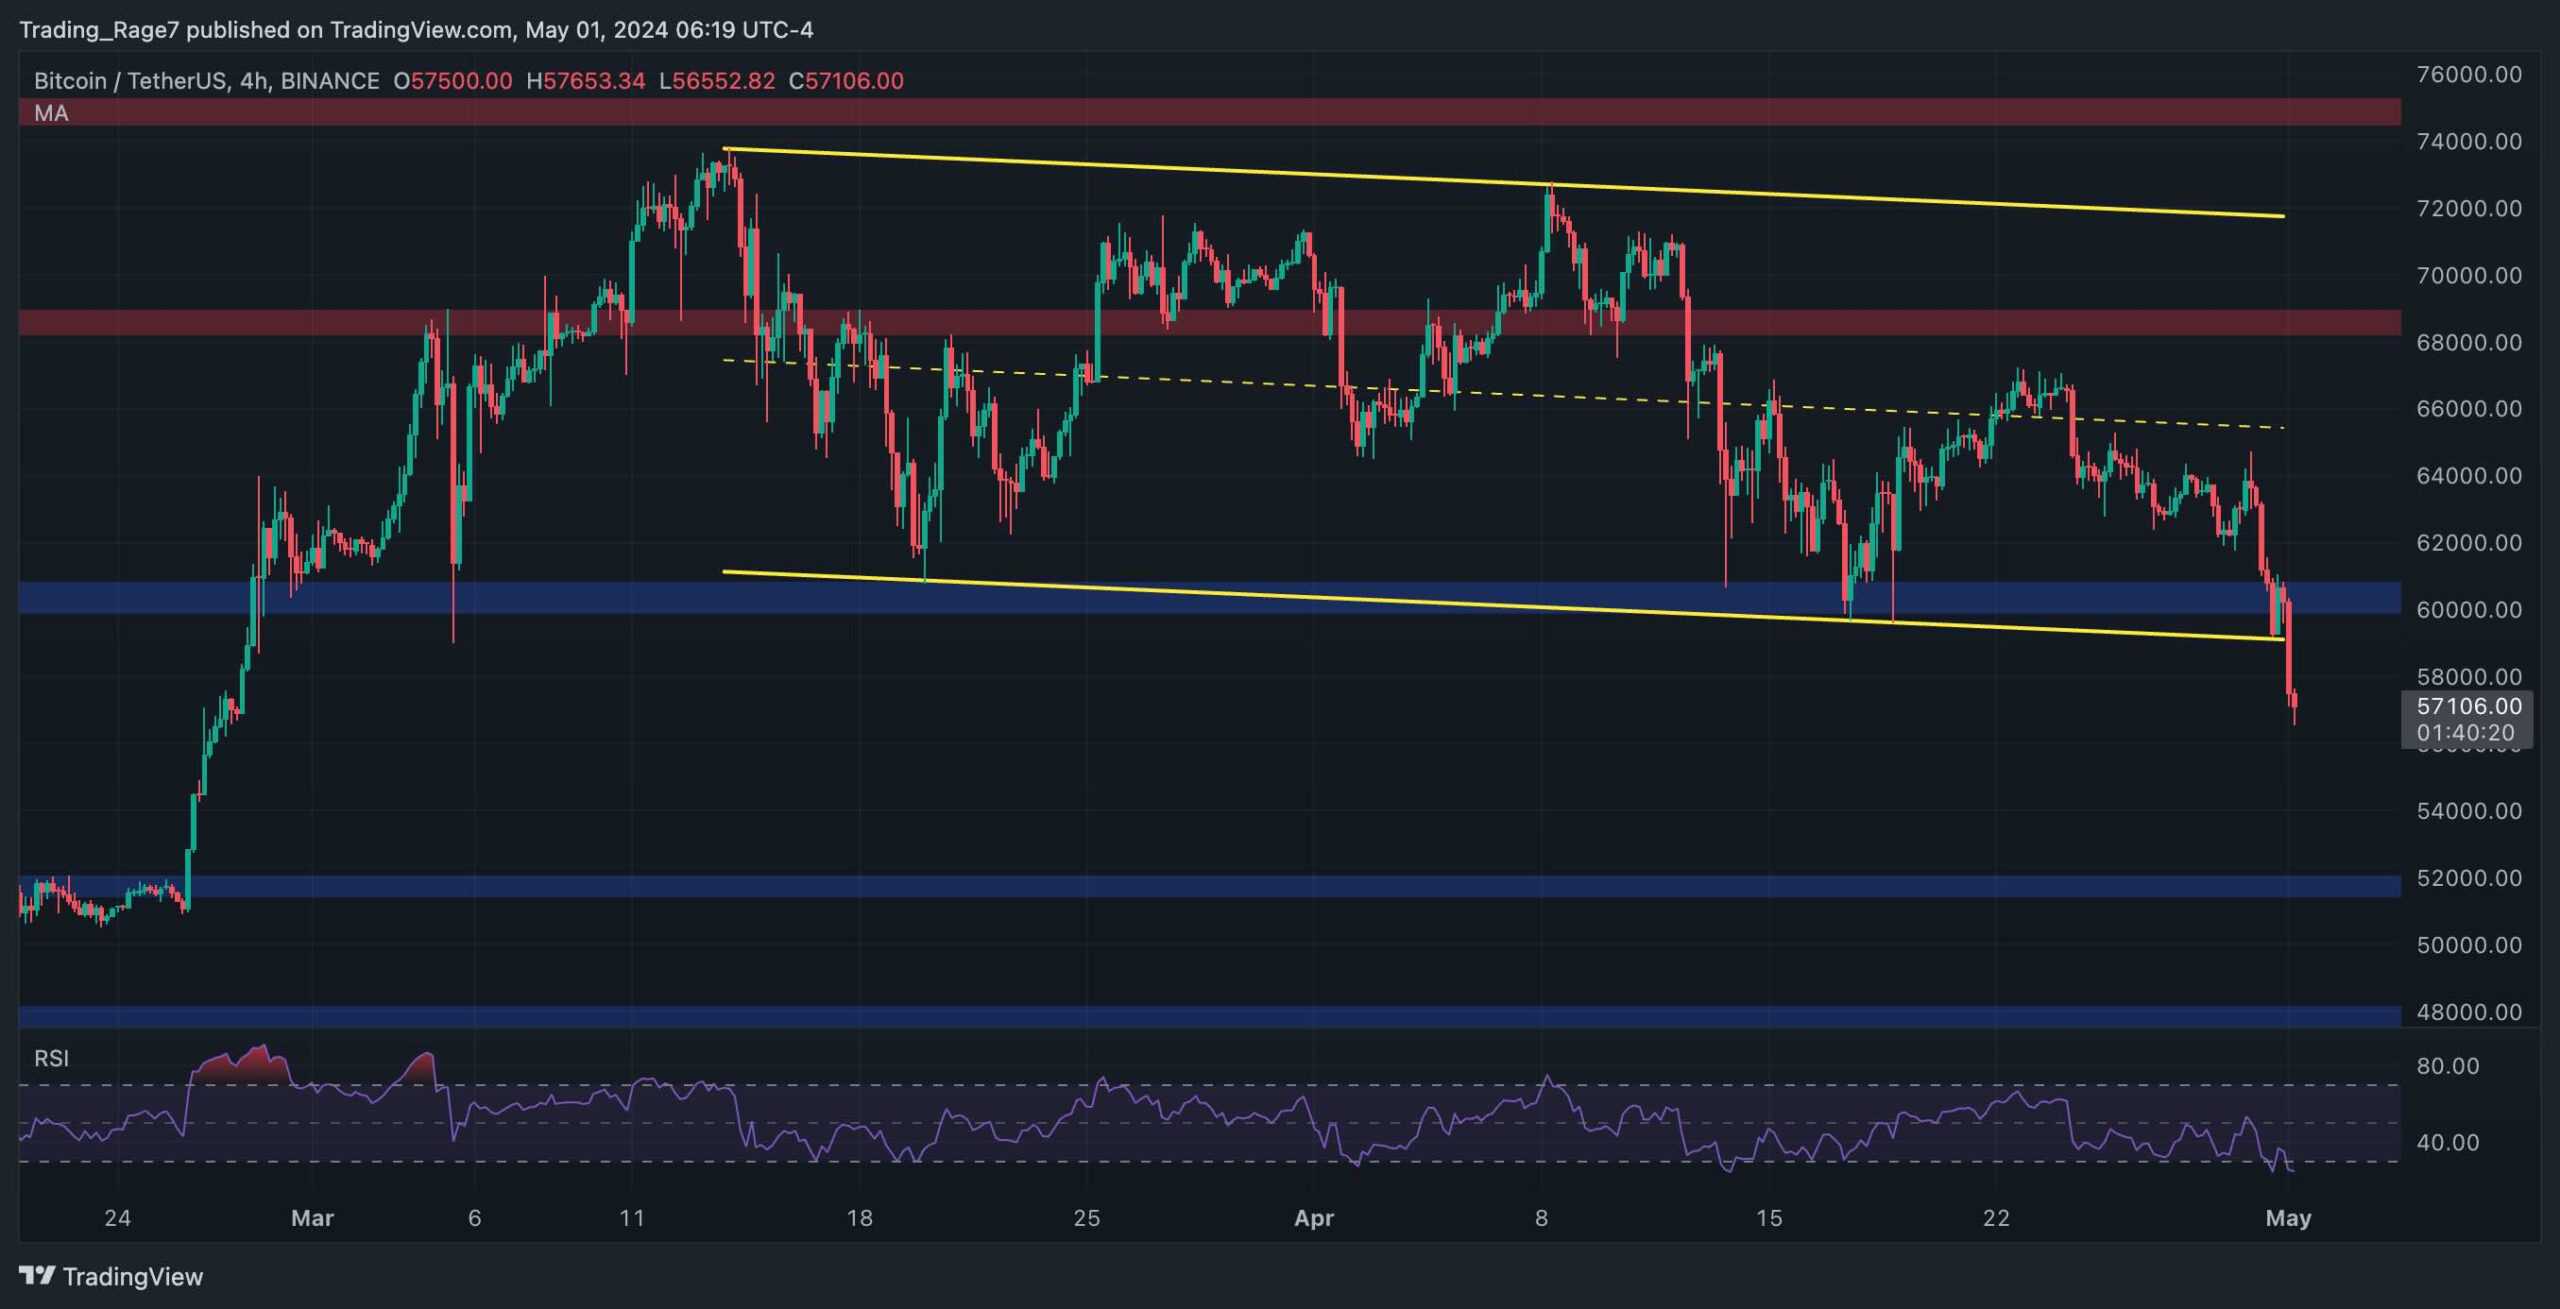
The 4-Hour Chart
Looking at the 4-hour timeframe, the price was rejected from the channel’s midline a few days ago. It has created lower highs and lows since, and has broken to the downside.
While things seem bearish, The Relative Strength Index has also entered the oversold region. Therefore, a short-term rebound and pullback toward $60K can be expected before a potential continuation lower toward $52K.
On-Chain Analysis
By TradingRage
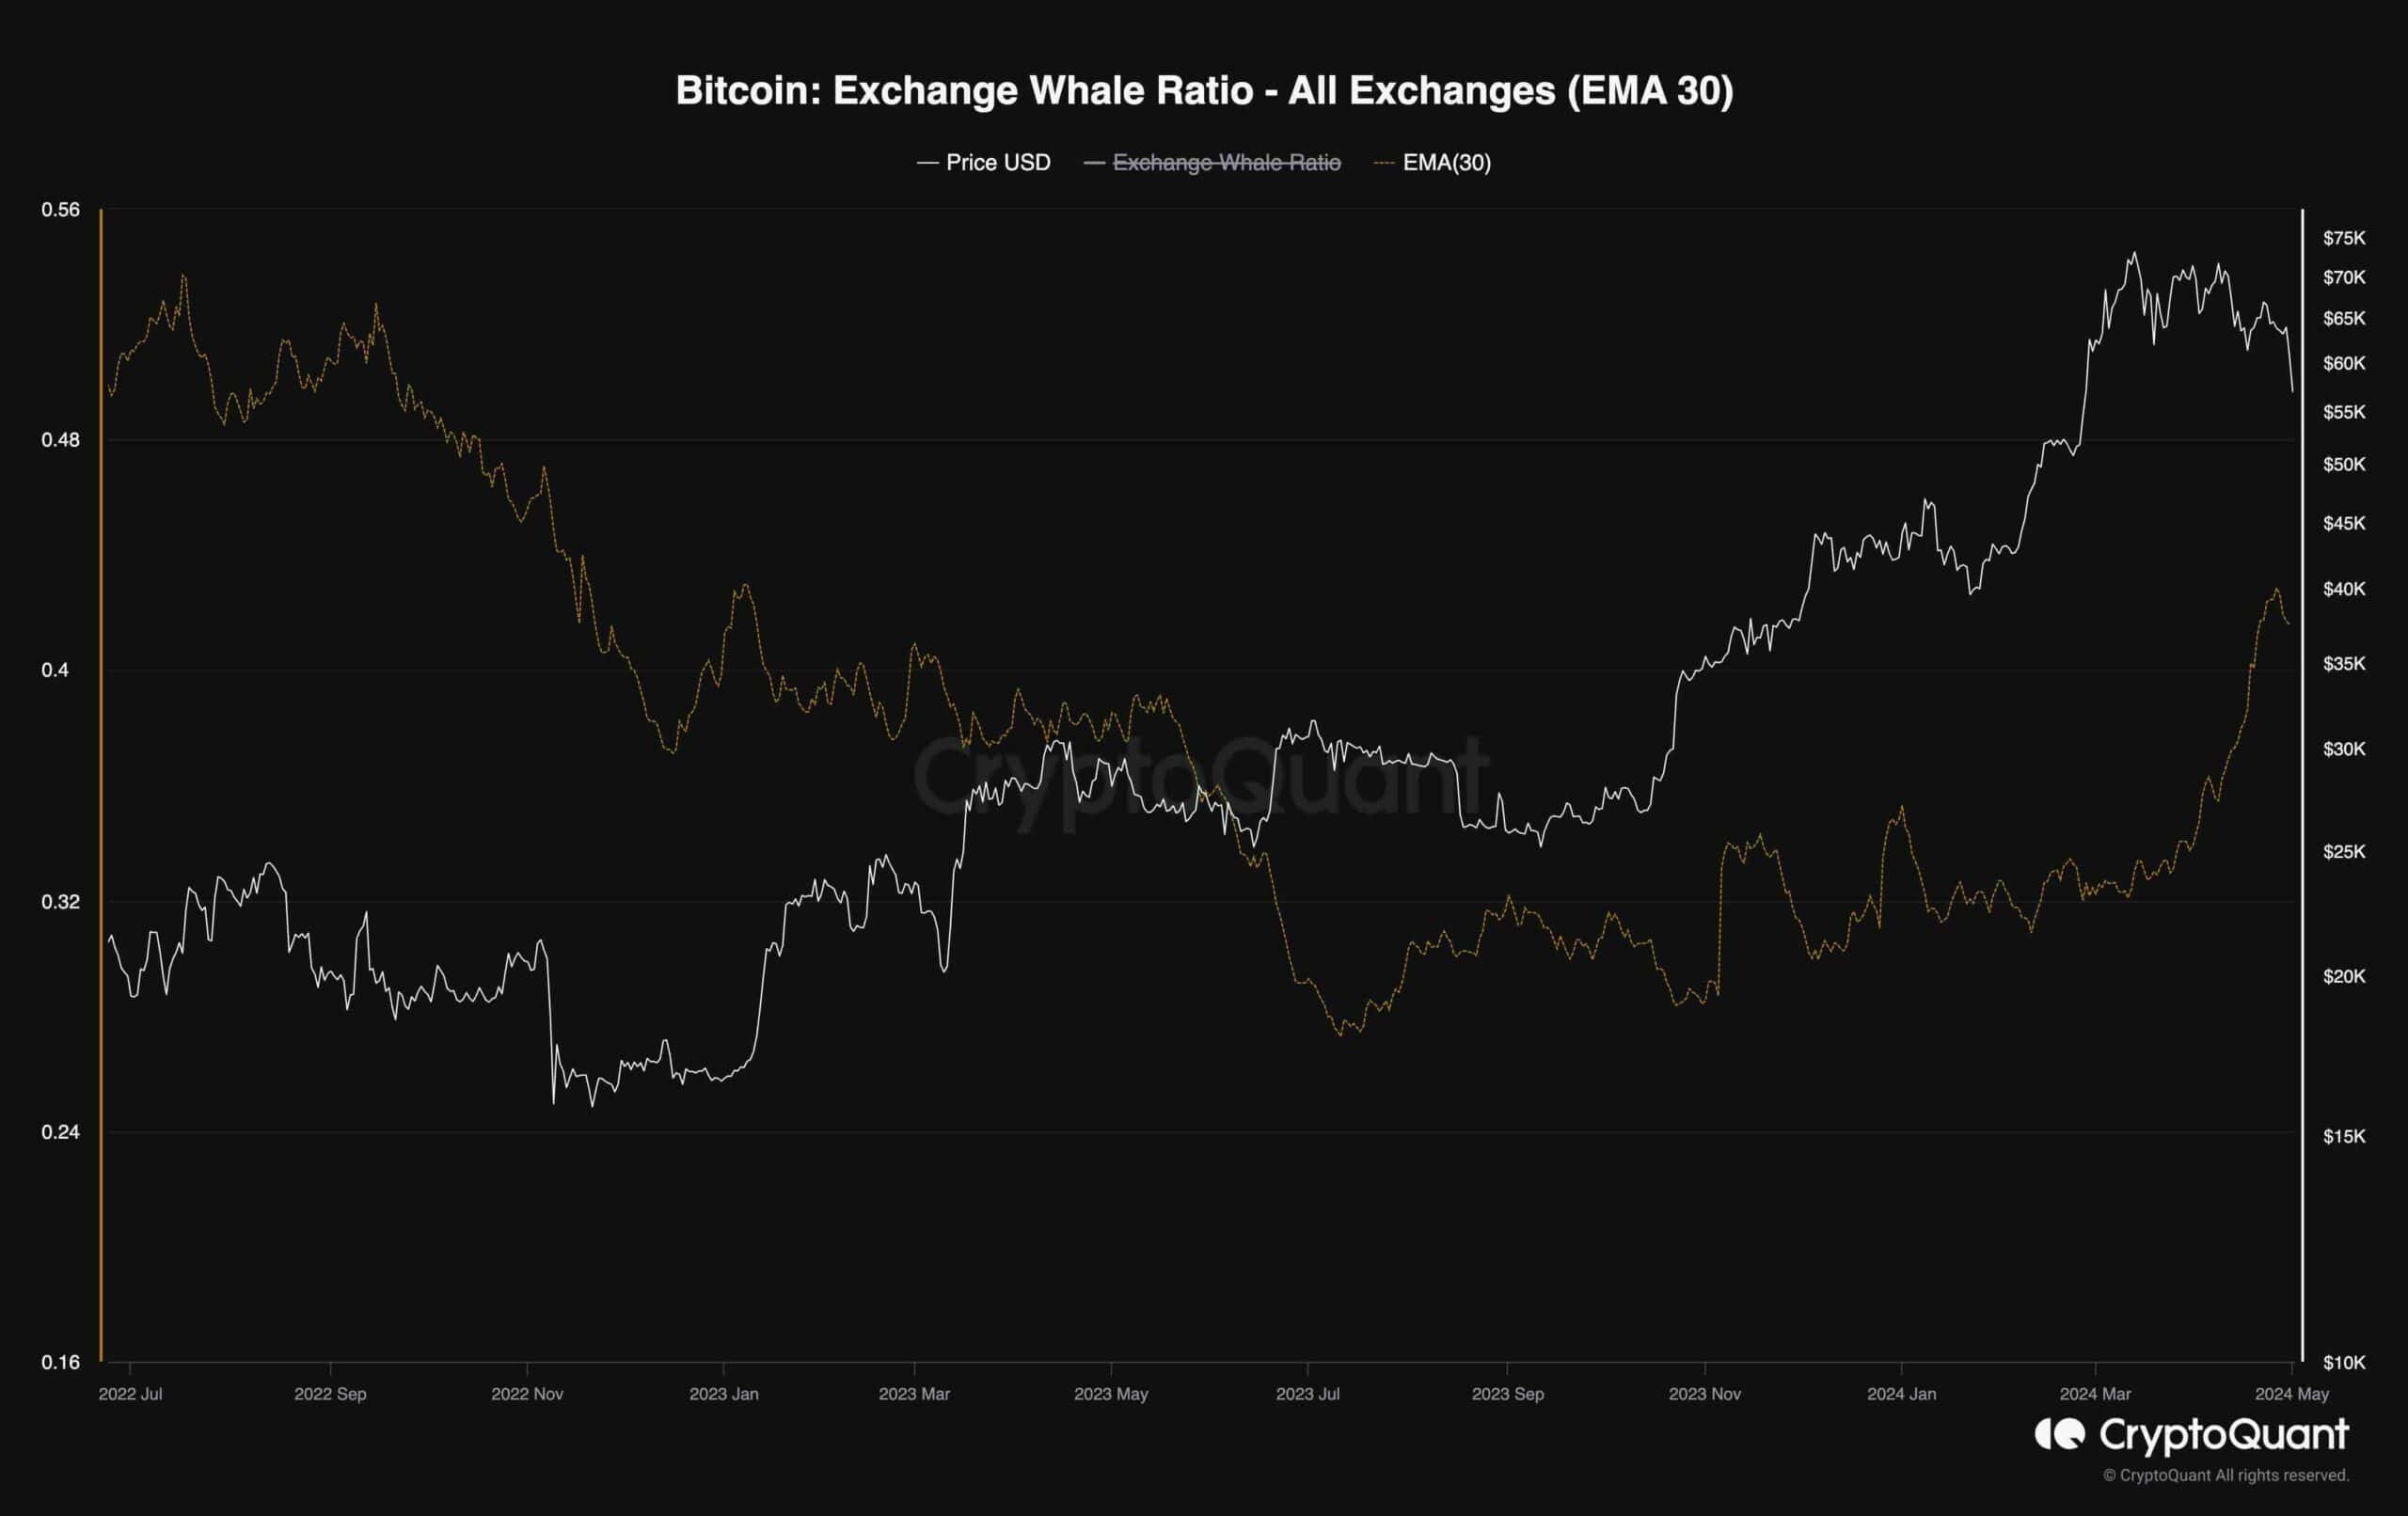
Bitcoin Exchange Whale Ratio
Bitcoin’s price has been dropping since its rejection from the $75K level. Many market participants are wondering when and whether the market will rebound. This chart can provide some potential answers.
This metric is the Exchange Whale Ratio (with a 30-day exponential moving average applied). It shows the ratio of exchange deposits by whales compared to all deposits.
As the chart demonstrates, the metric has recently increased significantly. This means that the whales have been rapidly depositing their coins in exchanges to potentially sell them. The resulting pressure is likely one of the contributing reasons for the recent correction. So, we can expect the correction to stop if the whale ratio declines once more.