After reaching %excerpt%.03 mark yesterday, ZIL for support around %excerpt%.024 and bounced back.Zilliqa’s parabolic move looks strong, but it’s maintaining higher highs and higher lows on the 4-hours time frame.ZIL/USD: Zilliqa Bouncing BackKey Resistance Levels: %excerpt%.03, %excerpt%.032, %excerpt%.034Key Support Levels: %excerpt%.024, %excerpt%.0226, %excerpt%.0198ZIL/USD. Source: TradingViewZilliqa saw an impressive performance since May following a 66% increase over the last seven days. This surge started after a slow push above %excerpt%.005 level, but it became more significant after surpassing the psychological level at %excerpt%.01 on May 15.Following the significant parabolic move, the price recently dropped to around %excerpt%.024 after marking fresh high at %excerpt%.03 yesterday. The bullish action is still very strong on the daily chart, but it is
Topics:
Michael Fasogbon considers the following as important: Price Analysis, zilliqa
This could be interesting, too:
Bhushan Akolkar writes Zilliqa Blockchain Issues ‘Permanent Fix’ after Latest Malfunctioning
CryptoVizArt writes ETH’s Path to K Involves Maintaining This Critical Support (Ethereum Price Analysis)
Duo Nine writes Crypto Price Analysis June-29: ETH, XRP, ADA, DOGE, and DOT
Duo Nine writes Crypto Price Analysis June-15: ETH, XRP, ADA, DOGE, and DOT
- After reaching $0.03 mark yesterday, ZIL for support around $0.024 and bounced back.
- Zilliqa’s parabolic move looks strong, but it’s maintaining higher highs and higher lows on the 4-hours time frame.
ZIL/USD: Zilliqa Bouncing Back
Key Resistance Levels: $0.03, $0.032, $0.034
Key Support Levels: $0.024, $0.0226, $0.0198

Zilliqa saw an impressive performance since May following a 66% increase over the last seven days. This surge started after a slow push above $0.005 level, but it became more significant after surpassing the psychological level at $0.01 on May 15.
Following the significant parabolic move, the price recently dropped to around $0.024 after marking fresh high at $0.03 yesterday. The bullish action is still very strong on the daily chart, but it is maintaining a higher high and higher low pattern on the 4-hours chart.
Meanwhile, the increase is supported by a yellow diagonal line, followed by a blue line, which is now acting as weekly support since June 4. A strong correction can be expected if the price drops below this trend line
Zilliqa Price Analysis
Following the latest price drops, Zilliqa just saw a quick recovery near $0.024, and the price is now charging back towards the $0.030 resistance, which was printed yesterday.
If the price continues to fall, especially below the blue line that just provided support around $0.024, ZIL may extend its correction down to the yellow ascending line. If such a scenario occurs, the support to keep in mind is $0.0226 and $0.0198, marked white on the chart.
And if the price further dips below this trend line, it would confirm a short-term reversal signal for the 36th largest cryptocurrency.
ZIL/BTC: Zilliqa Found Temporary Support At 257 SAT
Key Resistance Levels: 320 SAT, 340 SAT
Key Support Levels: 233 SAT, 197 SAT
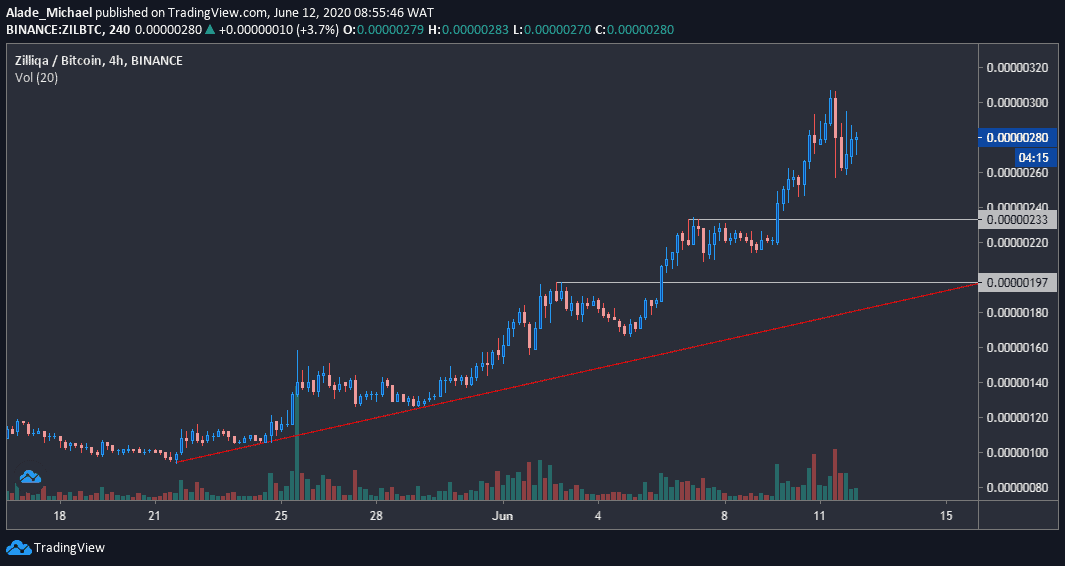
Despite yesterday’s drop in Bitcoin’s price, Zilliqa is looking bullish on the daily chart, but the parabolic move may end if it resumes the last 24-hours correction. It is currently changing hands around 274 SAT with 8% drops over the previous day.
The latest bounce at the 257 SAT level is now luring buyers back in the market. It may find a strong rebound level at 233 SAT if the price slips.
A push above the 307 SAT level could trigger more positive moves for ZIL. Otherwise, the price could drop a bit before it bounces back. The red ascending line is likely to provide support on a short-term perspective if selling becomes heavy.
Zilliqa Price Analysis
As said above, the price found support at 257 SAT. If the level holds and the price increases above 307 SAT, the next bullish actions would be targeted at the 320 SAT and 340 SAT resistance levels. As of now, the price action is still looking a bit calm.
If the price drops further, the first level to watch is 233 SAT, followed by the second grey line of 197 SAT – bottomed around the red trend line. In case of a breakdown, the next support to think of is 167 SAT and 126 SAT levels.