Since breaking above the 00 mark on Wednesday, Bitcoin sees only one way. The primary cryptocurrency climbed the resistance stairs and now about to reach a critical resistance trend-line.Bitcoin Bulls Are Back, Until When?As we mentioned here a few days ago, there is no better time to long Bitcoin than when everyone on crypto-twitter is bearish. The majority is almost always wrong in trading.Back to Bitcoin: After an impressive rally and consolidation at the first resistance zone of 00 – 00, Bitcoin broke above to our next mention targets of 00, and 00 (which is the current daily high as of now).As of writing these lines, Bitcoin seems like building a demand zone on top of the 00 resistance turned support level.This is from our previous analysis on Wednesday: “Looking at
Topics:
Yuval Gov considers the following as important: Bitcoin (BTC) Price, BTC Analysis, btcusd, btcusdt
This could be interesting, too:
Chayanika Deka writes XRP, SOL, and ADA Inclusion in US Crypto Reserve Pushes Traders on Edge
Chayanika Deka writes Why Arthur Hayes Is Bullish on Bitcoin Under Trump’s Economic Strategy
Mandy Williams writes Why the Bitcoin Market Is Stuck—and the Key Metric That Could Change It: CryptoQuant CEO
Wayne Jones writes Metaplanet Acquires 156 BTC, Bringing Total Holdings to 2,391
Since breaking above the $9000 mark on Wednesday, Bitcoin sees only one way. The primary cryptocurrency climbed the resistance stairs and now about to reach a critical resistance trend-line.
Bitcoin Bulls Are Back, Until When?
As we mentioned here a few days ago, there is no better time to long Bitcoin than when everyone on crypto-twitter is bearish. The majority is almost always wrong in trading.
Back to Bitcoin: After an impressive rally and consolidation at the first resistance zone of $9200 – $9300, Bitcoin broke above to our next mention targets of $9400, and $9600 (which is the current daily high as of now).
As of writing these lines, Bitcoin seems like building a demand zone on top of the $9400 resistance turned support level.
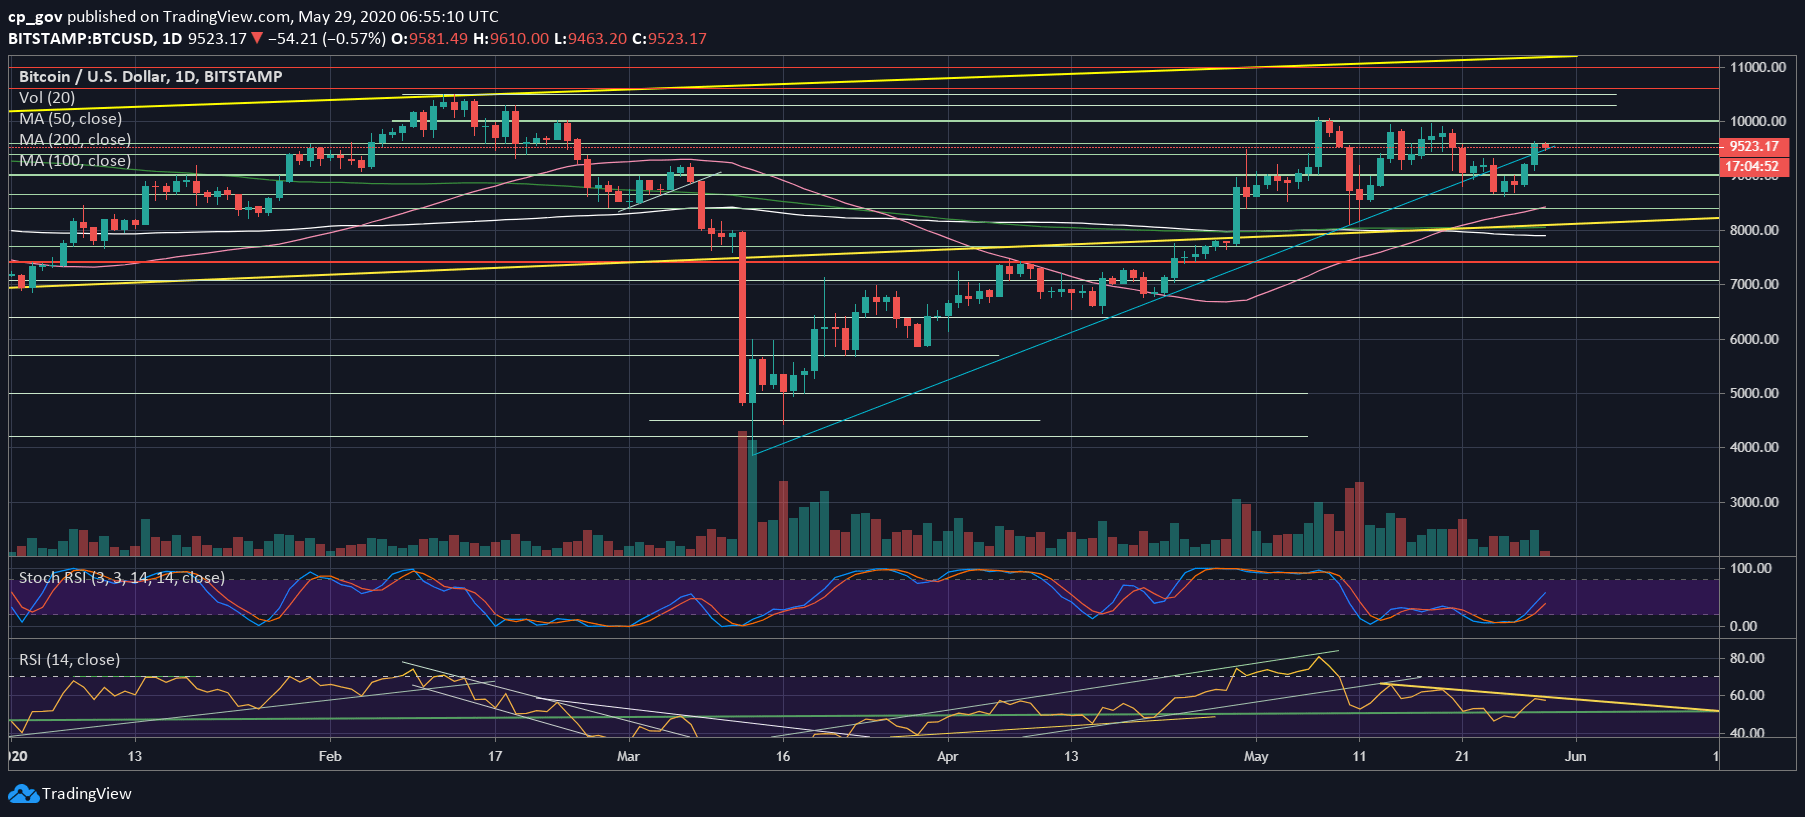
This is from our previous analysis on Wednesday: “Looking at the bigger time-frame, a confirmation of a bullish trend will be made once $9200 – $9300 is breached, and a new higher-low will be produced upon this level.”
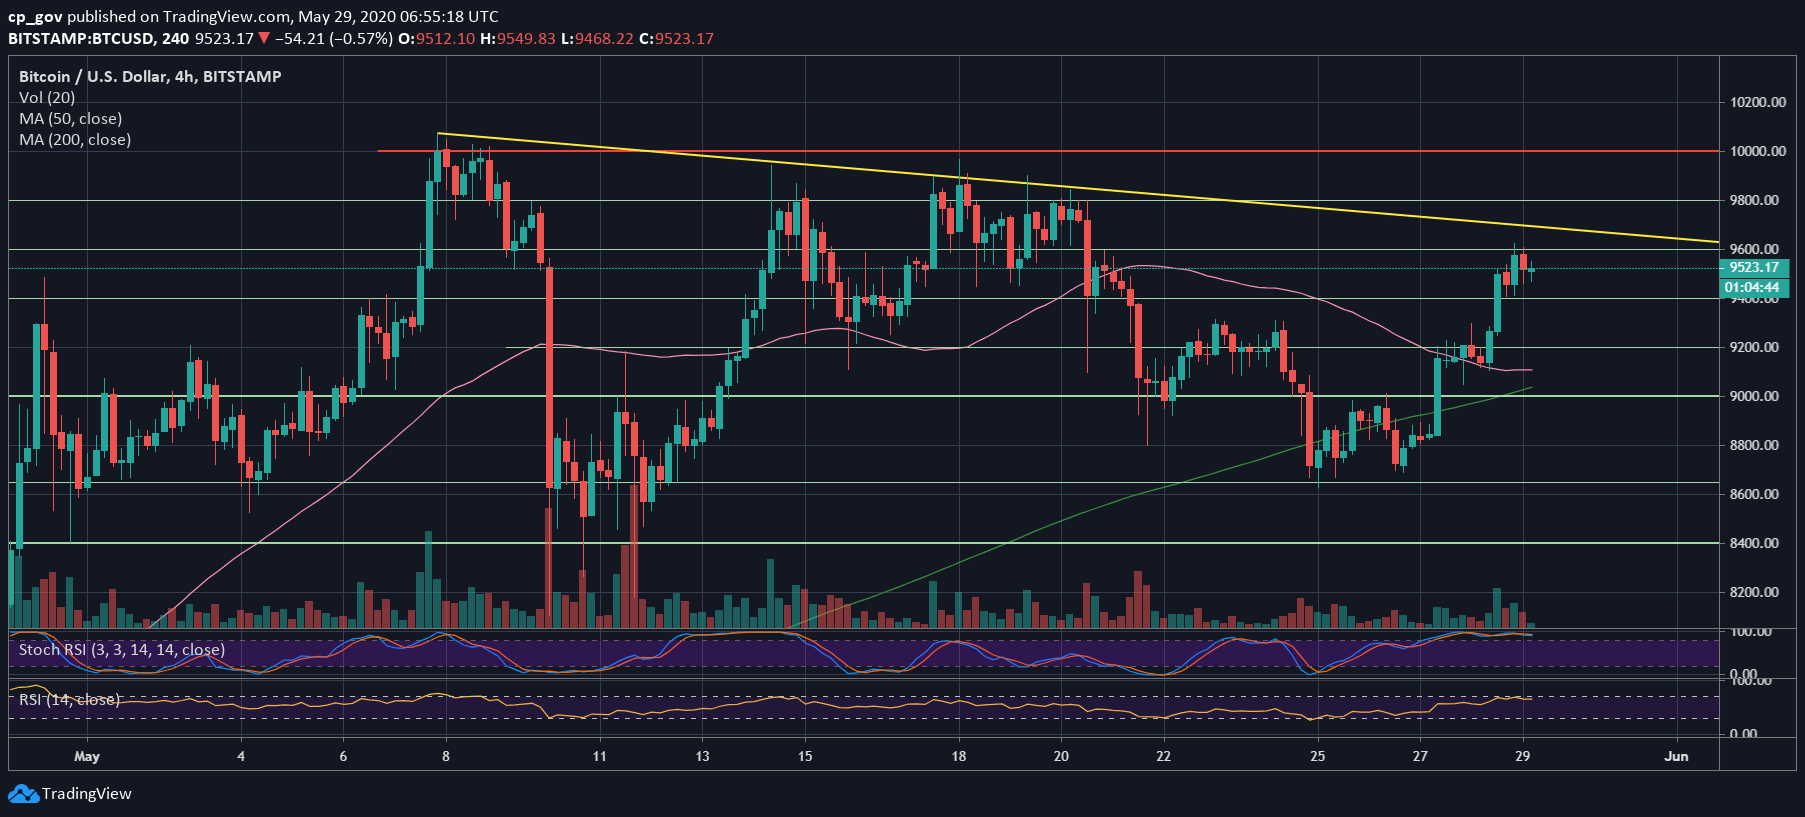
With all the bullishness out there, Bitcoin will soon have to face a crucial resistance line, the yellow descending line on the following 4-hour chart. So far, Bitcoin had seen five failed attempts to break above this line.
All the attempts took place over the past three weeks. Can Bitcoin do it this time and break above this line around $9700? Absolutely. However, after almost $900 gains in four days, Bitcoin might need to chill a bit.
Looking at the daily RSI, we can see it trading safely above the 50 zone. However, the RSI encountered descending trend-line resistance and, so far, failed to break. Does it say something about the upcoming Bitcoin’s trend-line resistance? We will have yet to see.
Bitcoin Short-term Support and Resistance Key Levels
As mentioned above, the $9600 is now the first resistance, while the major one will be the yellow line on the following 4-hour chart (around $9700).
In case of a breakup, Bitcoin will likely check $9900 – $10,000 once again. The more times Bitcoin tries out, the higher the chance the $10K will finally break.
From below, the first level of support now lies at $9400. Down below is the confluence zone at $9200 – $9300, which turned from resistance to support.
Total Market Cap: $265 billion
Bitcoin Market Cap: $175 billion
BTC Dominance Index: 66.0%
*Data by CoinGecko


