Over the past days, after getting rejected at the 00 price level, Bitcoin followed the global markets 2-day drop and fell straight to the 00 support.Looking at the Bitcoin chart, we can see that the latter is also a significant 61.8% Golden Fibonacci level, as mentioned in our most recent BTC price analysis.Bitcoin nicely held that support, along with the 50-days moving average line – marked pink on the following daily chart. Yesterday, following the deep-green on Wall Street, Bitcoin price gained 0 to retest the 00 resistance level.As of writing these lines, Bitcoin got rejected and now trading steadily above the K mark, so despite the decent surge in price, Bitcoin’s short-term direction had not changed much (yet).Looking at the 4-hour chart, we can see a lower-high
Topics:
Yuval Gov considers the following as important: Bitcoin (BTC) Price, BTC Analysis, btcusd
This could be interesting, too:
Chayanika Deka writes XRP, SOL, and ADA Inclusion in US Crypto Reserve Pushes Traders on Edge
Chayanika Deka writes Why Arthur Hayes Is Bullish on Bitcoin Under Trump’s Economic Strategy
Mandy Williams writes Why the Bitcoin Market Is Stuck—and the Key Metric That Could Change It: CryptoQuant CEO
Wayne Jones writes Metaplanet Acquires 156 BTC, Bringing Total Holdings to 2,391
Over the past days, after getting rejected at the $7300 price level, Bitcoin followed the global markets 2-day drop and fell straight to the $6800 support.
Looking at the Bitcoin chart, we can see that the latter is also a significant 61.8% Golden Fibonacci level, as mentioned in our most recent BTC price analysis.
Bitcoin nicely held that support, along with the 50-days moving average line – marked pink on the following daily chart. Yesterday, following the deep-green on Wall Street, Bitcoin price gained $400 to retest the $7200 resistance level.
As of writing these lines, Bitcoin got rejected and now trading steadily above the $7K mark, so despite the decent surge in price, Bitcoin’s short-term direction had not changed much (yet).
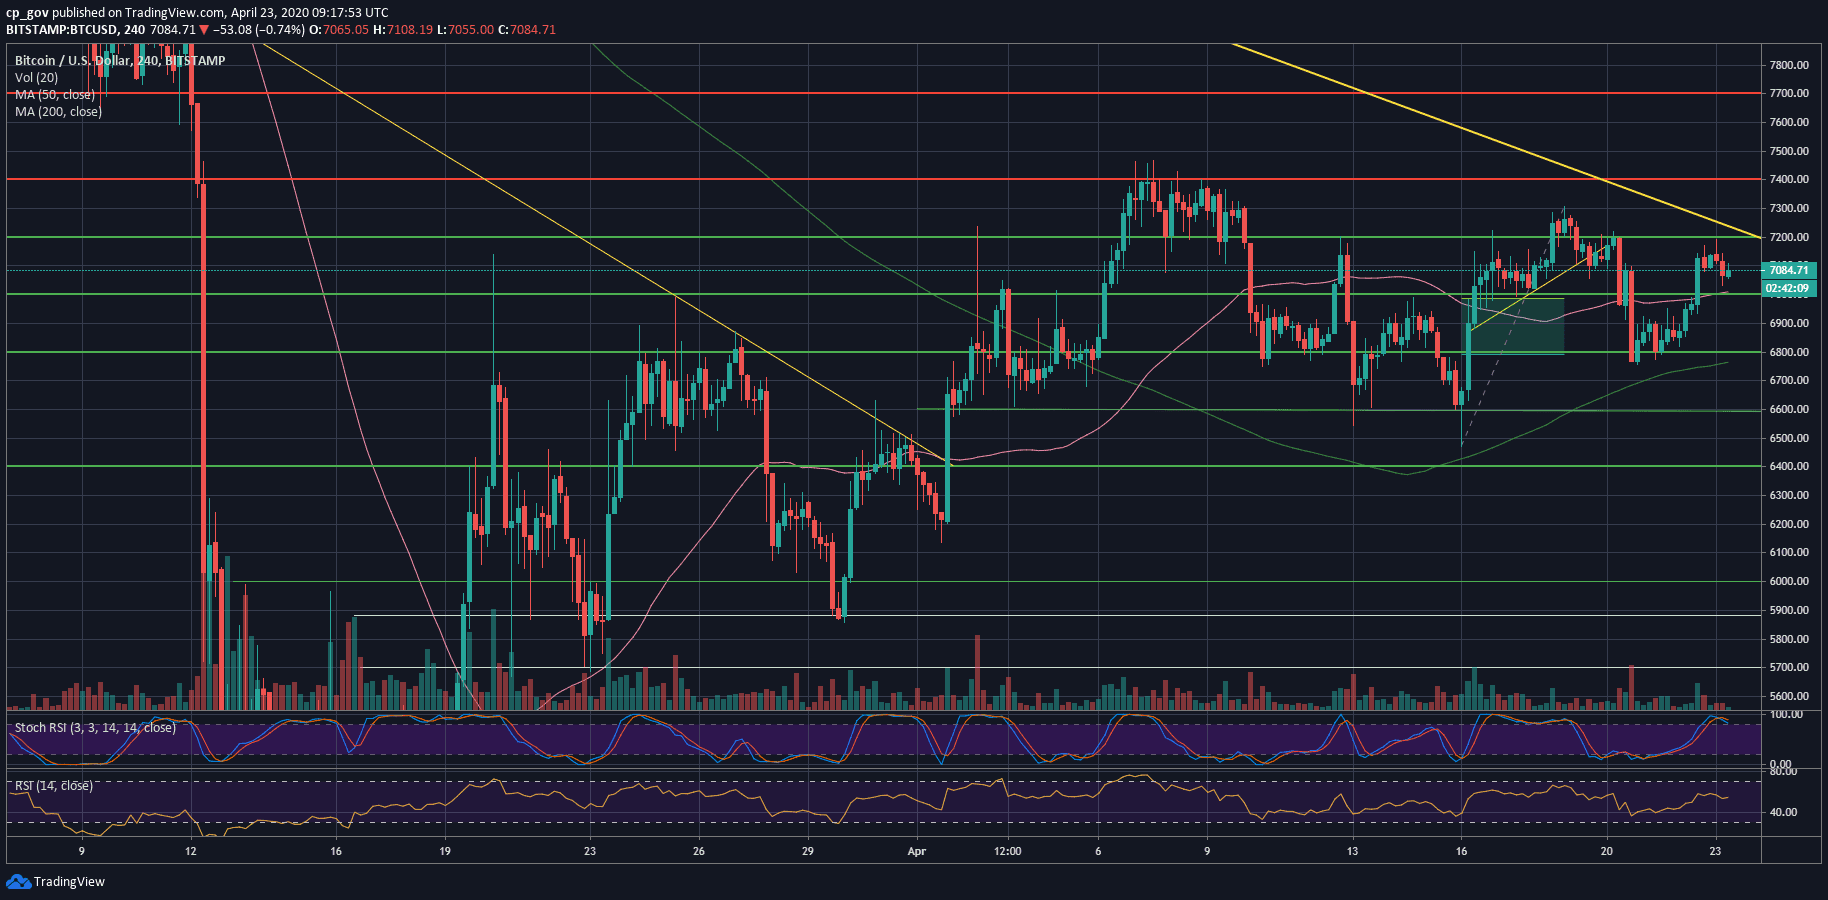
Looking at the 4-hour chart, we can see a lower-high trajectory, which is not in favor of the Bulls. This will be invalidated in case Bitcoin breaks above $7300, together with the marked descending trend-line, and also confirms it as support.
Total Market Cap: $205.3 billion
Bitcoin Market Cap: $130.3 billion
BTC Dominance Index: 63.5%
*Data by CoinGecko
Key Levels To Watch & Next Possible Targets
– Support/Resistance levels: As mentioned above, Bitcoin is facing $7200 as the first level of resistance, followed by $7300.
In case of a break-up, we can expect a quick move towards the monthly highs at $7400 – $7500. Further above lies the $7700 mark, which will be considered a “full recovery” from the March 12 plunge.
From below, the first level of support now lies at $7000. In case the latter breaks down, then the next support is the $6800, along with the mentioned MA-50 (currently around $6770). Further below lies $6600 and $6300 – $6400 price area.
– The RSI Indicator: The momentum indicator, the RSI, tells the same story as the price, lower highs. We will need to see a higher high in the price, along with a higher high of the RSI to continue higher. The RSI is still hovering around the neutral level of 50.
– Trading volume: Despite the recent days’ price action, the volume was not significant compared to the monthly average, and continues the daily volume decrease since the yearly-high of March 12 and 13.
BTC/USD BitStamp 4-Hour Chart
BTC/USD BitStamp 1-Day Chart
