Over the past days, the first ones of 2020, we received a reminder of the typical behavior of the Bitcoin price.As we pointed out about the trading volume, which was declining through the past week, we did get a considerable price action day (yesterday), recording the highest amount of volume of the past ten days.After breaking down the 70 support mark, we saw a rapid drop to 50. As stated before, the area of the next support level. This was maybe enough for Bitcoin, and together with some fundamental help from Donald Trump, Bitcoin surged 0 daily.The price increase ended accurately at the confluence resistance zone which includes the green-marked descending trend-line on the daily (that line is ‘blocking’ Bitcoin for six weeks already). The resistance area also consists of the
Topics:
Yuval Gov considers the following as important: Bitcoin (BTC) Price, BTCanalysis
This could be interesting, too:
Chayanika Deka writes XRP, SOL, and ADA Inclusion in US Crypto Reserve Pushes Traders on Edge
Chayanika Deka writes Why Arthur Hayes Is Bullish on Bitcoin Under Trump’s Economic Strategy
Mandy Williams writes Why the Bitcoin Market Is Stuck—and the Key Metric That Could Change It: CryptoQuant CEO
Jordan Lyanchev writes Liquidations Top 0M as Bitcoin Falls K, Reversing Trump-Driven Rally
Over the past days, the first ones of 2020, we received a reminder of the typical behavior of the Bitcoin price.
As we pointed out about the trading volume, which was declining through the past week, we did get a considerable price action day (yesterday), recording the highest amount of volume of the past ten days.
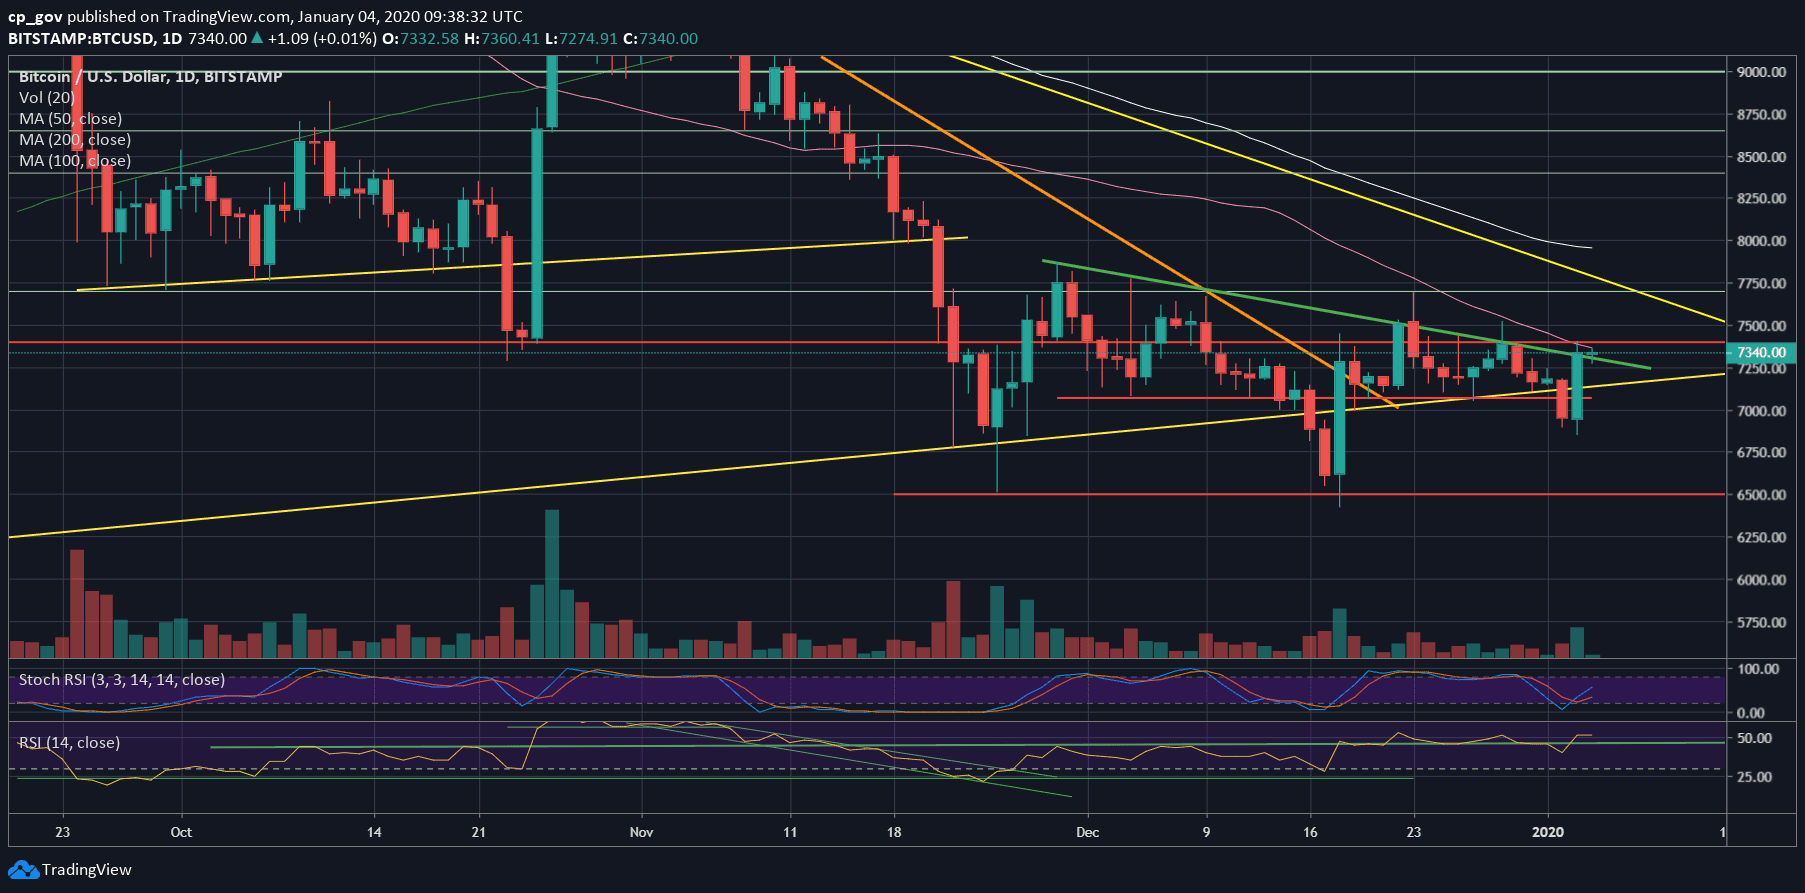
After breaking down the $7070 support mark, we saw a rapid drop to $6850. As stated before, the area of the next support level. This was maybe enough for Bitcoin, and together with some fundamental help from Donald Trump, Bitcoin surged $500 daily.
The price increase ended accurately at the confluence resistance zone which includes the green-marked descending trend-line on the daily (that line is ‘blocking’ Bitcoin for six weeks already). The resistance area also consists of the 50-days moving average line (the pink line) and resistance of $7400.
This won’t be so easy, but a bullish continuation is possible from here, but the condition will be to overcome the above resistance (daily candle above $7400, in my opinion).
Total Market Cap: $195.8 billion
Bitcoin Market Cap: $133.7 billion
BTC Dominance Index: 68.2%
*Data by CoinGecko
Key Levels to Watch
– Support/Resistance: As mentioned above, Bitcoin is one more time facing the confluence zone of $7300 – $7400.
The next resistance lies at $7700, which contains the significant mid-term descending trend-line. Further above is $7800 and $8000.
From below, the first level of support is $7200, together with the mid-term ascending trend-line. The next support is the $7000 – $7070 price zone, before yesterday’s low at $6850.
– The RSI Indicator: Despite a small glitch, the 45 RSI support line had been kept firm. The RSI is now supporting the continuation of the current bullish move; however, anything can be changed at any given moment.
– Trading volume: discussed above.
BTC/USD BitStamp 1-Day Chart
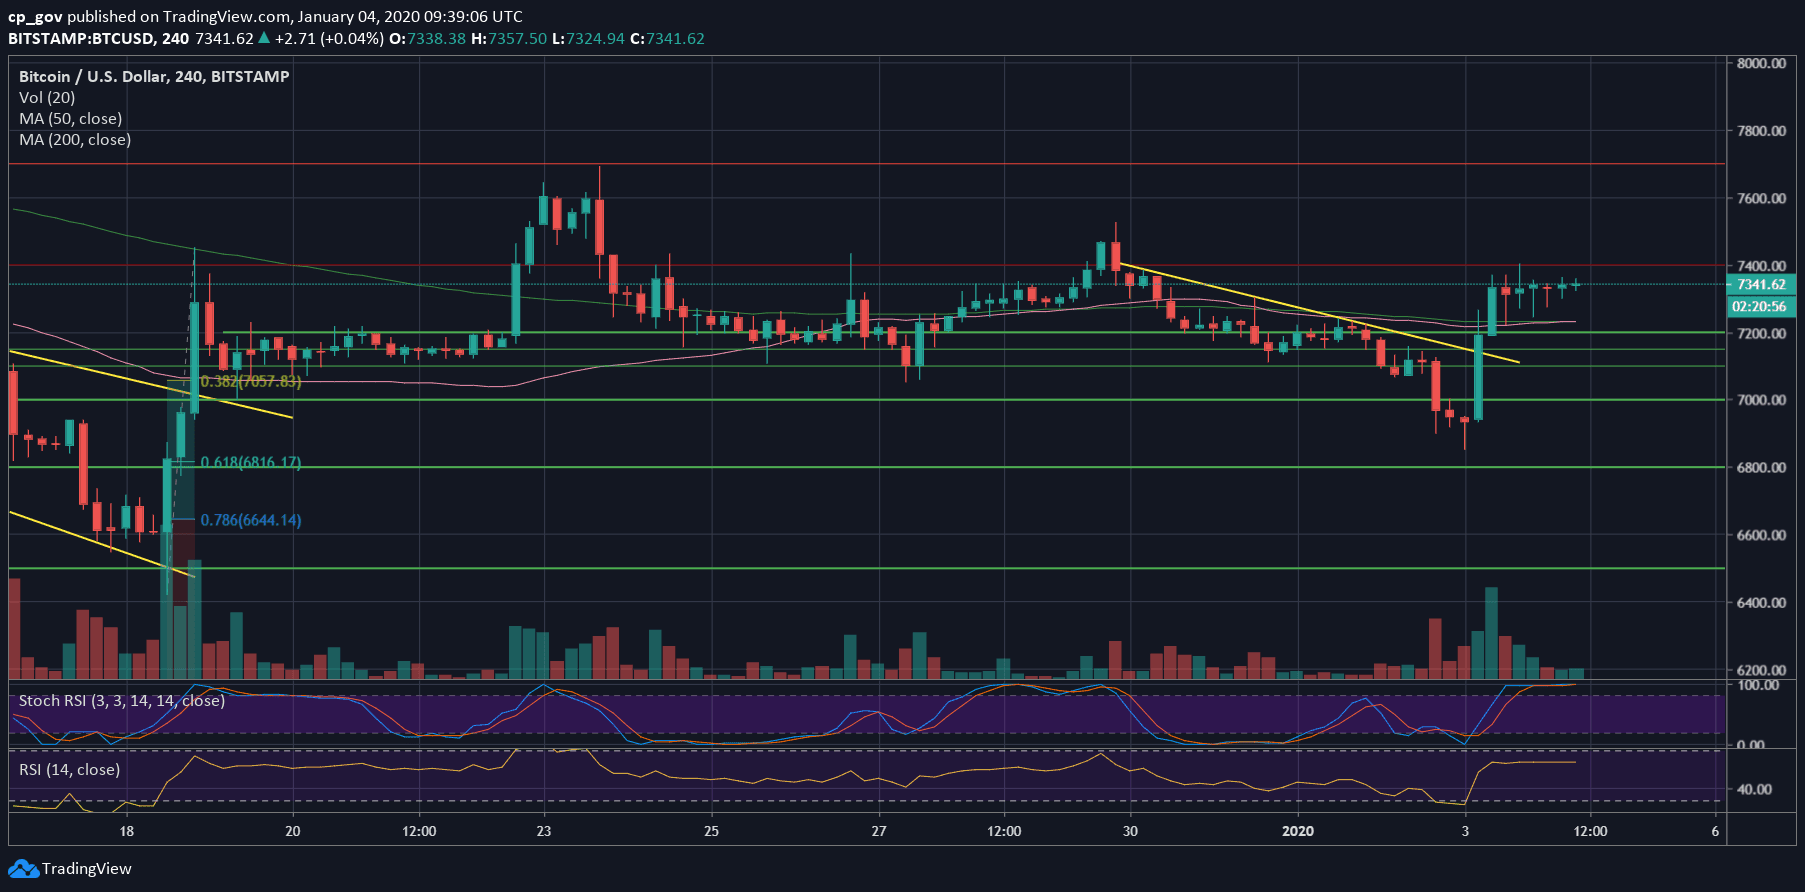
BTC/USD BitStamp 4-Hour Chart