Three days ago, we had written here that “those are likely to be the last days of Bitcoin below the legendary price of ,000.” A few hours ago, we finally saw Bitcoin breaking above the legendary 5-digits number boundary.As mentioned in our most recent price analysis, the momentum is bullish, very bullish. Looking at the price action over the past ten days, we can see Bitcoin reaching to the local high of 00 and correcting down to 75, which was exactly the 38.2% Fib level.From there, Bitcoin surged back above, broke the 00 this time, and yesterday it went down to confirm it as support level. All the described action is just to emphasize the way up looks like a very healthy bullish trend, as of now.As a reminder, the last time Bitcoin broke above ,000 was on October 26, 2019,
Topics:
Yuval Gov considers the following as important: AA News, BTCanalysis
This could be interesting, too:
Chayanika Deka writes Yuga Labs Secures Major Win as SEC Closes Investigation Without Charges
Andrew Throuvalas writes Bitcoin Soars Back To ,000 After BlackRock CEO Says “Buy The Dip”
Chayanika Deka writes XRP, SOL, and ADA Inclusion in US Crypto Reserve Pushes Traders on Edge
Chayanika Deka writes Why Arthur Hayes Is Bullish on Bitcoin Under Trump’s Economic Strategy
Three days ago, we had written here that “those are likely to be the last days of Bitcoin below the legendary price of $10,000.” A few hours ago, we finally saw Bitcoin breaking above the legendary 5-digits number boundary.
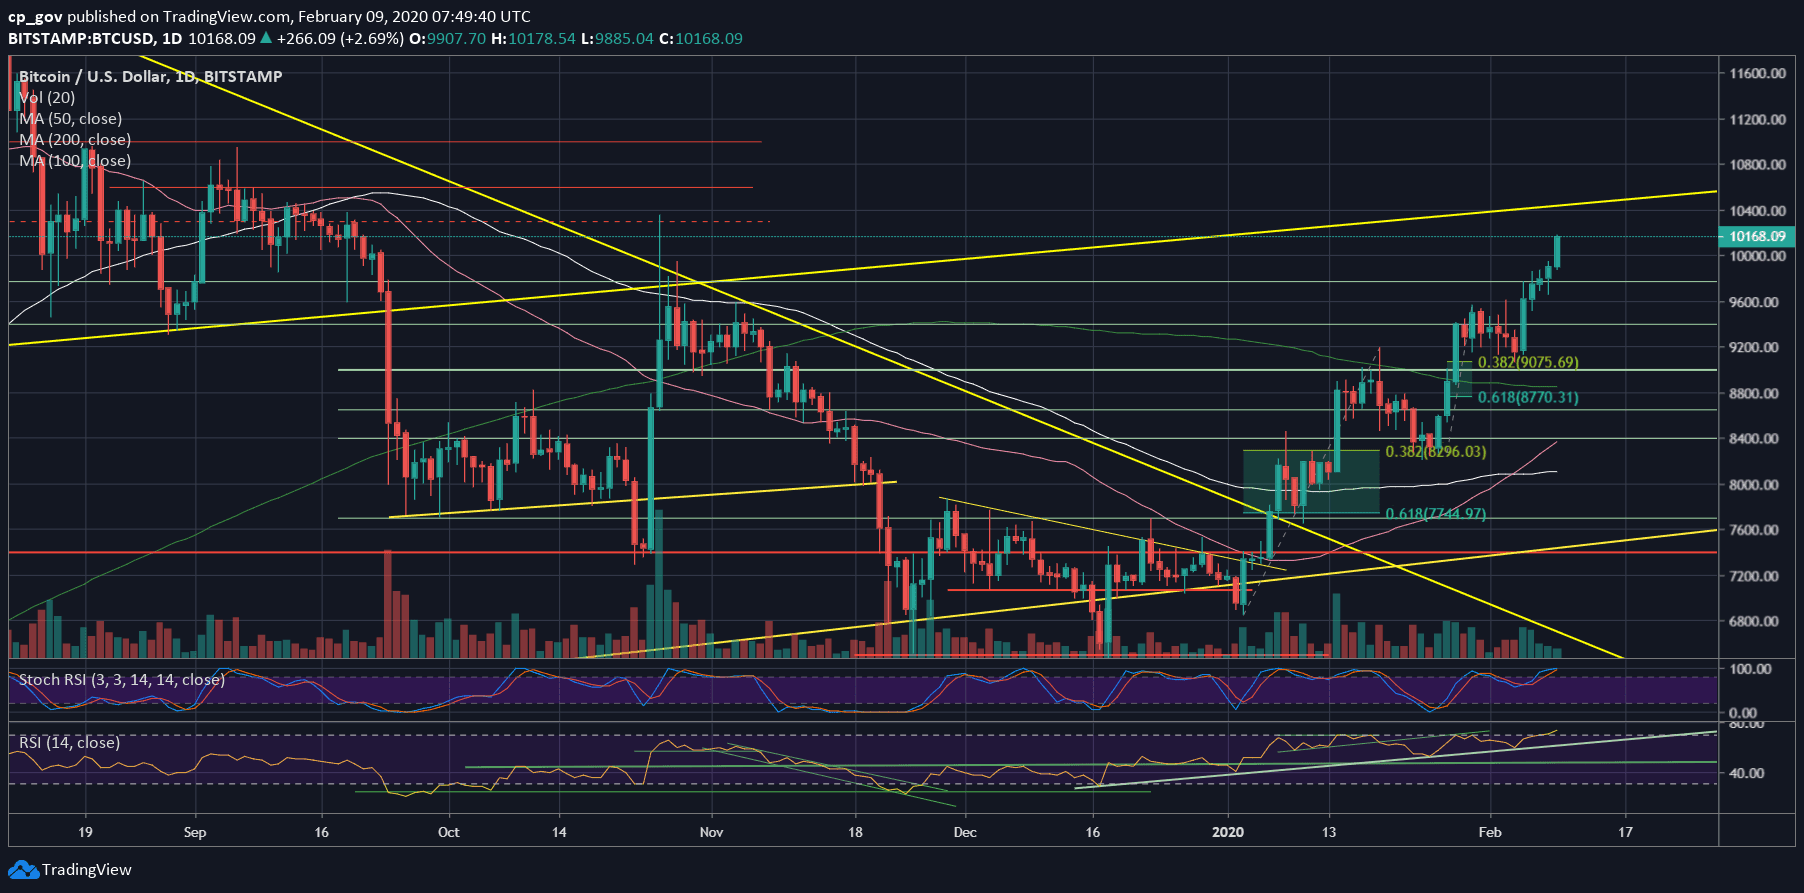
As mentioned in our most recent price analysis, the momentum is bullish, very bullish. Looking at the price action over the past ten days, we can see Bitcoin reaching to the local high of $9600 and correcting down to $9075, which was exactly the 38.2% Fib level.
From there, Bitcoin surged back above, broke the $9600 this time, and yesterday it went down to confirm it as support level. All the described action is just to emphasize the way up looks like a very healthy bullish trend, as of now.
As a reminder, the last time Bitcoin broke above $10,000 was on October 26, 2019, when Bitcoin saw its third biggest-ever daily rally following China President’s speech embracing blockchain technology. On that day, it held there only for few hours before correcting down, a little bit “unhealthy” behavior.
If we ignore that daily spike, the last time one Bitcoin was trading for more than $10,000 was during the 24 of September 2019. Four and a half months ago.
Total Market Cap: $288.8 billion
Bitcoin Market Cap: $183.5 billion
BTC Dominance Index: 63.6%
*Data by CoinGecko
Key Levels To Watch & Next Possible Targets
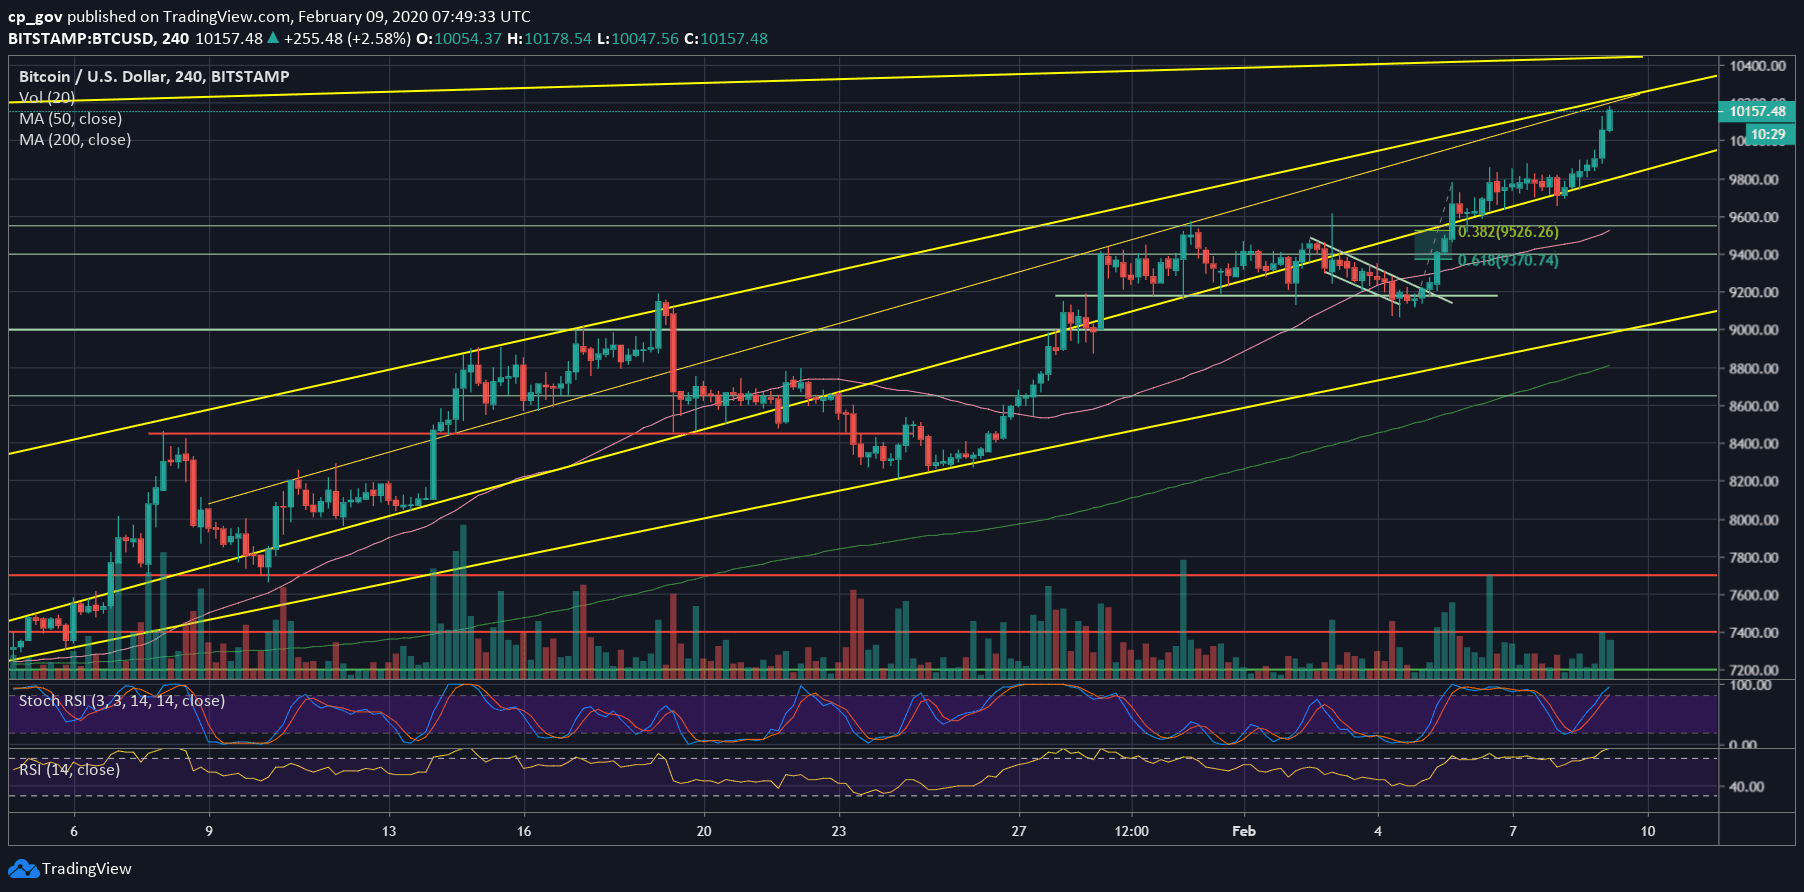
– Support/Resistance levels: Following Bitcoin’s breakout above $10,000, the first level of resistance now lies between the $10,300 and $10,400.
This old resistance contains the high that was reached during the “Chinese pump” on October 26 ($10,350), along with past horizontal resistance and the long-term ascending line as can be seen on both the following charts- 4-hour and daily.
In case of a breakout, then the next level of resistance is $10,650, before the $10,900 – $11,000 price level. Further above lie $11,400 and $11,600 resistance levels.
From below, the first level of support is now the $9,900 – $10,000 resistance turned support price zone. Further below lies $9600 and $9400.
– The RSI Indicator: Just like the price action, the RSI indicator had also broken above the 2020’s high, which was the resistance level around 70 (RSI level). This supports the recent price action and it’s another sign that the breakout above $10,000 is real and healthy.
– Trading volume: Keeping in mind that most of the traders are off for the weekend, the amount of trading volume is sufficient. However, it will be interesting to see how the CME’s new price gap will close tomorrow, if at all, when the Bitcoin Futures trading gets back for trading.
BTC/USD BitStamp 4-Hour Chart
BTC/USD BitStamp 1-Day Chart