XRP saw a 6% price increase today as the buyers manage to rise above %excerpt%.31Last week, the coin found strong support at %excerpt%.28, which allowed it to push higher and reclaim %excerpt%.3 over the weekend.Against Bitcoin, XRP bounced from 2435 SAT last week to reach the current 2555 SAT level.XRP/USD: XRP Bulls Break Bullish Flag PatternKey Support Levels: %excerpt%.3, %excerpt%.28, %excerpt%.264.Key Resistance Levels: %excerpt%.313, %excerpt%.321, %excerpt%.341.Last week XRP fell from a resistance level above %excerpt%.30 and found support at %excerpt%.28. The buyers managed to defend this level, which allowed them to push higher throughout the second half of last week.Over the weekend, XRP pushed higher above %excerpt%.30 and managed to sustain itself above there. Interestingly, the coin started to form a bullish flag pattern. This bullish flag was broken today
Topics:
Yaz Sheikh considers the following as important: Ripple (XRP) Price, XRP Analysis, xrpbtc, xrpusd
This could be interesting, too:
Jordan Lyanchev writes Ripple’s (XRP) Surge to Triggers Over Million in Short Liquidations
Jordan Lyanchev writes Trump Confirms Work on Strategic Crypto Reserve: XRP, ADA, SOL Included
Dimitar Dzhondzhorov writes Is a Major Ripple v. SEC Lawsuit Development Expected This Week? Here’s Why
Mandy Williams writes Ripple Releases Institutional DeFi Roadmap for XRP Ledger in 2025
- XRP saw a 6% price increase today as the buyers manage to rise above $0.31
- Last week, the coin found strong support at $0.28, which allowed it to push higher and reclaim $0.3 over the weekend.
- Against Bitcoin, XRP bounced from 2435 SAT last week to reach the current 2555 SAT level.
XRP/USD: XRP Bulls Break Bullish Flag Pattern
Key Support Levels: $0.3, $0.28, $0.264.
Key Resistance Levels: $0.313, $0.321, $0.341.
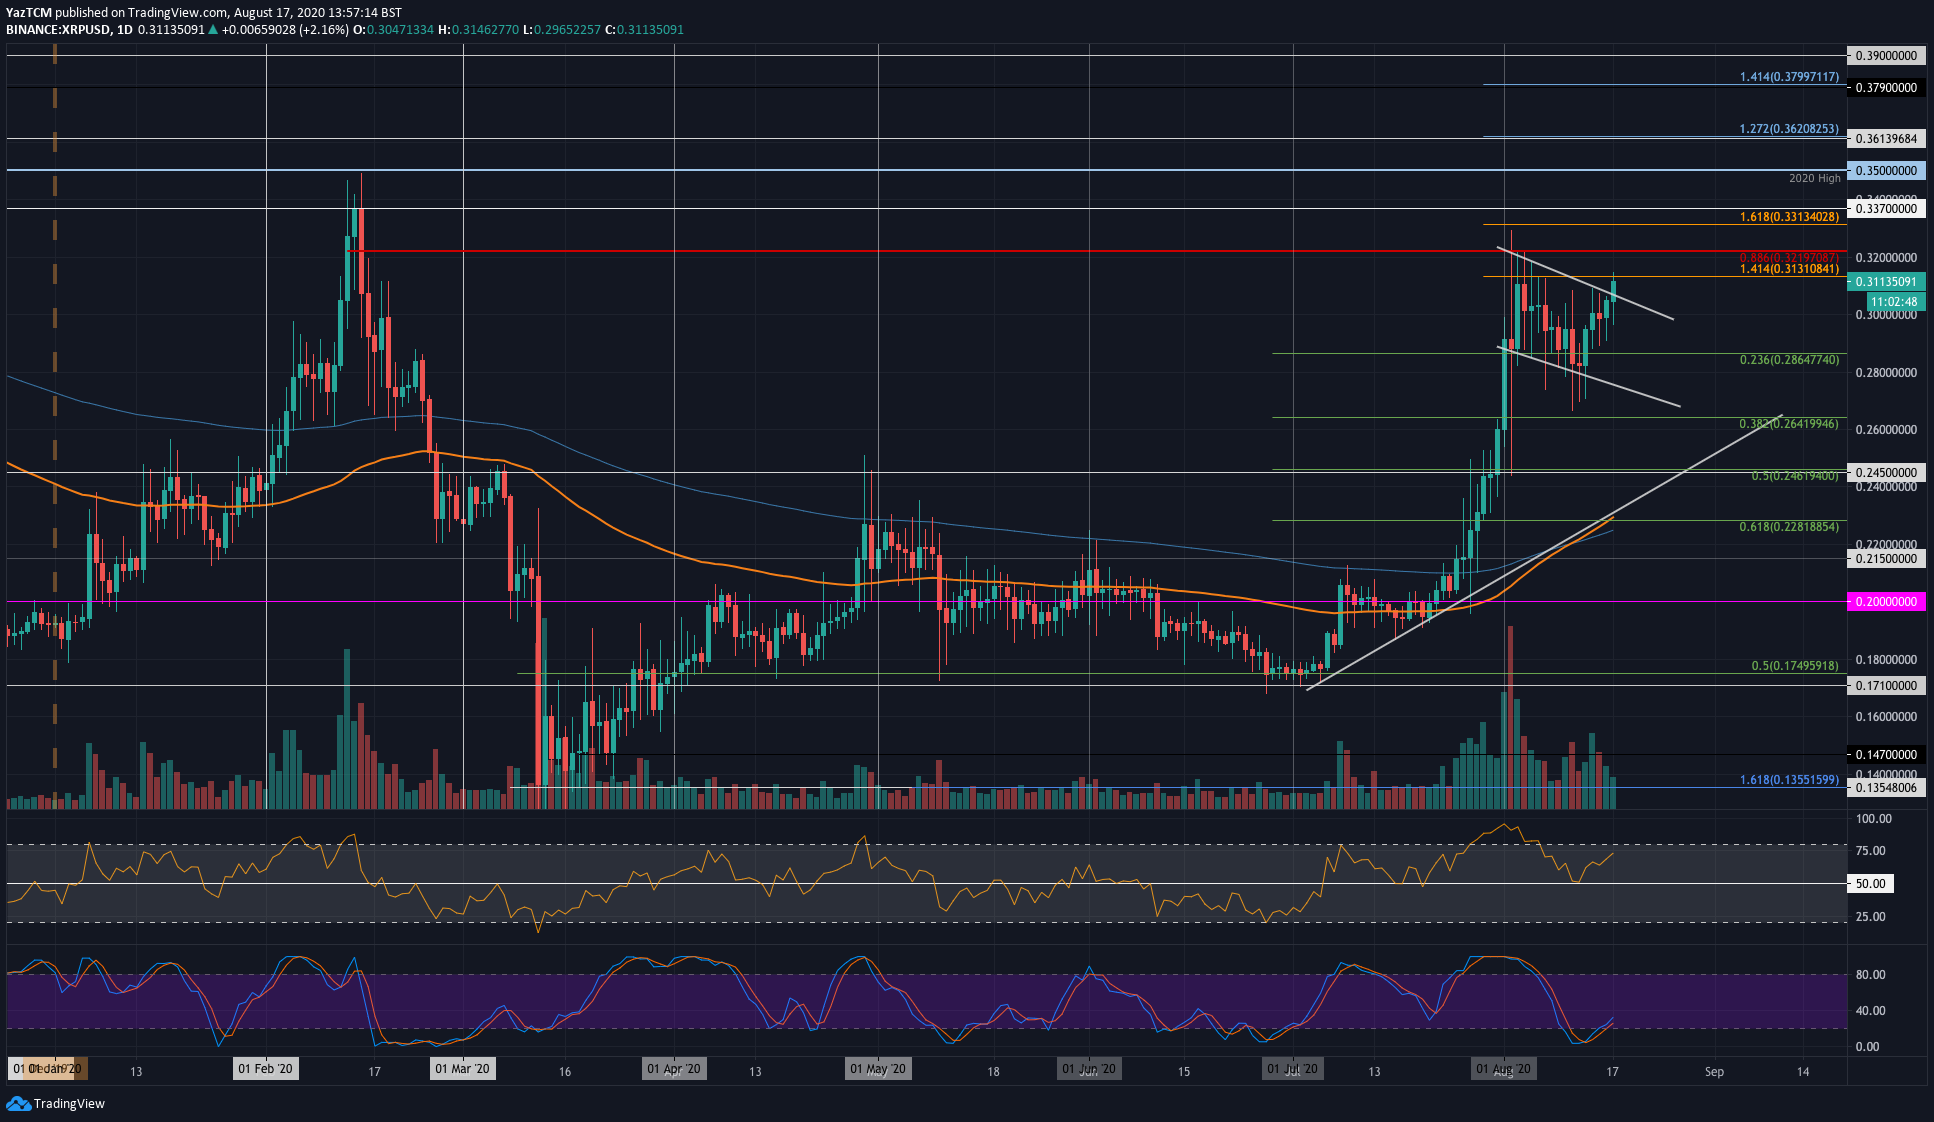
Last week XRP fell from a resistance level above $0.30 and found support at $0.28. The buyers managed to defend this level, which allowed them to push higher throughout the second half of last week.
Over the weekend, XRP pushed higher above $0.30 and managed to sustain itself above there. Interestingly, the coin started to form a bullish flag pattern. This bullish flag was broken today with the 6% price increase, sending strong bullish signals through the market.
Another indicator worthy of noting is that last week, the 100-days EMA successfully crossed above the 200-days EMA (often considered as a Golden Crossover), which is a very strong long term bullish signal.

XRP-USD Short Term Price Prediction
Looking ahead, resistance is immediately located at the current $0.313 level(1.414 Fib Extension). This is followed by added resistance at $0.321 (bearish .886 Fib Retracement), $0.331 (1.618 Fib Extension), and $0.35 (2020 High).
On the other side, the first level of strong support lies at $0.3. Beneath this, support is expected at $0.28, $0.264 (.382 Fib Retracement), and $0.25.
The RSI bounced from the mid-line last week, which indicates the bulls remain in charge of the momentum. Additionally, the Stochastic RSI had produced a bullish crossover signal that allowed the market to rebound.
XRP/BTC: XRP Bounces From .382 Fib Support
Key Support Levels: 2560 SAT, 2435 SAT, 2333 SAT.
Key Resistance Levels: 2630 SAT, 2700 SAT, 2800 SAT.
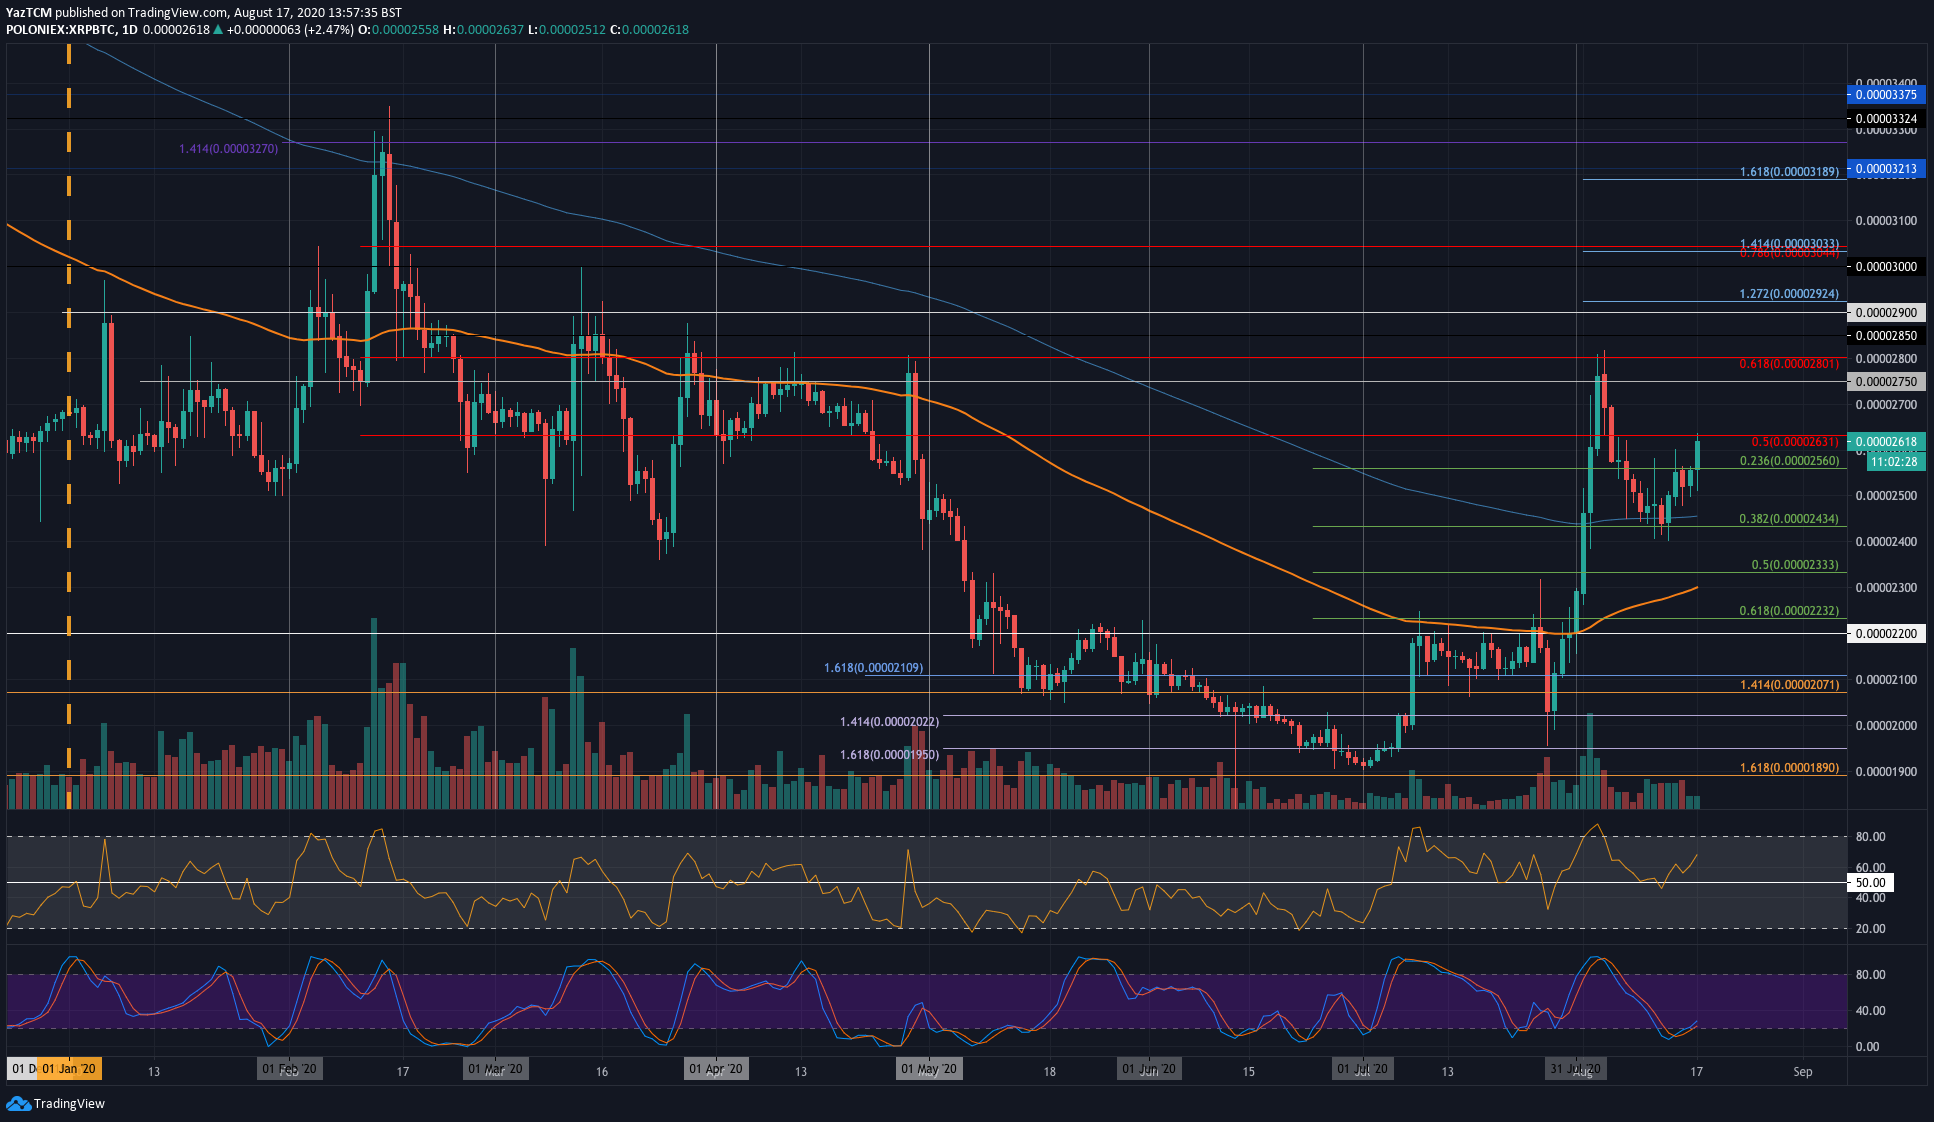
Against Bitcoin, XRP rebounded from the support at 2435 SAT (.382 Fib Retracement) last week. After bouncing, the bulls pushed higher to reach the current 2630 SAT resistance, provided by a bearish .5 Fib Retracement.
The coin surged earlier in August to reach as high as 2800 SAT (bearish .886 Fib Retracement), which is also the April 2020 high. The bulls were unable to overcome this level, which had caused XRP to head lower over the previous fortnight until the support was found at 2435 SAT.

XRP-BTC Short Term Price Prediction
Moving forward, if the buyers can overcome 2630 SAT, higher resistance lies at 2700 SAT. The next targets are at 2750 SAT, 2800 SAT (bearish .886 Fib Retracement), and 2850 SAT.
On the other side, the first level of support lies at 2560 (.236 Fib Retracement). This is followed by support at 2435 SAT (.382 Fib Retracement), 2333 SAT (.5 Fib Retracement), and 2300 SAT (100-days EMA).
Likewise, the RSI managed to bounce above the 50 level last week to indicate the bulls are unwilling to give up their control of the market momentum. The Stochastic RSI is also primed for a bullish crossover signal that has sent the market higher.
