Aayush Jindal
February 20, 2023
Altcoins, Bitcoin (BTC), Crypto news, Markets, Ripple (XRP)
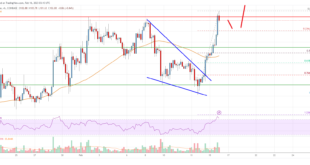
Ripple price started a fresh decline from the $0.4050 zone against the US dollar.
The price is now trading above $0.3850 and the 55 simple moving average (4-hours).
There is a key bearish trend line forming with resistance near $0.3950 on the 4-hours chart of the XRP/USD pair (data source from Bittrex).
The pair could extend losses if it stays below the $0.4050 resistance zone.
Ripple price is struggling below $0.4050 against the US Dollar, similar to bitcoin. XRP price...
Read More »
CryptoVizArt
February 19, 2023
Bitcoin (BTC), Crypto news, Ripple (XRP), Tether (USDT)
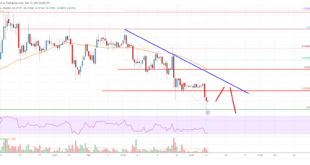
Ripple’s price action has been far from convincing lately, as the cryptocurrency has been rejected from a key resistance level against the USD. XRP is also in a downtrend on the BTC paired chart, making things worse.
Technical Analysis
By: Edris
XRP/USDT Daily Chart:
On the XRPUSDT chart’s daily timeframe, the price has been rejected from the $0.43 level multiple times and is currently oscillating between the 200-day and 50-day moving averages located around $0.395 and $0.385...
Read More »
Duo Nine
February 17, 2023
Crypto news, Ethereum (ETH), Ripple (XRP)
This week, we take a closer look at Ethereum, Ripple, Cardano, Polygon, and OKB.
Ethereum (ETH)
Ethereum had a great rally this past week but failed to break above the key resistance at $1,660. Nevertheless, the price still managed to increase by 7.4%.
the current PA shows that buyers are becoming eager, and the key resistance is being tested again and again. The more this happens, the likelier it becomes for ETH to break above and move higher.
Looking ahead, ETH has good...
Read More »
Bhushan Akolkar
February 16, 2023
Altcoins, Bitcoin (BTC), Blockchain, Crypto news, Ethereum (ETH), Markets, Ripple (XRP)
Checking if the site connection is secure
Enable JavaScript and cookies to continue
www.coinspeaker.com needs to review the security of your connection before proceeding.
Read More »
Aayush Jindal
February 16, 2023
Altcoins, Bitcoin (BTC), Crypto news, Ethereum (ETH), Litecoin (LTC), Markets, Ripple (XRP)
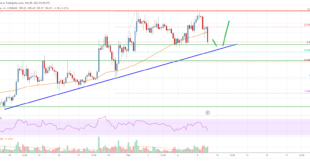
Litecoin started a steady increase above $95 against the US Dollar.
LTC price is now trading above $95 and the 55 simple moving average (4-hours).
There was a break above a key contracting triangle with resistance at $92 on the 4-hours chart of the LTC/USD pair (data feed from Coinbase).
The pair remains supported for more gains above the $100 and $105 resistance levels.
Litecoin price is showing positive signs above $95 against the US Dollar, similar to bitcoin. LTC...
Read More »
CryptoVizArt
February 14, 2023
Crypto news, Ripple (XRP)
Ripple’s price has been trapped inside a static range between $0.42 and $0.31 and is struggling to break ou. A consolidation stage within this range could be imminent as the cryptocurrency was recently rejected from a vital resistance level.
Technical Analysis
By Shayan
The Weekly Chart
Since 2021, Ripple has been declining, forming a falling wedge pattern on the weekly timeframe. Recently, the price experienced a slight plummet after being rejected from the wedge’s upper...
Read More »
Aayush Jindal
February 13, 2023
Altcoins, Bitcoin (BTC), Crypto news, Markets, Ripple (XRP)
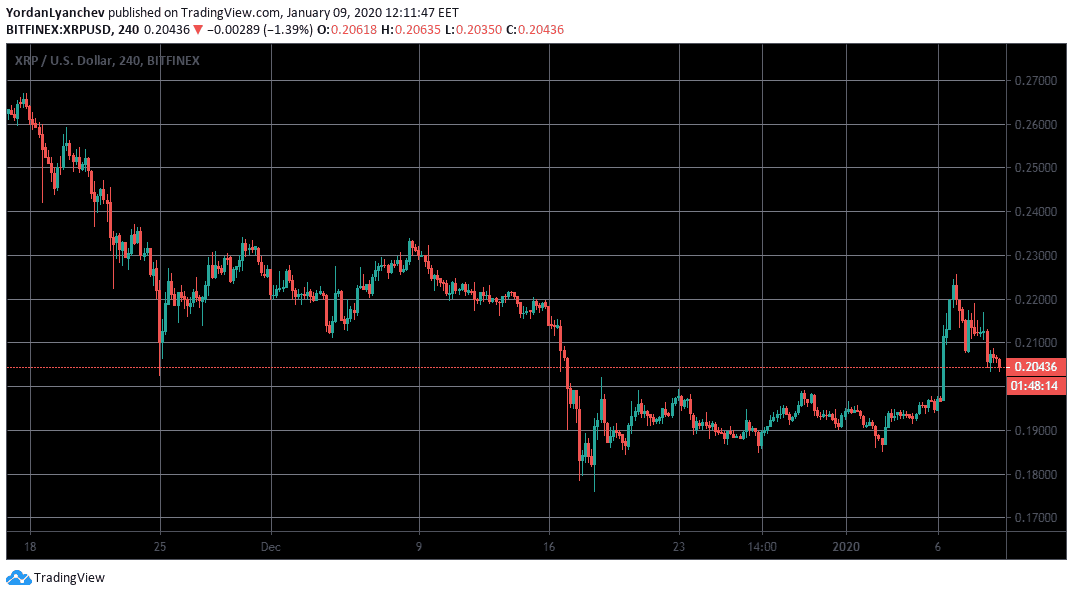
Ripple price started a fresh decline below the $0.4000 zone against the US dollar.
The price is now trading below $0.4000 and the 55 simple moving average (4-hours).
There is a key bearish trend line forming with resistance near $0.3820 on the 4-hours chart of the XRP/USD pair (data source from Bittrex).
The pair could extend losses if it stays below the $0.4000 resistance zone.
Ripple price is struggling below $0.4000 against the US Dollar, similar to bitcoin. XRP price...
Read More »
Dimitar Dzhondzhorov
February 11, 2023
Bitcoin (BTC), Crypto news, Markets, Ripple (XRP)
The Canadian University of Dubai (CUD) partnered with Binance to enable students to pay their fees in digital currencies.
With the recent collaboration, the exchange dived deeper into the local ecosystem. It received a cryptocurrency license from Dubai’s regulators in September last year.
Settling the Semesters in Crypto
The world’s leading crypto platform disclosed the partnership on its Twitter account, saying current and future students of the CUD are allowed to settle...
Read More »
Jordan Lyanchev
February 10, 2023
Blockchain, Crypto news, Ripple (XRP)
Brad Garlinghouse, the CEO of the blockchain payment company that fights the US SEC in court over the status of XRP, believes there’s a lot of positive news in terms of crypto adoption worldwide.
He made these comments following the recent crackdown from the Securities and Exchange Commission against Kraken and its crypto staking services.
Step Back and Review
Being the world’s largest economy, the actions undertaken by the US, its government, and the local regulatory bodies...
Read More »
Aayush Jindal
February 9, 2023
Altcoins, Bitcoin (BTC), Crypto news, Ethereum (ETH), Litecoin (LTC), Markets, Ripple (XRP)
Litecoin started a steady increase above $92 against the US Dollar.
LTC price is now trading below $100 and the 55 simple moving average (4-hours).
There is a key bullish trend line forming with support near $95 on the 4-hours chart of the LTC/USD pair (data feed from Coinbase).
The pair remains supported for more gains above the $100 and $105 resistance levels.
Litecoin price is correcting gains from $102 against the US Dollar, similar to bitcoin. LTC price could start...
Read More »
 Ripple (XRP)