Following the first mini-rally of 2020, Bitcoin had quickly reached our mentioned target of 00 before getting rejected.From there, the cryptocurrency saw a steep drop towards the 38.2% Fibonacci level (~50) of the last spike. As of writing these lines, Bitcoin is trading around 00 – 00 for the past hours, preparing for its next move.The turning point of Bitcoin is not a coincidence. It happened just as the uncertainty around Iran’s revenge had disappeared, as President Trump was speaking. On the contrary, Wall Street surged to new highs.In one aspect Bitcoin won: it proved its correlation to Gold, maybe as the new safe-haven asset of the new decade.So far, it looks like a healthy correction to a short-term rising trend, until proven else.Total Market Cap: 9.6 billionBitcoin
Topics:
Yuval Gov considers the following as important: Bitcoin (BTC) Price, BTCanalysis
This could be interesting, too:
Chayanika Deka writes XRP, SOL, and ADA Inclusion in US Crypto Reserve Pushes Traders on Edge
Chayanika Deka writes Why Arthur Hayes Is Bullish on Bitcoin Under Trump’s Economic Strategy
Mandy Williams writes Why the Bitcoin Market Is Stuck—and the Key Metric That Could Change It: CryptoQuant CEO
Jordan Lyanchev writes Liquidations Top 0M as Bitcoin Falls K, Reversing Trump-Driven Rally
Following the first mini-rally of 2020, Bitcoin had quickly reached our mentioned target of $8400 before getting rejected.
From there, the cryptocurrency saw a steep drop towards the 38.2% Fibonacci level (~$7850) of the last spike. As of writing these lines, Bitcoin is trading around $7900 – $8000 for the past hours, preparing for its next move.
The turning point of Bitcoin is not a coincidence. It happened just as the uncertainty around Iran’s revenge had disappeared, as President Trump was speaking. On the contrary, Wall Street surged to new highs.
In one aspect Bitcoin won: it proved its correlation to Gold, maybe as the new safe-haven asset of the new decade.
So far, it looks like a healthy correction to a short-term rising trend, until proven else.
Total Market Cap: $209.6 billion
Bitcoin Market Cap: $144.1 billion
BTC Dominance Index: 68.7%
*Data by CoinGecko
Key Levels To Watch & Next Targets
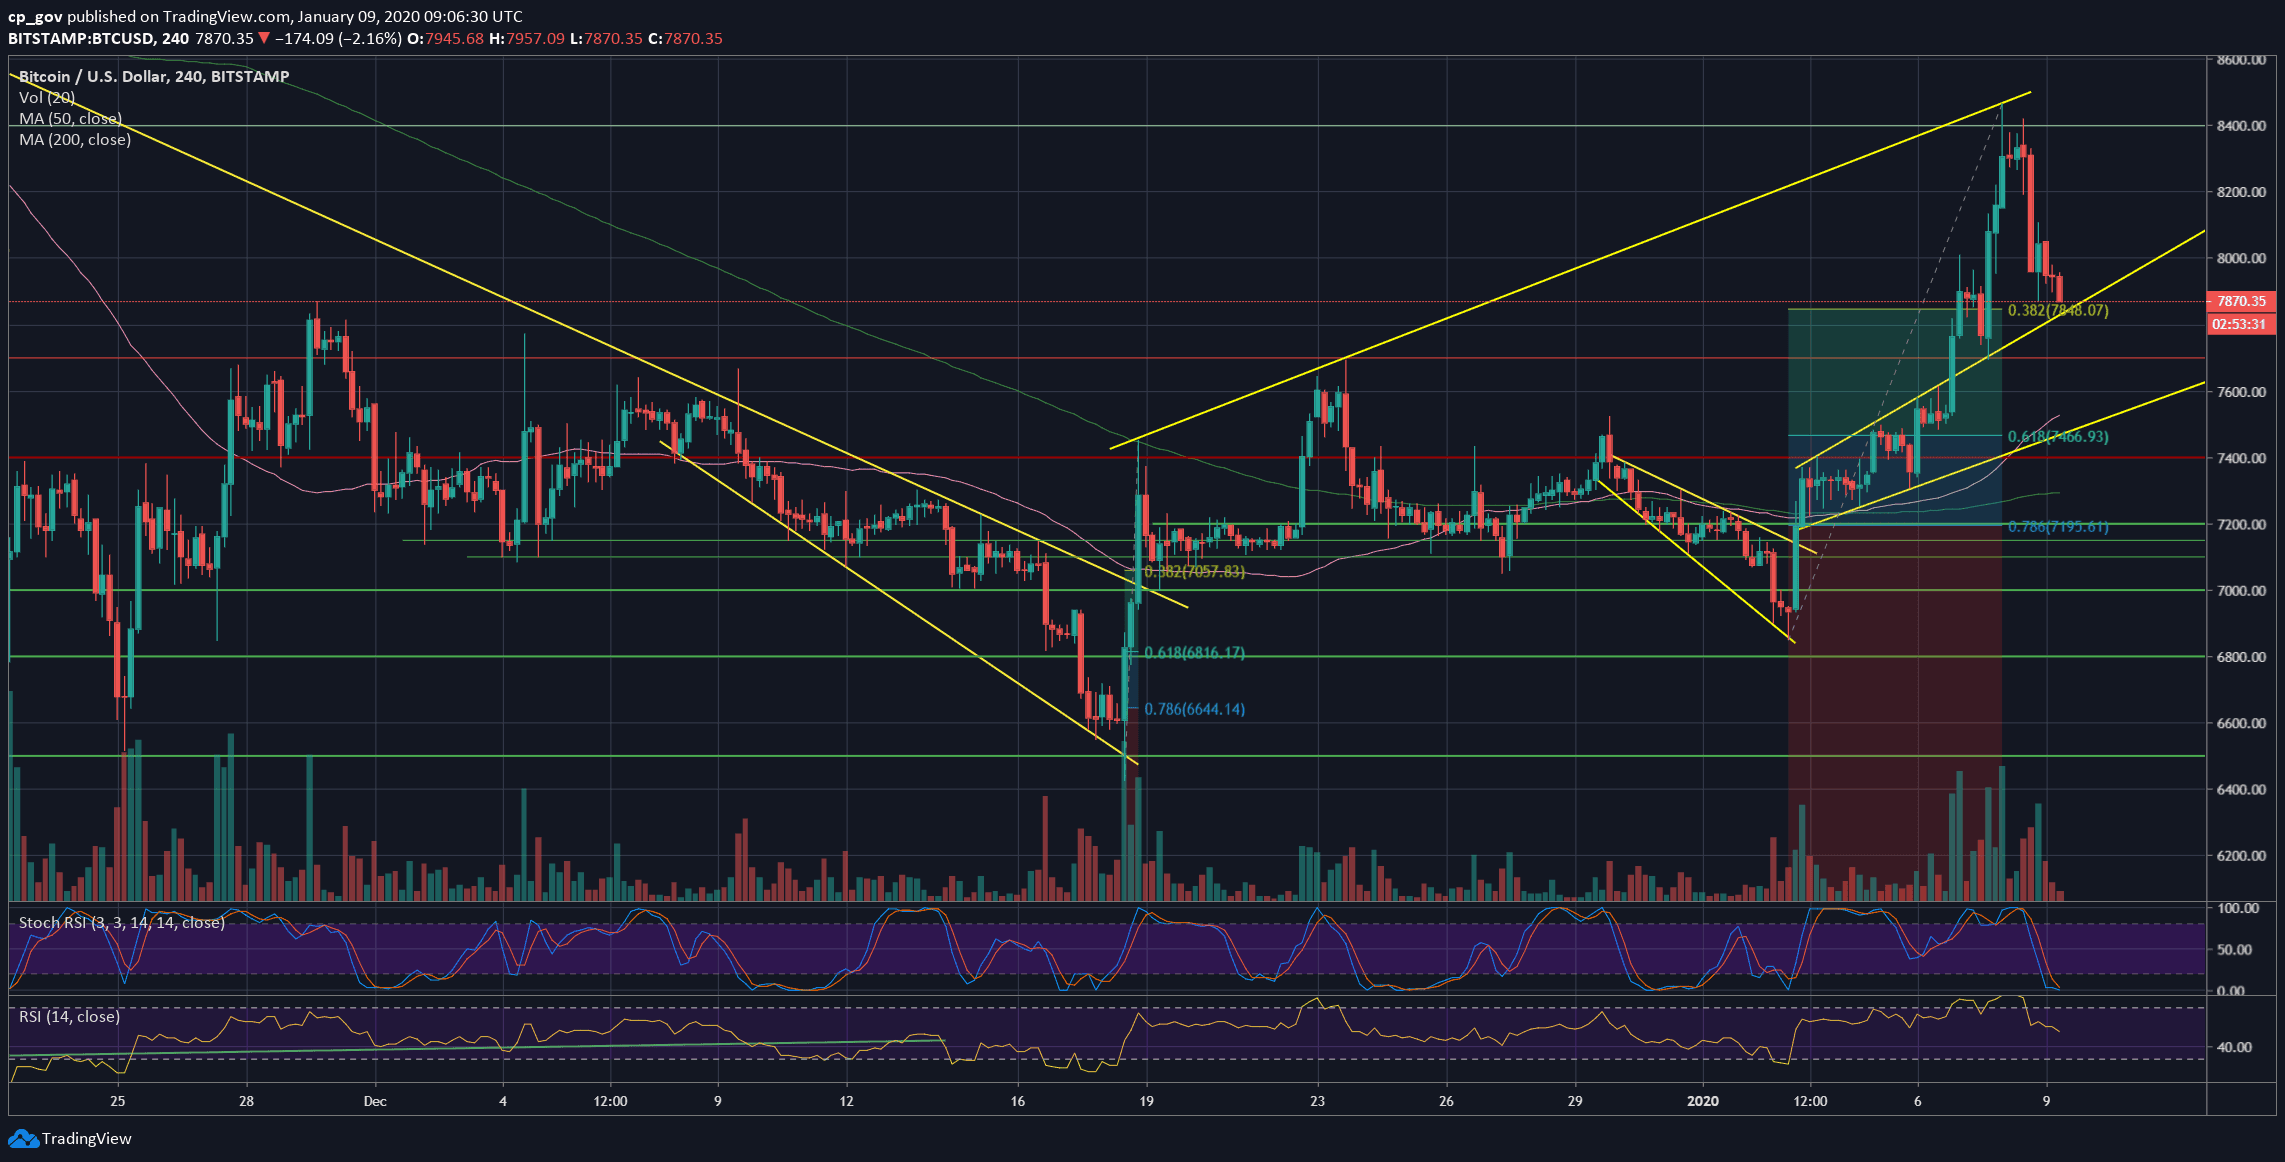
– Support/Resistance levels: Following yesterday’s blow-off top, Bitcoin is now facing $7850 as the first level of support. This is the 38.2% Fib level, together with an ascending trend-line on the 4-hour chart.
The next level lies at $7700 old resistance turned support (along with the mid-term descending trend-line. While further support lies at $7466 (the 61.8% Fib retracement level), and $7300 – $7400.
From above, $8000 had become resistance once again. In case of a breakout, then yesterday’s high would be the next level of resistance – $8400. Further resistance lies at $8600 and $8800.
– The RSI Indicator: The momentum was real. The RSI almost reached the 70 levels, and anyways, it was the highest RSI level over the past six months.
One bearish sign might be coming on behalf of the Stochastic RSI oscillator: The last had gone through a bearish crossover and is about to enter the neutral territory.
– Trading volume: Finally some volume. The past two days were the highest volume days of the past 30 days. Still, not the volume levels of June and July 2019, but this is improving.
BTC/USD BitStamp 4-Hour Chart
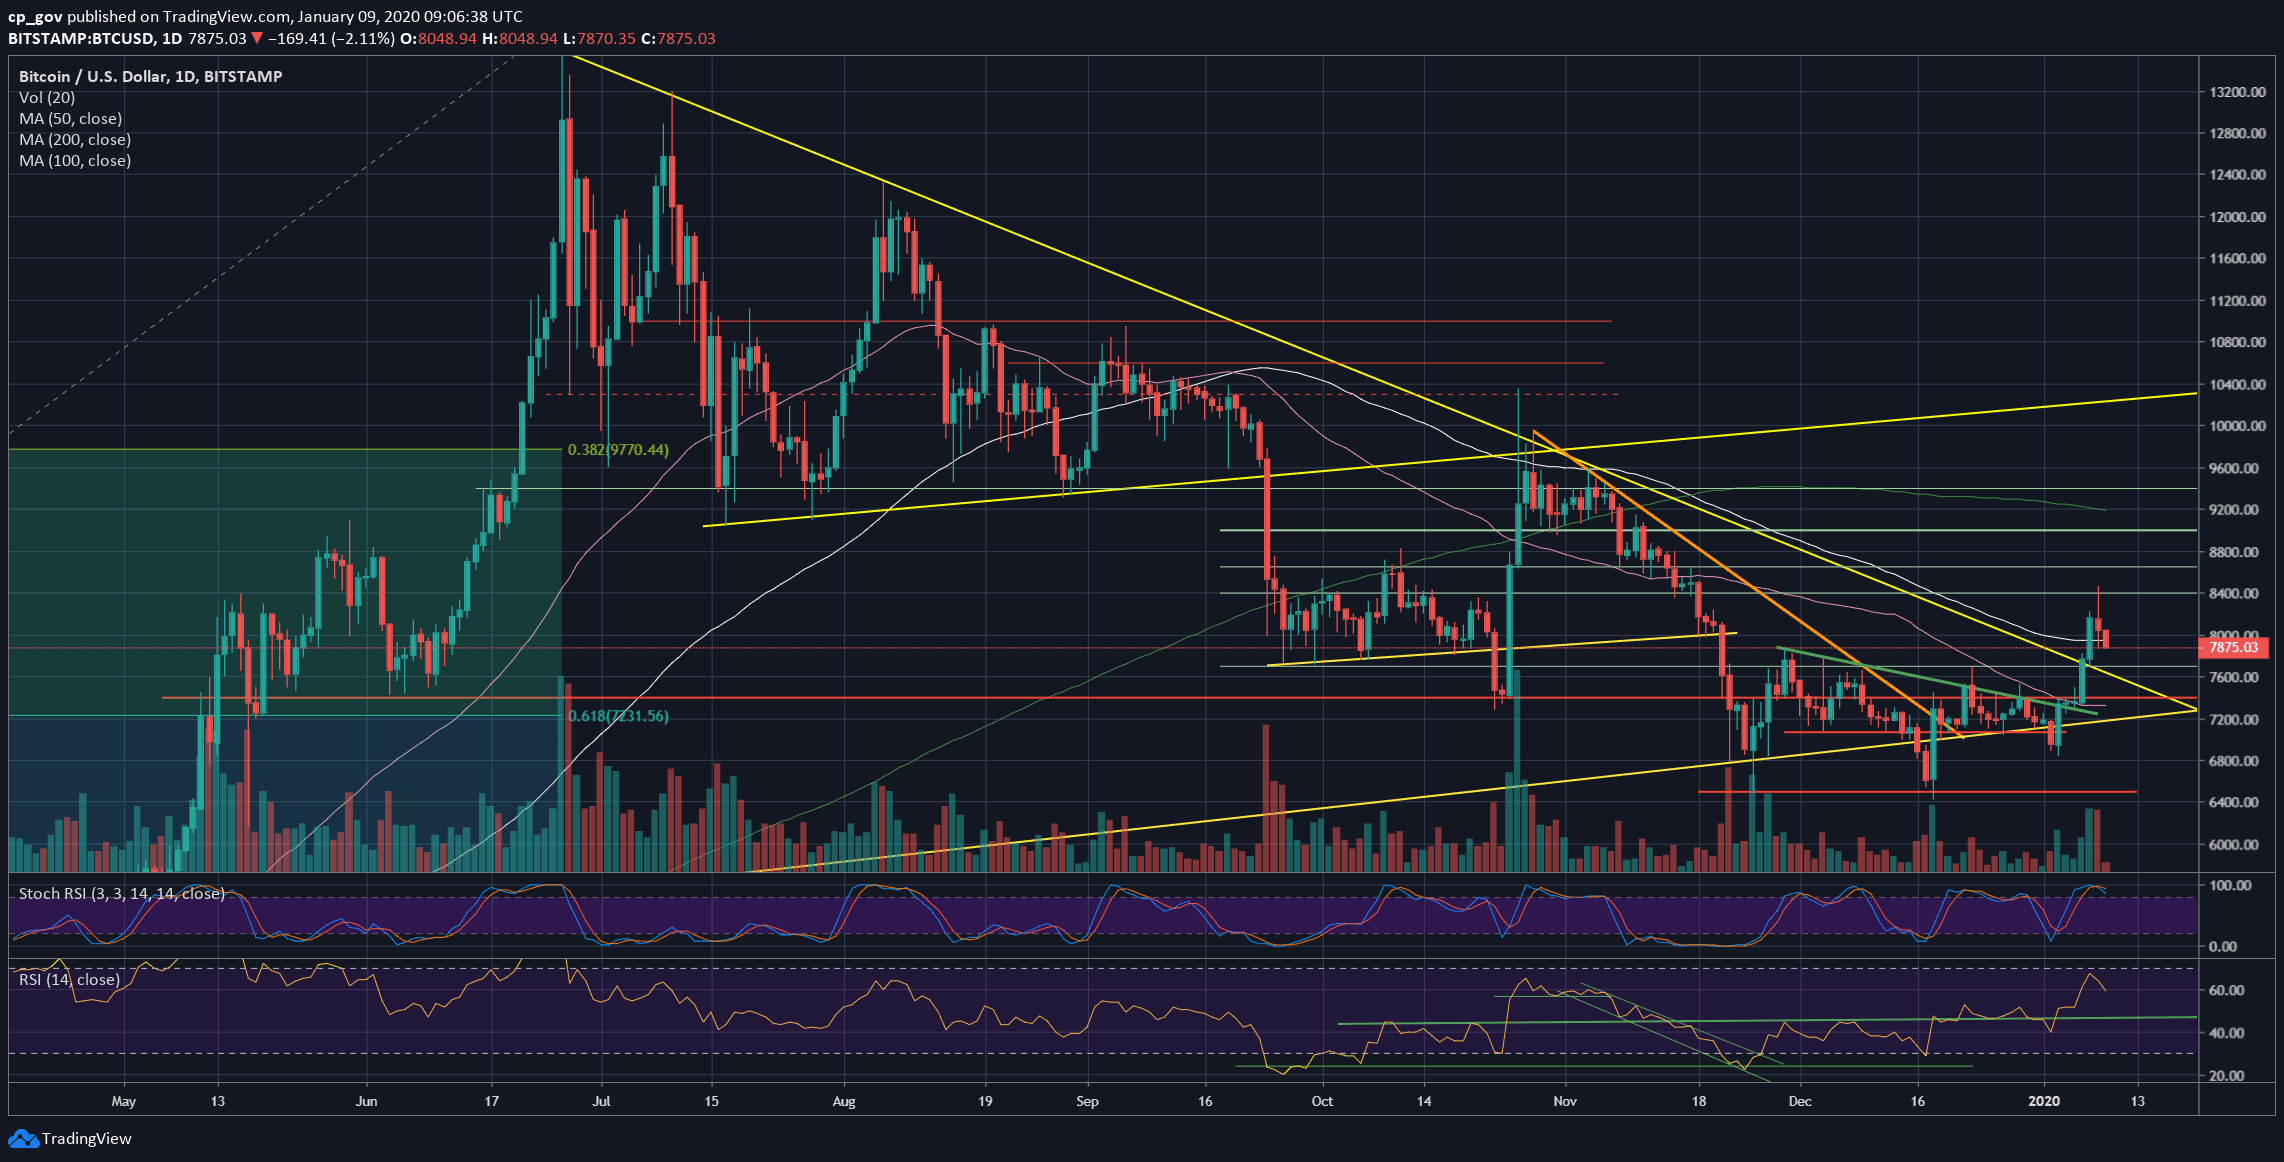
BTC/USD BitStamp 1-Day Chart