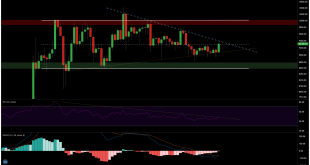
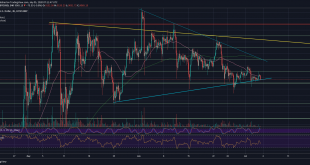
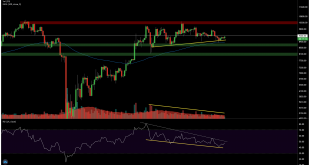
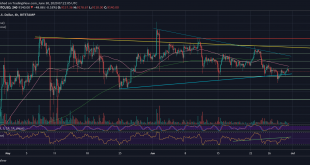
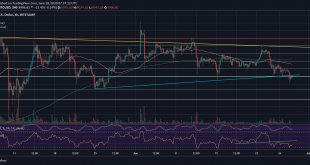
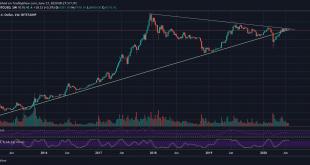
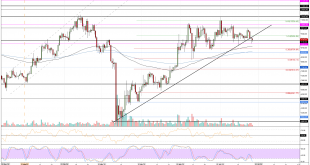
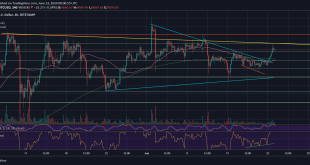
A close above the critical level of $9,300 on today’s daily candle would put the primary cryptocurrency in an excellent position for another retest of the main psychological barrier at $10,000 (but hey, there is some resistance in between!).There is likely to be a lot of intense selling pressure at this point, however, as this particular level has already forced back two breakout attempts in the last ten days (see the 4-hour chart below).The $9,300 resistance will need considerable volume to...
Read More »Bitcoin Price Analysis: BTC Anticipates Huge Upcoming Move To End This Uncommon Stability
For the past ten days, the Bitcoin price was trading mostly inside a $200 range between $9000 and $9200.This behavior is very uncommon to a volatile asset such as Bitcoin. Some technical signs point on an end to this saga very soon, probably as the new week starts.Bitcoin Recent Price ActionAs can be seen on the following 4-hour chart, Bitcoin is trading inside a symmetrical triangle pattern.While yesterday BTC was about to break it down from its lowest angle, Bitcoin found support and...
Read More »Bitcoin Price Analysis: BTC Plunges $300 in 2 Hours, Here’s Why
Bitcoin bears appear to have come out of hibernation today. According to the latest data from Glassnode, Bitcoin hourly addresses hit a 2-year high today and hourly active addresses set at a new yearly high.While these figures might sound promising, they have coincided with a steep $300 crash in Bitcoin’s price over a 2.5 hour period. So far, the leading crypto’s market cap has fallen by over $4 billion over the past several hours.Bitcoin Price Levels to Watch in the Short-termBTC/USD 4-hour...
Read More »Bitcoin Price Analysis: BTC Bears Eye $8,600 As RSI Divergence Grows
On the 1D BTC/USD chart, we can see that the leading crypto-asset remains range-bound between the daily $8,600 and $10,000 levels.Rumors earlier in the week regarding PayPal possibly adding support for Bitcoin and other cryptocurrencies on its platform, sparked a small rally but failed to fuel a much-needed breakout above a key resistance level at $9,780.The pump was subsequently followed by a sharp sell-off below the previous weekly open at $9,300 (white line on the following chart), which...
Read More »Bitcoin Price Analysis: The Worrying Sign That Can Send BTC To New Lows Very Soon
During the past two days, the Bitcoin price was trading under a tight range between $9000 and $9200.This untypical stability by Bitcoin is just showing how indecisive the primary cryptocurrency is. What is for sure is that a wild price move is likely to take place over the next few days.Following the Saturday’s price plunge, reaching out to a new 30-days low, we expected a price pullback. On our recent price analysis, we predicted such pull-back, telling by the oversold RSI levels and the...
Read More »Bitcoin Price Analysis: Crucial Battle Over $9000 – Here Are The Good and The Bad News
So far, this weekend hadn’t been the best for the price of Bitcoin. The primary cryptocurrency recorded its lowest level over the last 30 days.Trading for $9800 just six days ago, Bitcoin dropped as of yesterday to nearly $8800 on most leading exchanges.The Good and The Bad NewsAs of writing these lines, Bitcoin is trading around the $9K mark, mostly below it. From a technical point of view, a strong support level that got broken down immediately becomes a huge resistance level.As can be seen...
Read More »Bitcoin Price Analysis: Will The 2015 Historic Support Line Save BTC From a Crash To $7000 – $8000?
Only five days ago, the price of Bitcoin touched $9800, followed by another failure to break up the critical descending trend-line (marked yellow on the following daily chart).Since then, the primary cryptocurrency had been correlating with the plunging global markets, and as of writing these lines, Bitcoin is trading slightly above $9000.The Micro and Macro LevelIf we look at the micro-level, which is the following 4-hour chart, we can see that Bitcoin so-far holds the supporting blue line....
Read More »Crypto Price Analysis & Overview June 26th: Bitcoin, Ethereum, Ripple, Aave, and Nexo
BitcoinBitcoin witnessed a 1.5% price decline over the past week as the cryptocurrency drops into the $9,190 level. The coin was trading at this price at the start of the week as it managed to push higher into the $9,815 level. BTC was unable to overcome this resistance, which caused it to fall back into $9,190.The crucial thing about this week’s price drop is the fact that BTC looks like it broke beneath a rising trend line that has been in play since mid-March 2020. If BTC continues beneath...
Read More »Bitcoin Price Analysis: BTC’s Plunge To $9000 On Markets Collapse – Now This Level Becomes The Most Critical
Two days ago, when everyone was bullish watching Bitcoin’s astonishing move breaking above the $9400 towards the $9800 in a matter of hours, we mentioned the importance of the $9800 level.That level created another touch in the descending trend-line, which is marked yellow on both charts below. This was the ninth (!) attempt to break that tough resistance. Guess what? Nine attempts – zero success (aside from the fake-out on June 1st).When you don’t score, the other team will. And when Bitcoin...
Read More »Bitcoin Price Analysis: Now Comes The Line BTC Had Failed To Break 9 Times Already
A quick recap: over the past week, we mentioned the dull static price action of Bitcoin between the tight range of $9200 to $9500, forming a 30-days long symmetrical triangle.As we anticipated a breakout of the triangle – that will be followed by a massive price move – yesterday it did happen. Bitcoin price broke the triangle’s upper boundary, along with the $9400 level (along with the MA-50 line), surpassing the next resistance at $9600 – touching $9800 along with the yellow-marked...
Read More » Crypto EcoBlog

