$7 billion has exited from the global crypto market in the last 12 hours, leaving a vast majority of token projects, including Bitcoin, in the red today.Right now, the total market capital stands at around $330 billion, according to Coingecko data. During the early Asian trading session this morning, there was an exodus of $5 billion in less than an hour, but it’s still uncertain why this drop has occurred.Is this an early sign that bitcoin sentiment is turning bearish?Bitcoin...
Read More »Bitcoin Price Analysis: How High Can BTC Go After the $10K Breakout?
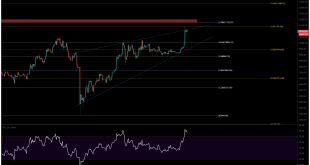
Bitcoin bulls appear to be resting right now after ricocheting off a major Fibonacci resistance at $11,390 (yellow Fibonacci levels on the daily chart). This is the first time this level has been testing in almost a year and is one of the major hurdles standing in the way of BTC prices breaking above the psychological $12,000 mark. On the 1-Hour BTC/USD Bitstamp chart, we can see that up-trending momentum has stalled. Could this an early sign of a bearish reversal, or are bulls just...
Read More »Bitcoin Price Analysis: BTC Now At Crucial Resistance – $9,200 Or $10K Next?
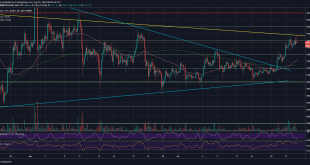
Quick recap: after almost a month of dull price action around the $9200 mark, Bitcoin finally managed to break out.Last Tuesday, we saw a mini-rally in BTC, while the price went up to the next marked resistance at the descending yellow line (shown on both charts below), which is also the $9650 resistance – mentioned in our previous price analysis from the past days.Two great signs for the crypto ecosystem following the mini-rally: first, the total crypto market cap went up together with...
Read More »Crypto Price Analysis & Overview July 24th: Bitcoin, Ethereum, Ripple, DigiByte, and Augur
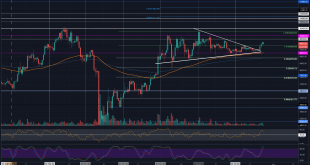
BitcoinBitcoin saw a strong 4% price rise this week, which saw it hit the $9,500 level. The cryptocurrency started the week by trading at the lower boundary of a symmetrical triangle near the $9,000 support region. From there, it rebounded higher, which allowed Bitcoin to break above the triangle and exit the previous phase of consolidation.This positive breakout now puts Bitcoin on the bullish trajectory as it sets its sights towards the $10,000 level again.Looking ahead, the first two...
Read More »Bitcoin Price Analysis: BTC to $8K Or $10K? That’s the Question Following Zero Volatility
Today, BTC/USD price appears to have reached maximum consolidation between two long-standing trend lines (see daily chart below). Volatility has also continued to diminish further over the weekend, with the Bollinger bandwidth now at 0.1 on the 4-Hour chart.These two factors suggest that a major move could take place over the course of today’s trading session. But which way will Bitcoin break out?The TechnicalsOn the 4-Hour BTC/USD chart, we can see that the current price action is tracking...
Read More »Bitcoin Price Analysis: Bulls Battle For $9000, Bloody Weekend Incoming?
Bitcoin is looking a bit worse for wear right now.Bearish traders have finally succeeded in overcoming the long-standing up-trending support (yellow line) that was first established on May 11, and we now have three red candles in a row on the daily BTC/USD chart for the first time since late June.During today’s trading session, we can see that bullish traders are now fighting desperately to keep the $9,100 level in play. However, the up-trending support is currently acting as a strong...
Read More »Bitcoin Price Analysis: Low Volatility Has Everyone Scared, Crash Inbound?
If you’ve been paying attention to Bitcoin’s chart against the US Dollar lately, you will have probably noticed how low BTC/USD trading volatility has been over the last three months. In fact, the leading cryptocurrency has been trading in a tight range of 3±% since June 2.This, coupled with the fact that the Bollinger bandwidth has constricted to its lowest value since November 2018, has caused a lot of people to panic that a serious crash is coming Bitcoin’s way soon.Bitcoin Price Levels to...
Read More »Bitcoin Price Analysis: 3 Reasons Why A Wild BTC Move Is Anticipated Very Soon
Unlike Bitcoin’s stability, the altcoins are celebrating in their own party. Bitcoin dominance recently reached its yearly-low areas after dropping below 62.5% over the past few hours.Wild Move Upcoming?From a technical point of view, Bitcoin’s stability period like this usually ends with a wild move. The indicator we mainly use to measure volatility is the Bollinger Bands.Those are the three lines following the price action’s candlesticks on the following daily chart. Whenever the upper and...
Read More »Bitcoin Price Analysis: BTC Plunges $250 Following Another Bart, Is $9000 Incoming?
Bitcoin was looking promising to take on the $9,500 level yesterday after finally breaking above a critical down-trending resistance.Unfortunately, the breakout was nothing more than an orchestrated trading strategy used commonly by Bitcoin whales to shake out retail traders and likely accumulate more BTC.And it worked.The Bitcoin-Bashing Bart Simpson PatternWhenever there’s low liquidity, Whale traders need to create volume in order to place large sell orders and reduce slippage as much as...
Read More »Bitcoin Price Analysis: BTC Breaking Above 45-Days Resistance Line, Will Altcoins Calm Down?
As mentioned in the last analysis, we anticipated the down-trending level (blue line) would create some resistance for bullish traders, and after five failed attempts, they finally succeeded in breaking through it.Right now (as of writing these lines), BTC prices have jumped $175 in the last hour, and for the first time since January 2020, a bullish convergence has appeared on the monthly MACD.Bitcoin Price Levels to Watch in the Short-termDepending on the strength of the current breakout, we...
Read More » Crypto EcoBlog

