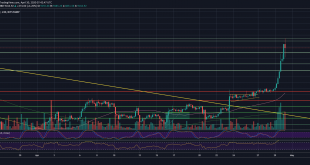
As we are getting closer to the halving event, Bitcoin is likely to mark its third consecutive green day, where the primary cryptocurrency had increased more than $1000 over the past four days. As of writing these lines, it seems like $10K will come in a matter of hours.If you had followed our price analysis from yesterday, we had mentioned a symmetrical triangle formation on Bitcoin’s 4-hour chart, and also stated that the triangle is likely to break out in the next few hours.As can be seen...
Read More »Bitcoin Price Analysis: The Triangle Formation Can Send BTC To $10K Or $8K, Breakout Soon? (UPDATED)
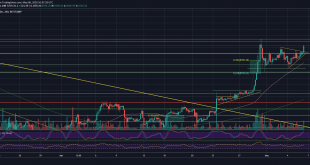
Over the past two days, Bitcoin price seems to be consolidated in a triangle pattern, as can be seen below on the following shorter timeframe chart (the 4-hour).The symmetrical triangle consolidates around the $9000 benchmark, where its apex is anticipated somewhere in the next day. However, as we learned before, Bitcoin might break of the pattern even before reaching the apex.Overall, there is an ongoing ‘fight’ between the buyers and the sellers that will get even more exciting as we are...
Read More »Bitcoin Tests Historical Support Line From 2015: A Breakdown Might Lead To Huge Dump Before Halving (BTC Price Analysis)
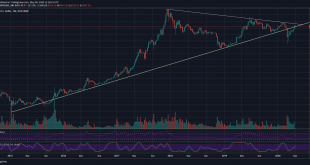
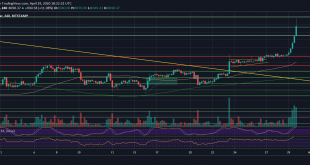
After reaching over $9400 a few days ago, the Bitcoin price corrected down to the Golden Fibonacci level at $8400, and since then, BTC is trading mostly around the $8600 price range.As can be seen on the following 4-hour chart, there is a lower highs trajectory on the short-term timeframe, getting closer to the crucial $8400 support, which is the low from Thursday, the correction after the huge Wednesday’s rally.The Weekly Timeframe Since 2015This is an excellent opportunity to look at the...
Read More »Bitcoin Price Analysis: BTC Is Trading Sideways Since Yesterday, Huge Weekend Move Upcoming?
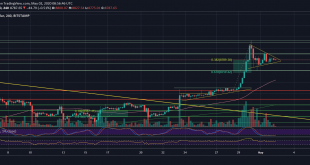
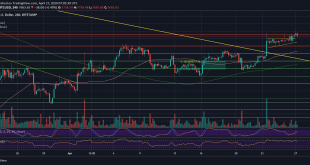
This past week was a blessing for the price of Bitcoin. The primary cryptocurrency was trading around $7500 just a week ago, while the highest of the past week reached over $9400.Only ten days left until the anticipated Bitcoin halving event, and so far, it seems like BTC fires its engines. As of writing these lines, the coin is safely maintaining the $8800 price zone.If we look at the macro level, since breaking out from the $7800 – $8000 region, a zone which was consisted of some...
Read More »Crypto Price Analysis & Overview May 1st: Bitcoin, Ethereum, Ripple, Stellar, and Chainlink
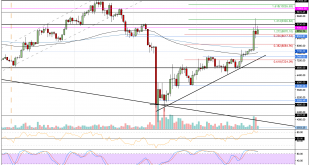
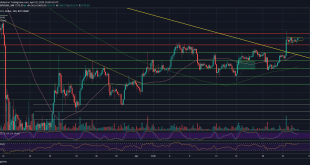
BitcoinBitcoin saw an impressive 17.5% price increase over the past 7-days of trading as the cryptocurrency managed to climb above the $7,500 resistance to break above $8,000. It continued to push higher and eventually reached a weekly high of $9,430 before dropping to the current resistance at $8,870 (1.272 Fib Extension).This price increase is not surprising because the Bitcoin block halving event is just a short 10-days away.If the buyers continue to push above the current $8,870 level,...
Read More »Bitcoin Price Analysis: BTC Refuses To Calm Down Following Daily 20% Gains, How Close Is $10,000?
The last day will not surprise those who are following CryptoPotato since 2016, or those of you who had witnessed at least one real Bitcoin bull-run.When the primary currency decides to turn on its engines – it does it faster than any other asset existing on Earth, or on the blockchain. Bitcoin is now fully recovered from the COVID-19 damage, long before the stock markets.This is the advantage of being a free market’s asset. The same advantage that caused Bitcoin to sink over 50% on March 12...
Read More »Bitcoin Just Reached $9K: 150% and Recovery Since March 12 Collapse – BTC Price Analysis (UPDATED)
For those of you who are trading crypto for a few years, it will not be a surprise. While Bitcoin saw its worst day during March 12, 2020, resulting in more than 50% intra-day loss, it felt like a matter of time until Bitcoin will make its pave back to $8K – the price it was at before the collapse.Just an hour ago, Bitcoin did it: It took a little more than 1.5 months, but Bitcoin captured the $8,000 once again. 120% ROI.As we have seen in our previous price analysis, the bullish momentum was...
Read More »Bitcoin Just Made a Fresh April High, But Still Facing Its Real Major Test: BTC Price Analysis & Overview
Bitcoin starts the week following a bullish weekend. Just as anticipated, Bitcoin broke above the $7600 to a new price high since the devastating collapse on March 12. As of writing these lines, Bitcoin marks $7800 (Bitstamp) as the new high.Following our previous BTC analysis from Saturday, we can see that Bitcoin broke above the 4-hour chart’s marked triangle (at $7600) and quickly reached the prior high of $7750, and even created a fresh high.The bullish momentum is seeing back-winds from...
Read More »Bitcoin Price Analysis: BTC’s Bullish Formation Might Reach $8,000 Quicker Than Expected
What a recovery. Bitcoin is only a few steps away from a full recovery since the March 12 collapse, which took place only six weeks ago and saw Bitcoin plunging to $3600 (BitMEX).The primary cryptocurrency had recently broken above at $7230. On the following 4-hour chart you can notice the mid-term descending trend-line’s breakout.Following the break, the 4-hour candle had wicked at $7750 (!), which was our highest mentioned target on our most recent price analysis.Despite the wick, we can...
Read More »Crypto Price Analysis & Overview April 24th: Bitcoin, Ethereum, Ripple, Tezos, and Cardano

BitcoinBitcoin went through a 6.23% price hike over the past seven days of trading as the cryptocurrency managed to push to a fresh April high at $7,700. The coin met resistance at $7,200 last week, which caused it to drop beneath $7,000 at the start of this week. It went on to find support at $6,800, where it rebounded.On the rebound, Bitcoin took out resistance at $7,000, $7,200, and $7,400 as it spiked as high as $7,780. It since dropped to the current $7,500 level, where it faces...
Read More »