Duo Nine
February 3, 2023
Altcoins, Crypto news, Ethereum (ETH), Ripple (XRP)
This week, we take a closer look at Ethereum, Ripple, Cardano, Polygon, and Fantom.
Ethereum (ETH)
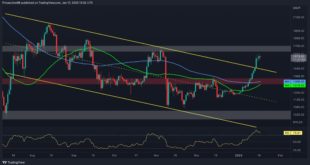
Ethereum, the second-largest cryptocurrency, continued to consolidate this week. The price only registered a 2.9% increase. This is because ETH is stuck in a channel between $1,670 and $1,550.
All attempts to break these levels were rejected in the past two weeks. While some altcoins were booking double digits gains (see Fantom below), Ethereum appears to be on a pause. This...
Read More »
CryptoVizArt
January 24, 2023
Crypto news, Ethereum (ETH)
Ethereum’s price has been on the rise for quite a while now after breaking above the $1300 resistance level. While the positive trend remains on higher timeframes, some signs are suggesting that at least a short-term correction is quite probable.
Technical Analysis
By: Edris
The Daily Chart
On the daily timeframe, the price is constantly climbing higher and could reach the $1800 level soon. However, a short-term pullback seems imminent as the RSI indicator has been in...
Read More »
CryptoVizArt
January 20, 2023
Crypto news, Ethereum (ETH), Markets
Ethereum’s price surge has seemingly halted after rallying over the past couple of weeks. With multiple key resistance levels broken, the market seems likely to enter a bullish phase. However, some warning signals are emerging.
Technical Analysis
By: Edris
The Daily Chart:
On the daily timeframe, the price has broken past the $1300 resistance level, and the 200-day moving average is around the $1400 mark. Yet, bullish momentum has been fading recently, making a bearish...
Read More »
CryptoVizArt
January 17, 2023
Crypto news, Ethereum (ETH)
Ethereum’s price has printed a substantial increase and finally surpassed the channel’s upper boundary. In spite of this, the cryptocurrency is approaching a critical resistance zone, and if a breakout occurs, an impulsive uptrend would become more likely.
Technical Analysis
By Shayan
The Daily Chart
Ethereum’s price has experienced an uptrend since breaking above the 50 and 100-day moving average lines and has currently reached the $1.6K critical resistance zone.
This price...
Read More »
CryptoVizArt
January 11, 2023
Crypto news, Ethereum (ETH), Markets
Ethereum’s price is on the verge of breaking out from a significant resistance level after testing it for quite a while. However, there are still some obstacles for the price to overcome in order for a new bullish phase to begin.
Technical Analysis
By: Edris
The Daily Chart
On the daily timeframe, the price is breaking above the key $1300 resistance level after finally surpassing the 50-day moving average. In case of a bullish breakout, the 200-day moving average found at...
Read More »
Duo Nine
January 6, 2023
Crypto news, Ethereum (ETH), Litecoin (LTC), Ripple (XRP)
This week, we take a closer look at Ethereum, Ripple, Cardano, Litecoin, and Solana
Ethereum (ETH)
This Wednesday, the bulls took over the price action and pushed ETH all the way to the key resistance at $1,260. Since then, the price seemed unable to break above. Nevertheless, Ethereum still managed to book a 3.8% increase in the past seven days.
The fact that in the past two days, the price has been rather timid in pulling back from this most recent rally suggests that...
Read More »
CryptoVizArt
January 3, 2023
Crypto news, Ethereum (ETH), Markets
Ethereum’s price has been oscillating in a very tight range over the past couple of weeks as the markets were heading into the new year’s holidays. However, a decisive move may be on the horizon, as the cryptocurrency now resides in a critical area.
Technical Analysis
By: Edris
The Daily Chart:
On the daily chart, the price has been testing a significant resistance level recently, where the $1250 zone and the 50-day moving average have a confluence.
While the market is yet to...
Read More »
Duo Nine
December 30, 2022
Crypto news, Ethereum (ETH), Ripple (XRP)
This week, we take a closer look at Ethereum, Ripple, Cardano, Polygon, and Solana
Ethereum (ETH)
Another week has passed with little excitement for Ethereum investors as volatility was low – likely due to the Christmas holidays. However, ETH’s price did fall by 2% in the past seven days. This is a negligible move in the price, which still remains in a flat trend.
This cryptocurrency remains stuck between the key support at $1,160 and the resistance at $1,240. This channel is...
Read More »
CryptoVizArt
December 30, 2022
Crypto news, Ethereum (ETH)
It has been 51 days since Ethereum experienced a significant crash and dropped to a new yearly low of $1.1K. Meanwhile, the price has been stuck in a price range between $1.1K and $1.3K. Further consolidation in the mentioned range would be the most likely scenario in the upcoming days.
Technical Analysis
By Shayan
The Daily Chart
Ethereum faces a critical price zone consisting of the 50-day moving average as a resistance and the multi-month channel’s middle level as a...
Read More »
CryptoVizArt
December 26, 2022
Crypto news, Ethereum (ETH)
Over the past few weeks, we saw a mini-rally that was initiated at the wedge’s lower boundary (shown below); however, Ethereum’s uptrend was halted by the 50-day moving average line significant resistance level. Since the rejection, ETH has seen consolidation in a very tight range. Another bearish leg might soon start unless the price breaks above $1236.
Technical Analysis
By Shayan
The Daily Chart
After a sudden crash below the static support level of $1300, the price has...
Read More »