Today we got another reminder that volatility is working both ways.Bitcoin has fabulous times since entering the new decade. However, when we see such a parabolic move to the upside, we can expect volatile moves to the other side, as well.Just yesterday, we mentioned Bitcoin price reaching its first major test – the 200-days moving average line (marked light green on the following chart). Many analysts see this tough resistance as the barrier between Bear and Bull markets.Today, Bitcoin surpassed the crucial moving average line (roughly around 60). However, shortly after recording a daily high (and year to date) at 88 (Bitstamp), we received a MEGA dump.Besides, on the 4-hour chart, we can clearly see Bitcoin reaching the top area of the marked ascending channel.Bitcoin lost over
Topics:
Yuval Gov considers the following as important: Bitcoin (BTC) Price, BTCanalysis
This could be interesting, too:
Chayanika Deka writes XRP, SOL, and ADA Inclusion in US Crypto Reserve Pushes Traders on Edge
Chayanika Deka writes Why Arthur Hayes Is Bullish on Bitcoin Under Trump’s Economic Strategy
Mandy Williams writes Why the Bitcoin Market Is Stuck—and the Key Metric That Could Change It: CryptoQuant CEO
Jordan Lyanchev writes Liquidations Top 0M as Bitcoin Falls K, Reversing Trump-Driven Rally
Today we got another reminder that volatility is working both ways.
Bitcoin has fabulous times since entering the new decade. However, when we see such a parabolic move to the upside, we can expect volatile moves to the other side, as well.
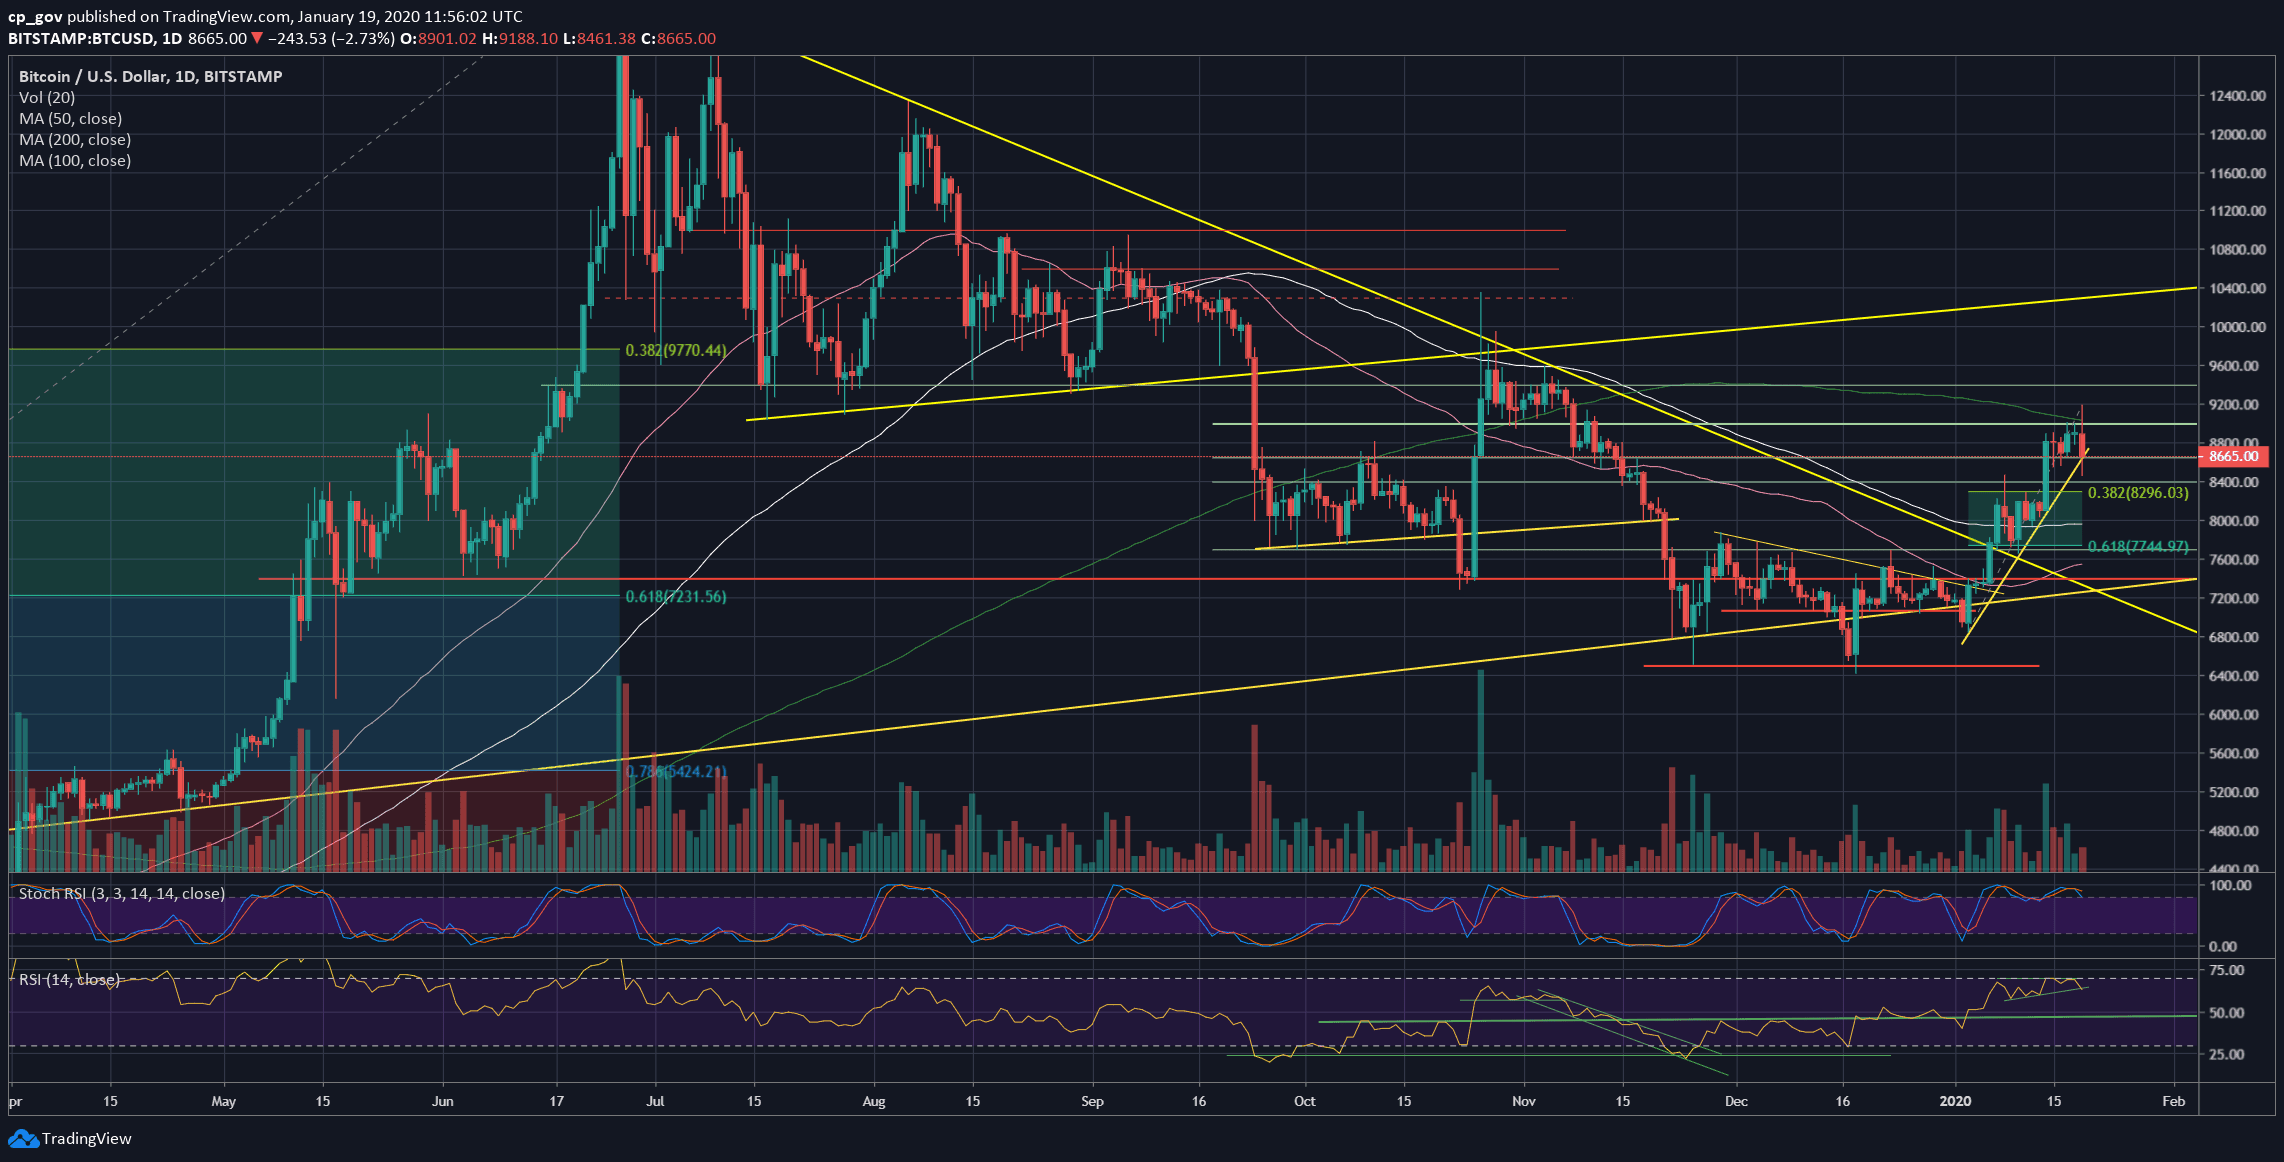
Just yesterday, we mentioned Bitcoin price reaching its first major test – the 200-days moving average line (marked light green on the following chart). Many analysts see this tough resistance as the barrier between Bear and Bull markets.
Today, Bitcoin surpassed the crucial moving average line (roughly around $9060). However, shortly after recording a daily high (and year to date) at $9188 (Bitstamp), we received a MEGA dump.
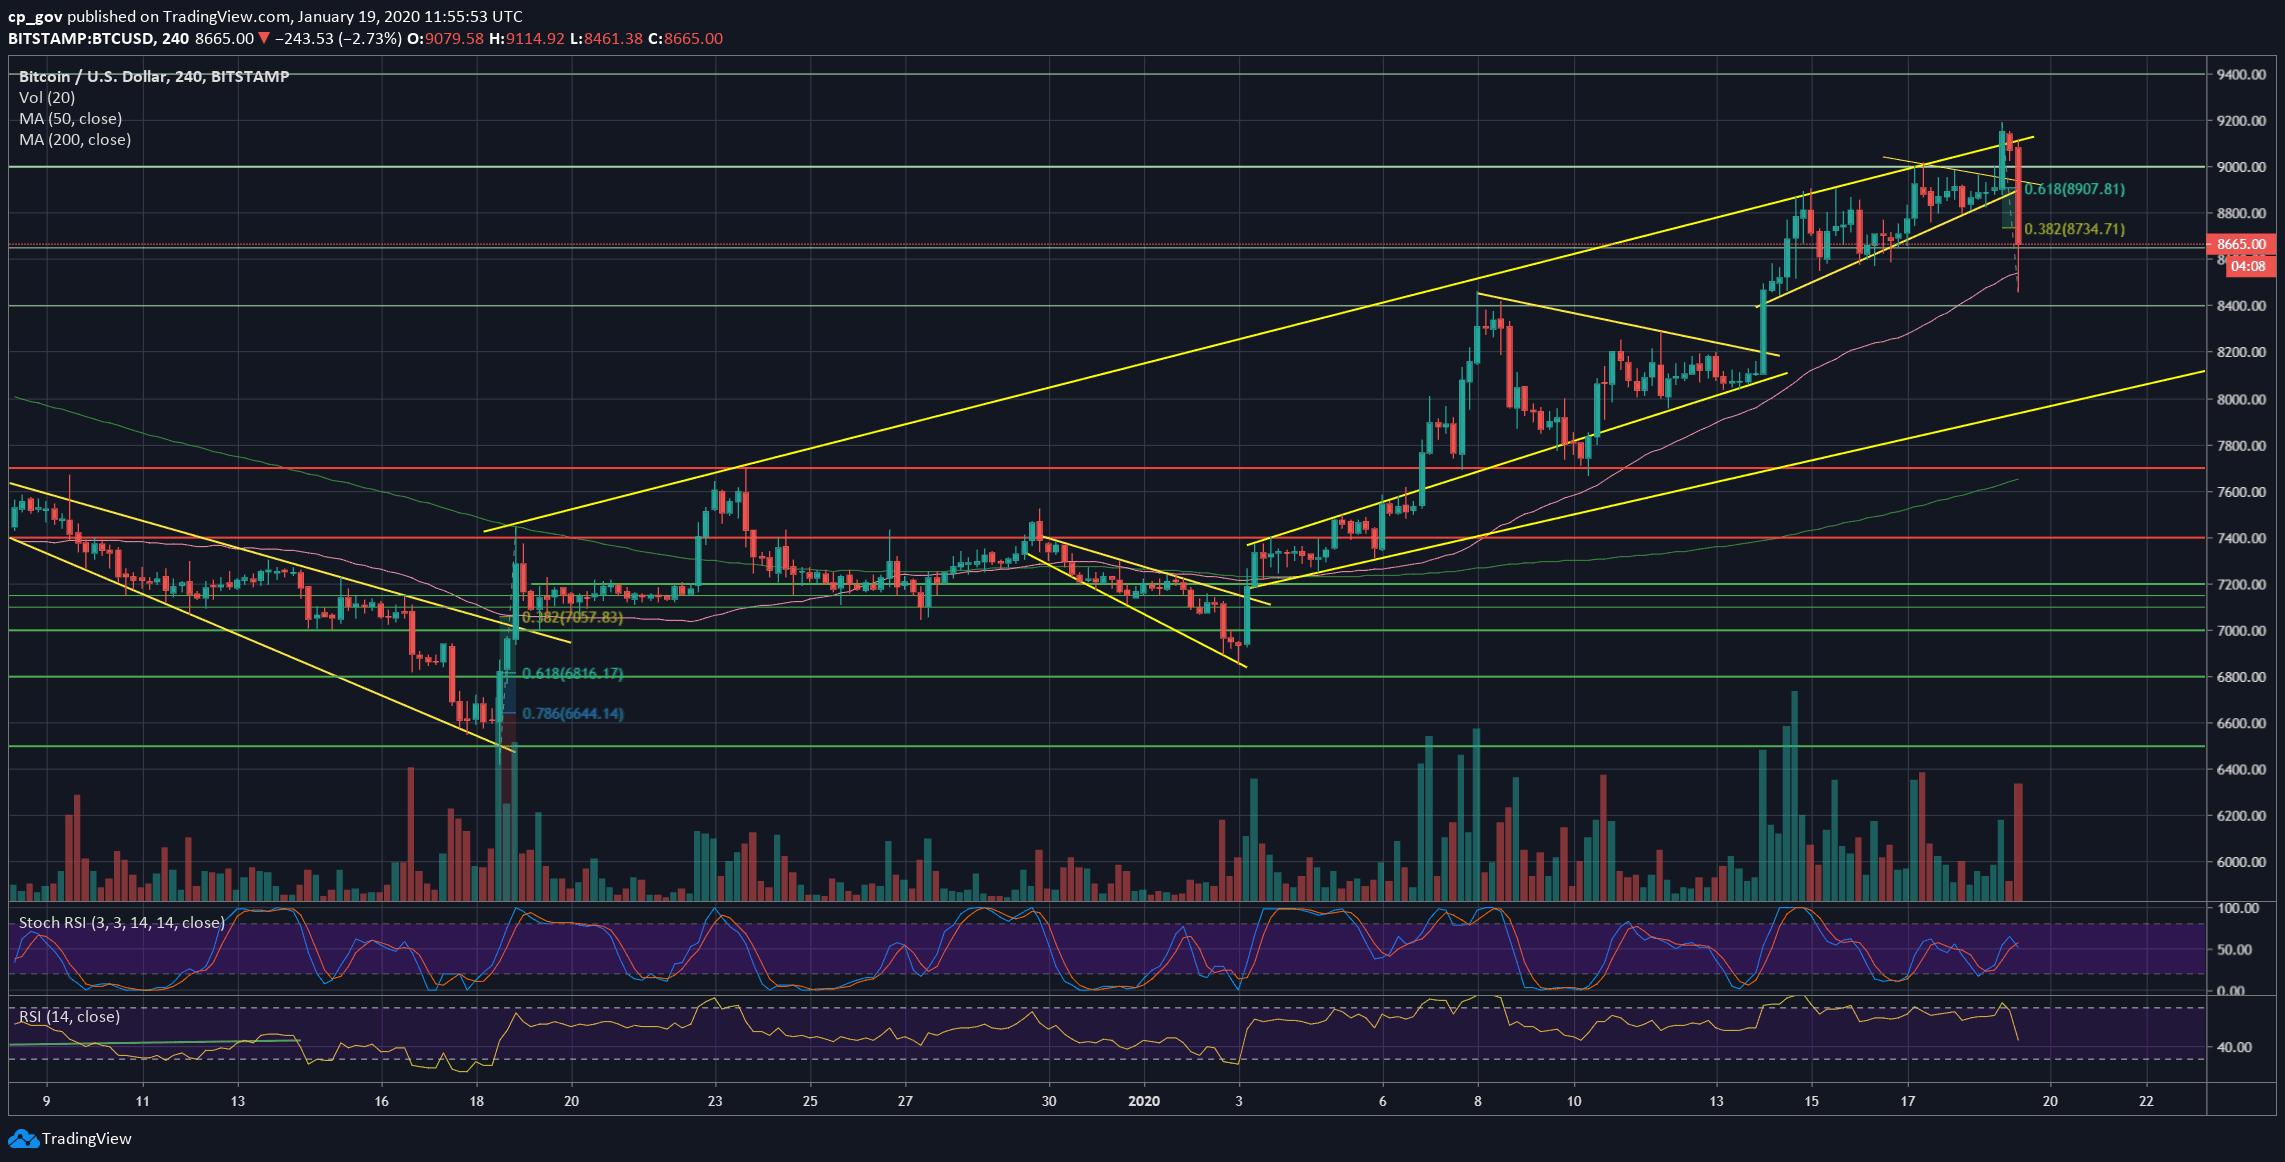
Besides, on the 4-hour chart, we can clearly see Bitcoin reaching the top area of the marked ascending channel.
Bitcoin lost over $700, plunging to the $8400 old resistance level. As of writing these lines, Bitcoin had recovered a bit, trading above the $8600 resistance level.
Market Cap Evaporated $13 Billion In Minutes
So far, there is no reason to panic, in my opinion. It’s OK not to overcome the significant MA-200 at the first chance.
Another thing to keep in mind is the CME Futures’ Friday low at $8720. This means that as of now, there will be a positive price gap.
Following the drop, the total market cap had reached $250 billion at the top before losing over $13 billion in less than 60 minutes.
Total Market Cap: $237.5 billion
Bitcoin Market Cap: $157.5 billion
BTC Dominance Index: 66.4%
*Data by CoinGecko
Key Levels To Watch & Next Targets
– Support/Resistance levels: Bitcoin is now trying to keep above the $8600 resistance turned support level. If the last breaks, then the $8300 – $8400 strong support area will be the next level, along with the Fibonacci retracement level of 38.2%.
Further below lies the $8000 area, along with the 100-days moving average line (marked by white). This also contains the bottom trend-line of the ascending channel.
From above, $8730 will be the first level of resistance Bitcoin will face (38.2% Fib level). The next major resistance is $8900, along with the Golden Fib of %61.8.
Further above is $9000, along with the most significant resistance at the current price area – the 200-days moving average line.
– The RSI Indicator: The RSI that was hovering at its highest levels since June had plunged together with the price. It will be interesting to see if the RSI can hold the mini-ascending trend-line.
A bearish sign might be coming on behalf of the Stochastic RSI oscillator, as it made a bearish cross-over and about to enter the neutral territory, which can ignite a further correction.
– Trading volume: We need to keep in mind that the vast move is taking place during the weekend when it’s easier to shift the markets.
BTC/USD BitStamp 4-Hour Chart
BTC/USD BitStamp 1-Day Chart