A senior analyst at RoboForex shares his insights into the future scenarios for Bitcoin, Ethereum, Litecoin, XRP and Bitcoin Cash price movement.Dmitriy Gurkovskiy, a senior analyst at foreign exchange broker RoboForex, provides his vision of the possible tendencies in price changes for Bitcoin as well as for other major cryptos.The currency market failed to get over another collapse. In general, there is a great potential in Bitcoin for a rebound upwards and new growth in anticipation of halving. However, to implement this scenario, bulls must not let the cryptocurrency continue falling.We should note that the “growth” scenario in Bitcoin may be well seen on longer timeframes. As for shorter timeframes, there are risks of further short-term decline, that’s why one shouldn’t expect the
Topics:
Dmitriy Gurkovskiy considers the following as important: bch, bchxrp, Bitcoin Cash, BTC, btcusd, crypto analysis, crypto price, crypto price analysis, ETH, ethusd, Guest Posts, LTC, ltcusd, News, Reports, XRP, xrpusd
This could be interesting, too:
Christian Mäder writes Bitcoin-Transaktionsgebühren auf historischem Tief: Warum jetzt der beste Zeitpunkt für günstige Überweisungen ist
Bitcoin Schweiz News writes Litecoin jetzt in der Telegram-Wallet verfügbar!
Christian Mäder writes Das Bitcoin-Reserve-Rennen der US-Bundesstaaten: Wer gewinnt das Krypto-Wettrüsten?
Bitcoin Schweiz News writes BlackRock bringt Bitcoin-ETP nach Europa – Was bedeutet das für den Kryptomarkt?
A senior analyst at RoboForex shares his insights into the future scenarios for Bitcoin, Ethereum, Litecoin, XRP and Bitcoin Cash price movement.
Dmitriy Gurkovskiy, a senior analyst at foreign exchange broker RoboForex, provides his vision of the possible tendencies in price changes for Bitcoin as well as for other major cryptos.
The currency market failed to get over another collapse. In general, there is a great potential in Bitcoin for a rebound upwards and new growth in anticipation of halving. However, to implement this scenario, bulls must not let the cryptocurrency continue falling.
We should note that the “growth” scenario in Bitcoin may be well seen on longer timeframes. As for shorter timeframes, there are risks of further short-term decline, that’s why one shouldn’t expect the instrument to rise in the nearest future as bears are very likely to break support levels soon.
At the same time, from the technical point of view, the current levels may seem very interesting from the perspective of a strong rebound to the upside. However, it’s essential to wait for a confirmation on shorter timeframes.
Bitcoin
In the weekly chart, Bitcoin is “clinging” to the rising channel’s downside border. The current price structure may be considered as a bullish “1-1” pattern with two corrections that are equal in both time and price. In most cases, such a pattern is followed by a strong rising movement which may break $60,000. If bulls are able to hold this support area and then force the price out of a Triangle pattern, it will be a very strong signal for further growth. Another signal to confirm this scenario in the long-term may be a rebound from the support level at the RSI. However, if bears break $3,500, the rising channel’s downside border will be broken as well. In this case, the downside target will be the next support level at $1,200.
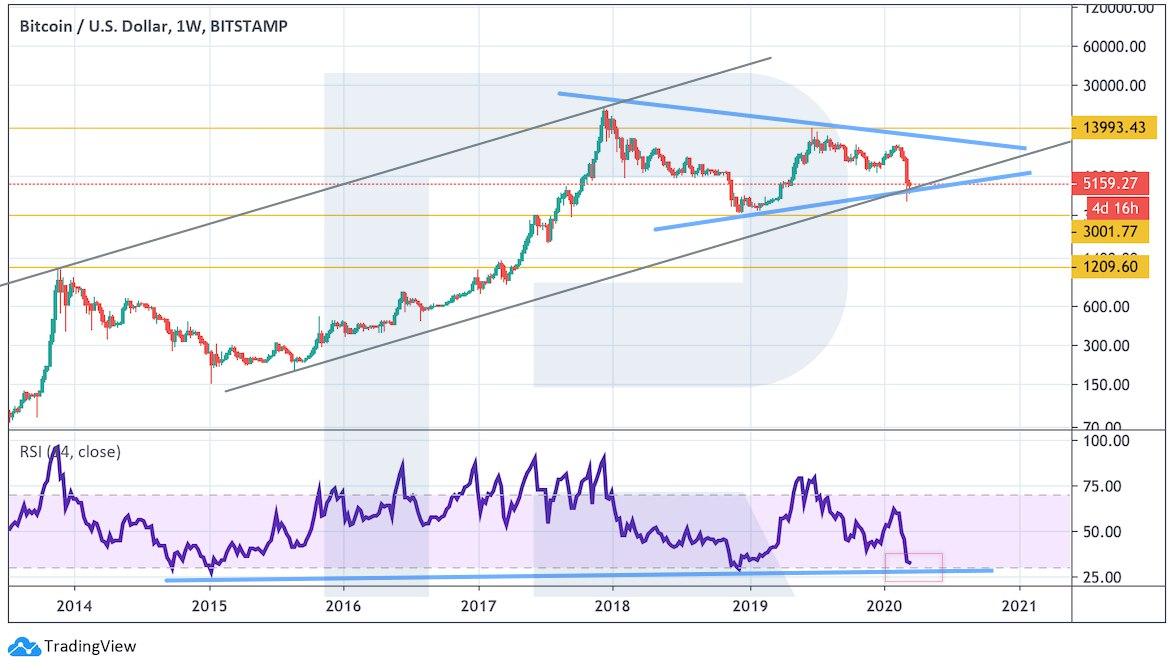
Photo: Roboforex / TradingView
As we can see in the H4 chart, the asset is stuck inside a Triangle pattern. In most cases, such patterns are broken downwards, that’s why the price may fall to break $4,195. However, the rising channel’s downside border in the weekly chart may prevent the asset from falling deeper. To confirm the “growth” idea, bulls must push the price out of the descending channel. If the instrument breaks the resistance level and fixes above $6,250, it may complete the decline and resume the bullish tendency. In the case of a negative scenario, the pair may fall below $4,195 without getting back quickly. After that, it may test $3,000.
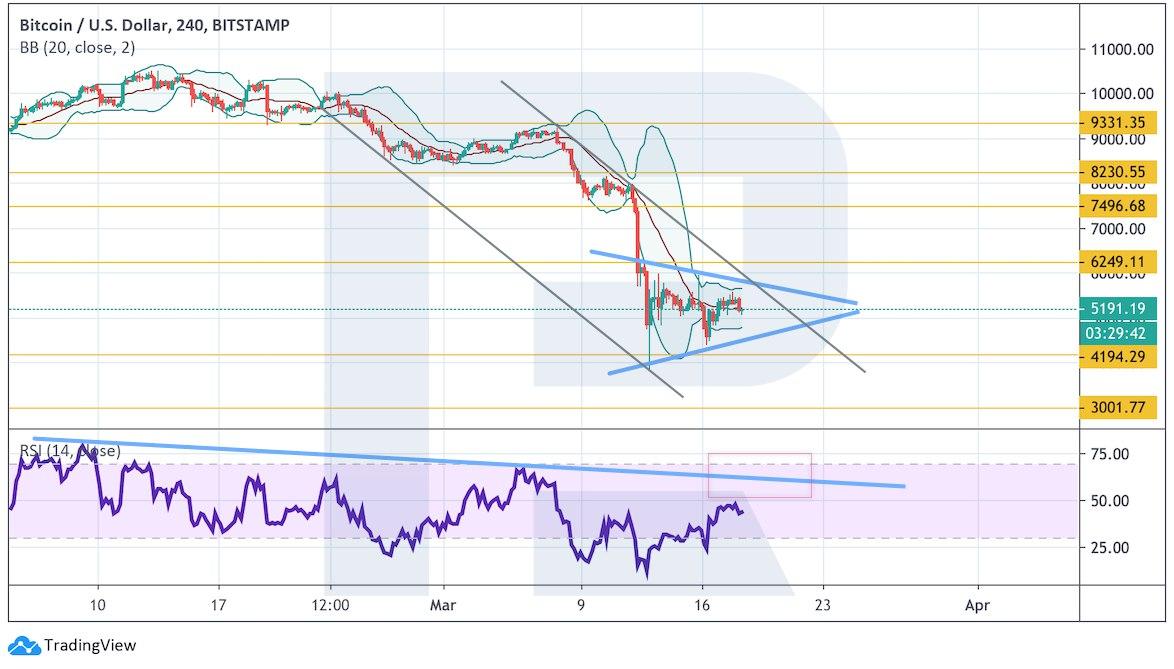
Photo: Roboforex / TradingView
Ethereum
In the case of Ethereum, bulls are once trying to “cling” to the support level, which is the descending channel’s downside border. The RSI is also testing the support area and there is a chance to see the price rebound from the current levels with the target at $150. Still, this scenario may be canceled if the instrument falls and fixes below $80. In this case, it may break the channel’s downside border and fall towards $55. In the technical analysis, a breakout of such a channel is considered as a strong signal for further descending tendency.
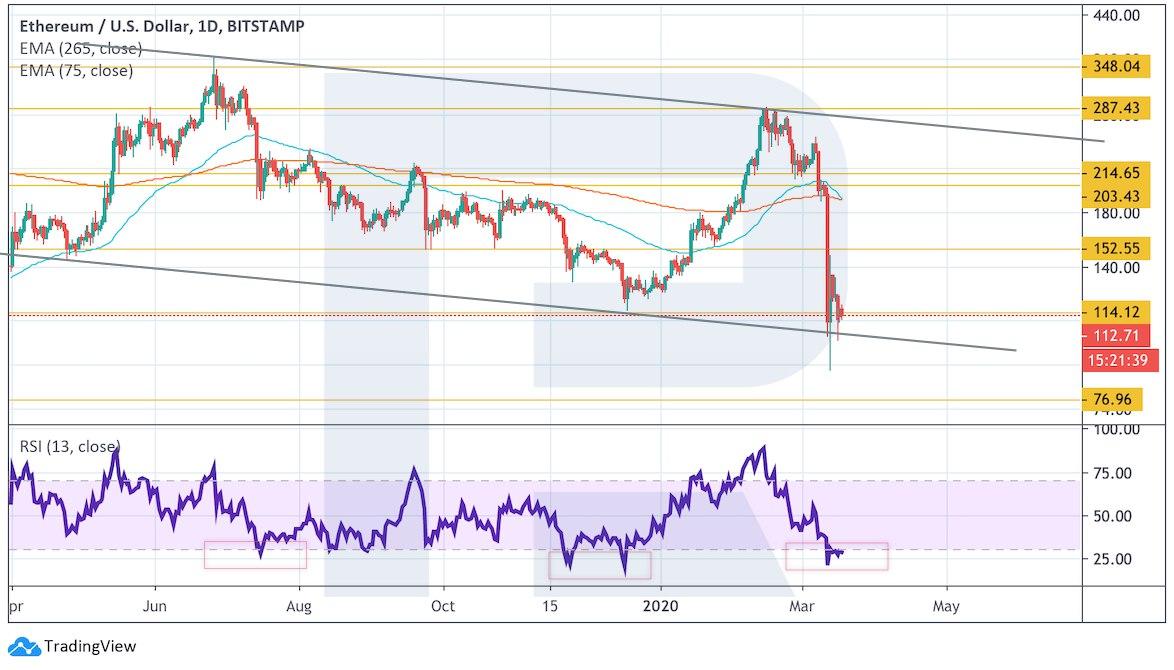
Photo: Roboforex / TradingView
On shorter timeframes, the asset is stuck inside a Triangle pattern, just like Bitcoin. If the price breaks the pattern’s downside border, the cryptocurrency may continue falling towards $75. Another signal to confirm this scenario is a test of the trendline at the RSI. Still, if bulls are able to push the price above $135, the decline may be over and they may start a new rising movement with the target at $285.
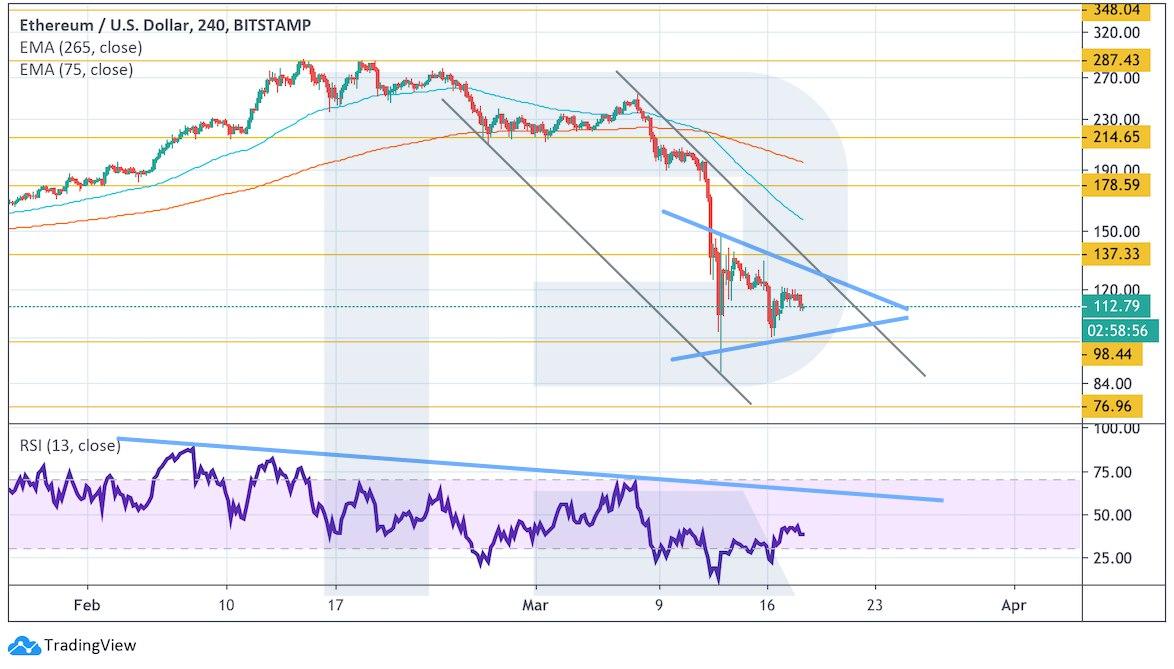
Photo: Roboforex / TradingView
Litecoin
In the weekly chart, Litecoin is correction inside a Triangle pattern. Here, we can also see a symmetrical rising channel similar to BTCUSD but the asset hasn’t reached the channel’s downside border yet. There is a possibility that the price may reach $20-15 and only after that start a new growth. However, the pair may yet rebound from the current levels. If bulls succeed in protecting the pattern’s downside border from a breakout and then push the price to test the upside one, the instrument may continue growing without forming any descending structures. Another signal to confirm this scenario is a test of the support level at the RSI. Still, if the asset breaks the pattern’s downside border, it may test $20-15.
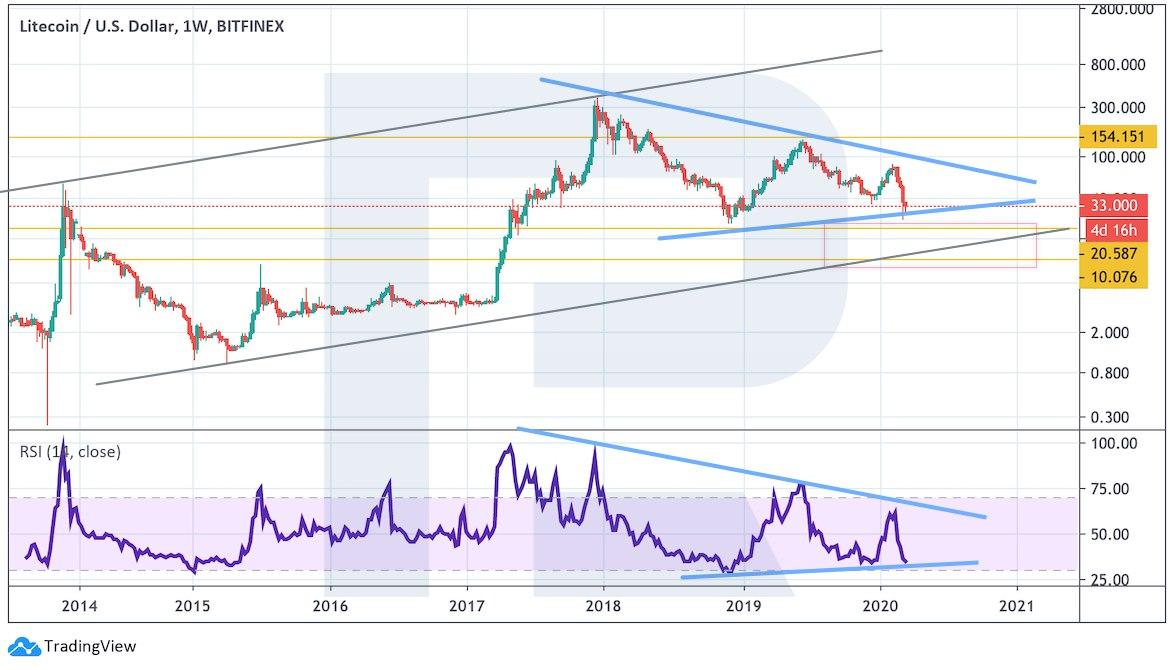
Photo: Roboforex / TradingView
As we can see in the H4 chart, the price is correcting inside the descending channel; the current structure may also be considered as a Triangle pattern, which may be broken to the upside very soon, that’s why it’s very important for bulls to push the instrument above $40. In this case, they may switch to the scenario from the weekly chart. However, if the price breaks $28 and fixes below it, the cryptocurrency may test $21.
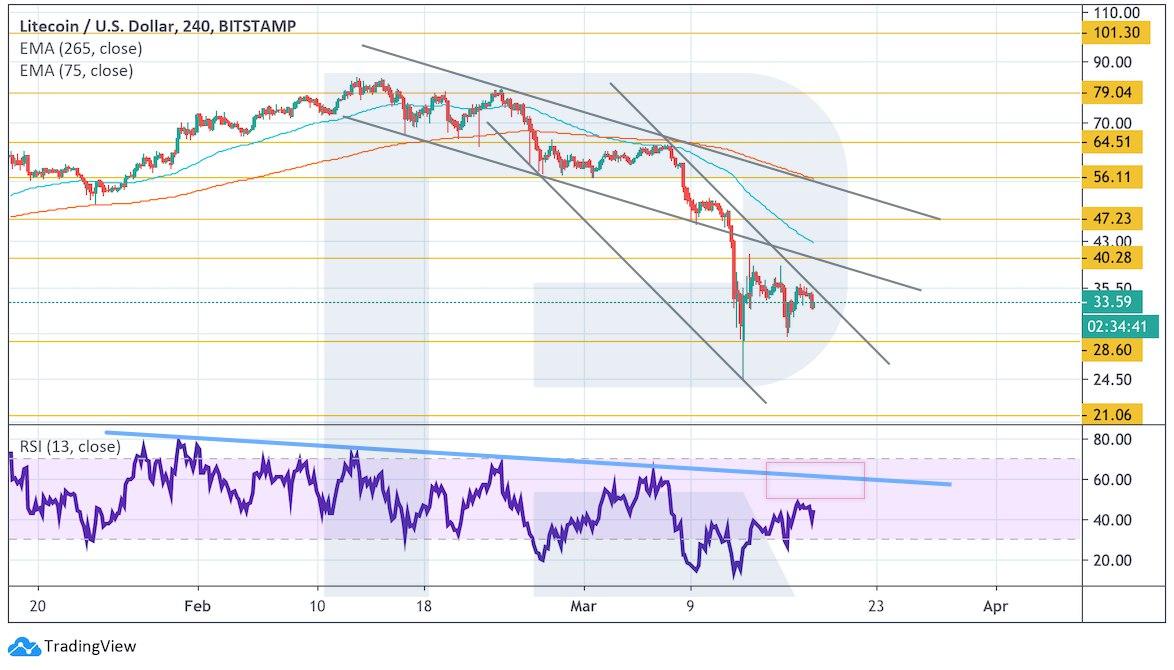
Photo: Roboforex / TradingView
XRP
As we can see in the daily chart, XRP is testing the descending channel’s downside border. If the price breaks $0.11 it may boost its decline to test $0.07. However, the main scenario suggests that the pair may quickly test the support area at $0.11 and start a rising correction. To confirm this scenario, the asset must break the resistance level and fix above $0.17. In this case, the next upside target may be $0.25. another signal to confirm this scenario is the RSI’s plummeting towards 20.
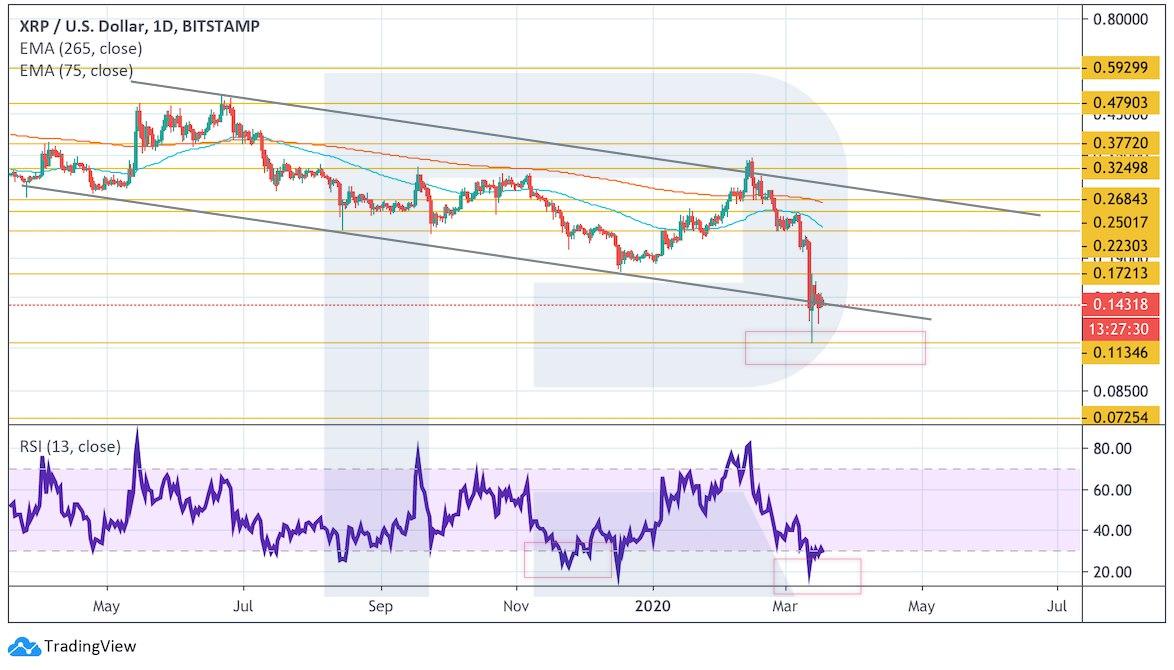
Photo: Roboforex / TradingView
In the H4 chart, the price is correcting inside a Triangle pattern, just like some other assets. If the instrument breaks the pattern’s upside border and fixes above $0.17, the descending channel’s upside border will be broken as well. However, this scenario may no longer be valid if the pair breaks the pattern’s downside border and fixes below $0.11. In this case, the next downside target may be at $0.09.
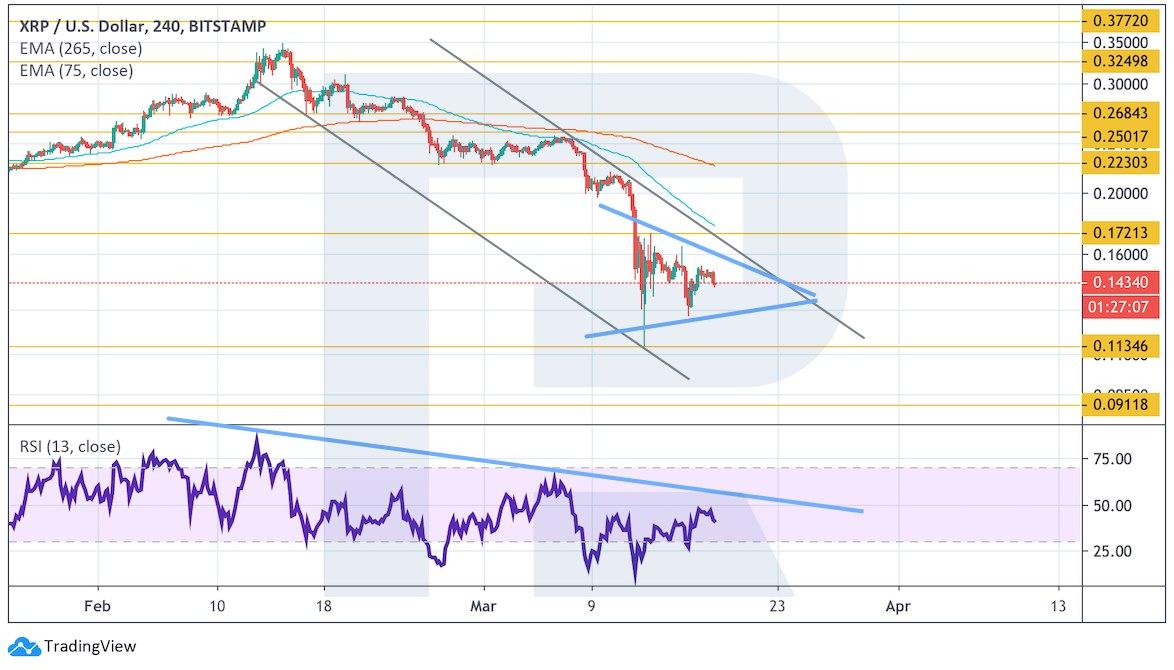
Photo: Roboforex / TradingView
Bitcoin Cash
Bears continue being very active in putting pressure on the asset and this pressure is not decreasing. At the moment, the price is rebounding from the descending channel’s downside border and if bulls are able to break $205, they may start a new correction to the upside. A strong signal to confirm a rebound to the upside will be a breakout of the descending trendline at the RSI. However, if the pair breaks the channel’s downside border and fixes below $135, the instrument may continue trading downwards.
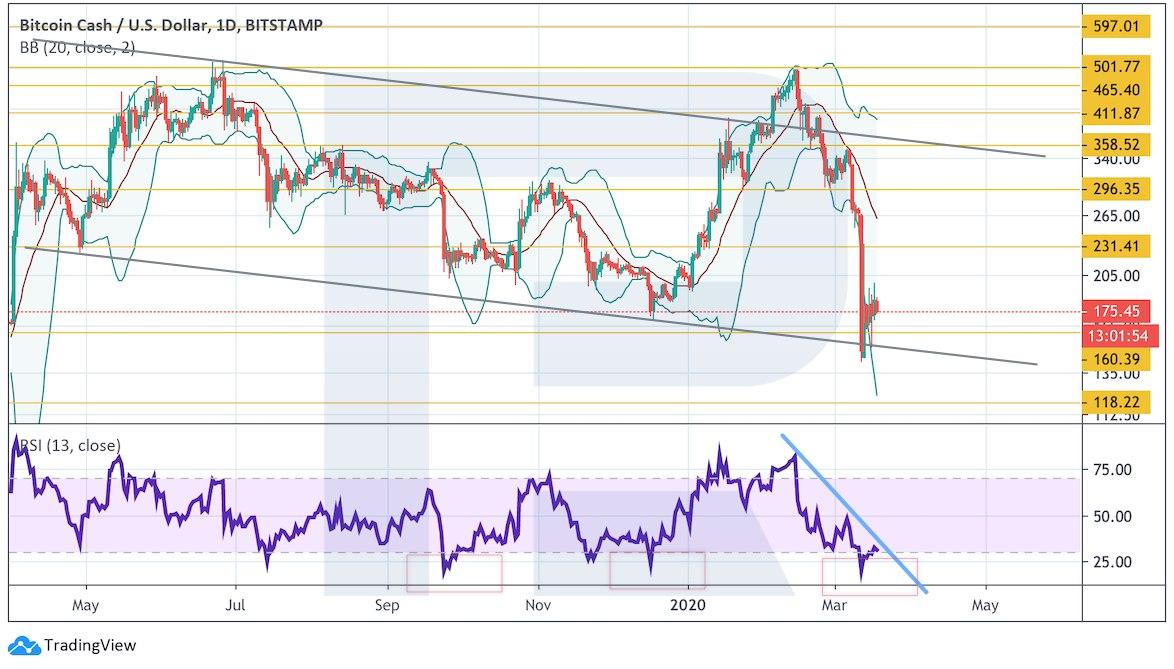
Photo: Roboforex / TradingView
On shorter timeframes, the asset is moving inside the descending channel. There was a test of the resistance level at the RSI, which may indicate a decline from the current levels; the downside target may be at $120. However, this scenario may no longer be valid if the instrument breaks the channel’s upside border and fixes above $230. In this case, one should switch to another scenario, which implies a rebound towards the channel’s upside border from the daily chart.
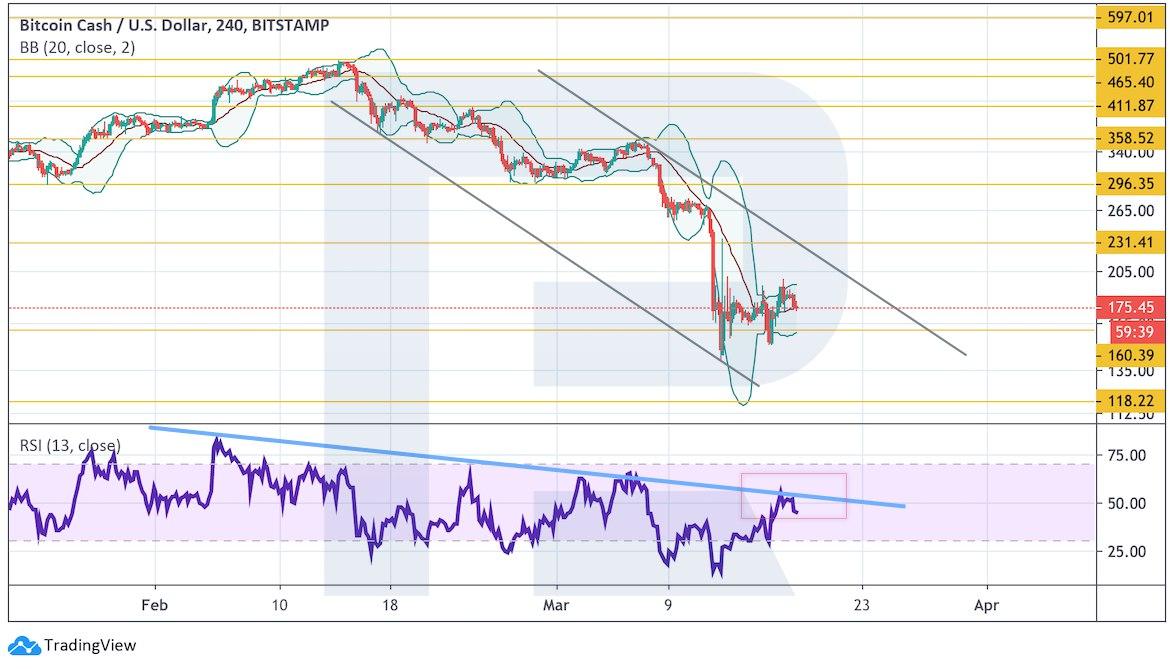
Photo: Roboforex / TradingView
Disclaimer: Any predictions contained herein are based on the authors' particular opinion. This analysis shall not be treated as trading advice. RoboForex shall not be held liable for the results of the trades arising from relying upon trading recommendations and reviews contained herein.

Dmitriy Gurkovskiy is a senior analyst at RoboForex, an award-winning European online foreign exchange forex broker.