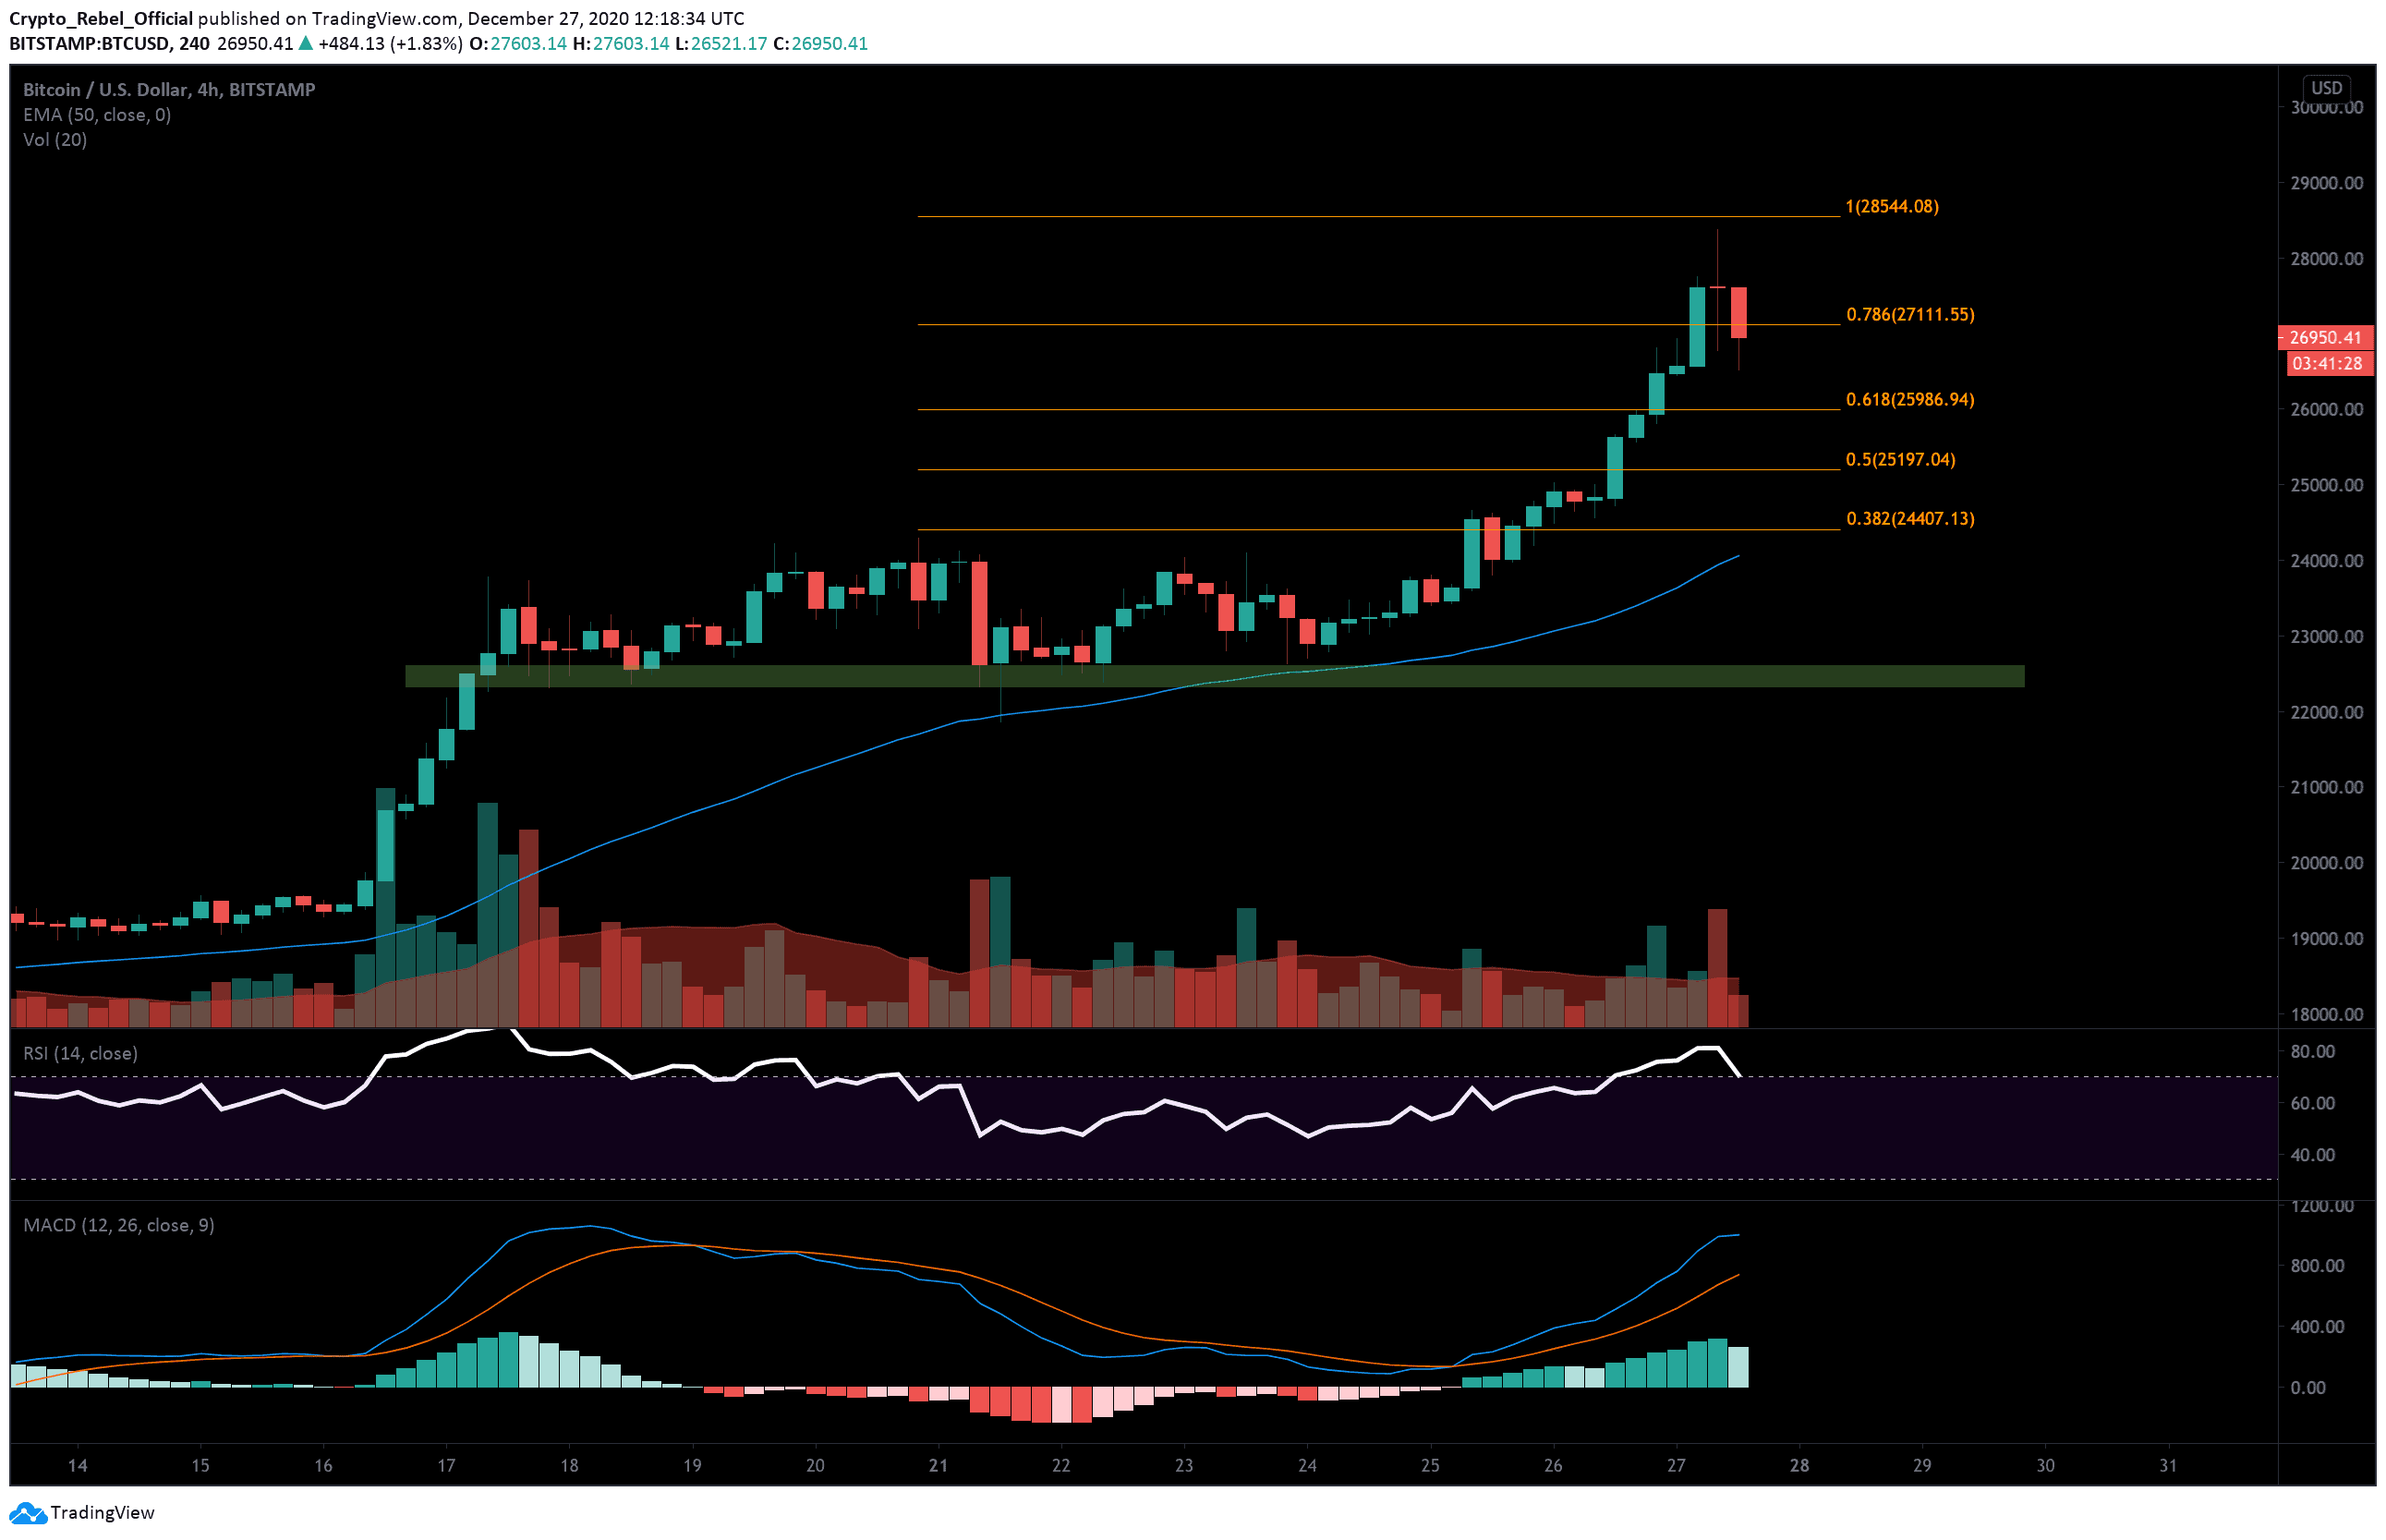
Bitcoin is starting to correct from its rampant rise above K this week, with the current price down ,900 from its recent peak of ,420. With the Bitcoin market capital currently above 0 billion and overall dominance now above 71%, a correction has been on the cards for a number of days now. million worth of BitMEX short positions have already been liquidated in the last few minutes, as fears of a reversal begin to disseminate.The ,000 level appears to be providing some temporary intraday support right now as traders try to figure out if this is the start of the last major bitcoin correction we’ll see in 2020.Price Levels to Watch in the Short-termOn the 4-hour BTC/USD chart, we can see that the bitcoin downtrend was foreshadowed by a long-legged Doji forming on the chart
Topics:
Ollie Leech considers the following as important: Bitcoin (BTC) Price, BTC Analysis, BTCEUR, BTCGBP, btcusd, btcusdt
This could be interesting, too:
Chayanika Deka writes XRP, SOL, and ADA Inclusion in US Crypto Reserve Pushes Traders on Edge
Chayanika Deka writes Why Arthur Hayes Is Bullish on Bitcoin Under Trump’s Economic Strategy
Mandy Williams writes Why the Bitcoin Market Is Stuck—and the Key Metric That Could Change It: CryptoQuant CEO
Wayne Jones writes Metaplanet Acquires 156 BTC, Bringing Total Holdings to 2,391
Bitcoin is starting to correct from its rampant rise above $28K this week, with the current price down $1,900 from its recent peak of $28,420. With the Bitcoin market capital currently above $520 billion and overall dominance now above 71%, a correction has been on the cards for a number of days now.
$55 million worth of BitMEX short positions have already been liquidated in the last few minutes, as fears of a reversal begin to disseminate.
The $27,000 level appears to be providing some temporary intraday support right now as traders try to figure out if this is the start of the last major bitcoin correction we’ll see in 2020.
Price Levels to Watch in the Short-term
On the 4-hour BTC/USD chart, we can see that the bitcoin downtrend was foreshadowed by a long-legged Doji forming on the chart which is typically a sign of indecision entering the market. Whenever long wicks appear above and below a thin candle body, it signals that there is an even amount of high volume on both sides of the order book as both bulls and bears fight for control over the asset.
On the 1-hour MACD, we now have a bearish convergence between the 12 and 24 moving averages and the first red candle on the histogram for the first time in 3 days.
Charted volume has already started to flip bearish, which a significant spike in selling pressure in the last 4 hours – during the early American trading session.
Looking at potential bitcoin support options beneath the $27,500 level, we have the following areas which should help to prop up prices during the decline:
(1) $26,850
(2) $26,500
(3) $25,800 – 50 EMA (blue)
(4) $24,785
Depending on the severity of the reaction to this new bitcoin bearish trend, we could see the bottom of this decline reach as low as the major support bar (green) at $22,600 before significant bullish volume returns.
Total market capital: $711 billion.
Bitcoin market capital $499 billion.
Bitcoin dominance: 70.3%
*Data by Coingecko.
Bitstamp 4-Hour BTC/USD Chart