BitcoinBitcoin had an interesting 7-day trading period as the coin dropped by a small 3% over the week. However, this is because BTC fell by a strong 10% over the weekend as the coin fell from ,600 to reach as low as ,500. It rebounded from here and started to climb after the halving occurred earlier in the week.After rebounding, Bitcoin reclaimed the ,000 level and continued upward to reach the resistance at ,815 yesterday. It dropped lower from this level today to reach the current ,500 trading level.Looking ahead, if the sellers push BTC beneath ,400, support is located at ,150 and ,000. Beneath this, added support can be found at ,800, ,500, and ,000 (200-days EMA).On the other side, if the bulls can rebound from ,400, resistance is located at ,815. This is
Topics:
Yaz Sheikh considers the following as important: Bitcoin (BTC) Price, BTC Analysis, btcusd, Chainlink (LINK) Price, ETH Analysis, ETHBTC, Ethereum (ETH) Price, ethusd, LINKBTC, LINKUSD, Price Analysis, Ripple (XRP) Price, Tezos (XTZ) Price, XRP Analysis, xrpbtc, xrpusd, XTZBTC, XTZUSD
This could be interesting, too:
Chayanika Deka writes XRP, SOL, and ADA Inclusion in US Crypto Reserve Pushes Traders on Edge
Chayanika Deka writes Why Arthur Hayes Is Bullish on Bitcoin Under Trump’s Economic Strategy
Mandy Williams writes Why the Bitcoin Market Is Stuck—and the Key Metric That Could Change It: CryptoQuant CEO
Wayne Jones writes Metaplanet Acquires 156 BTC, Bringing Total Holdings to 2,391
Bitcoin
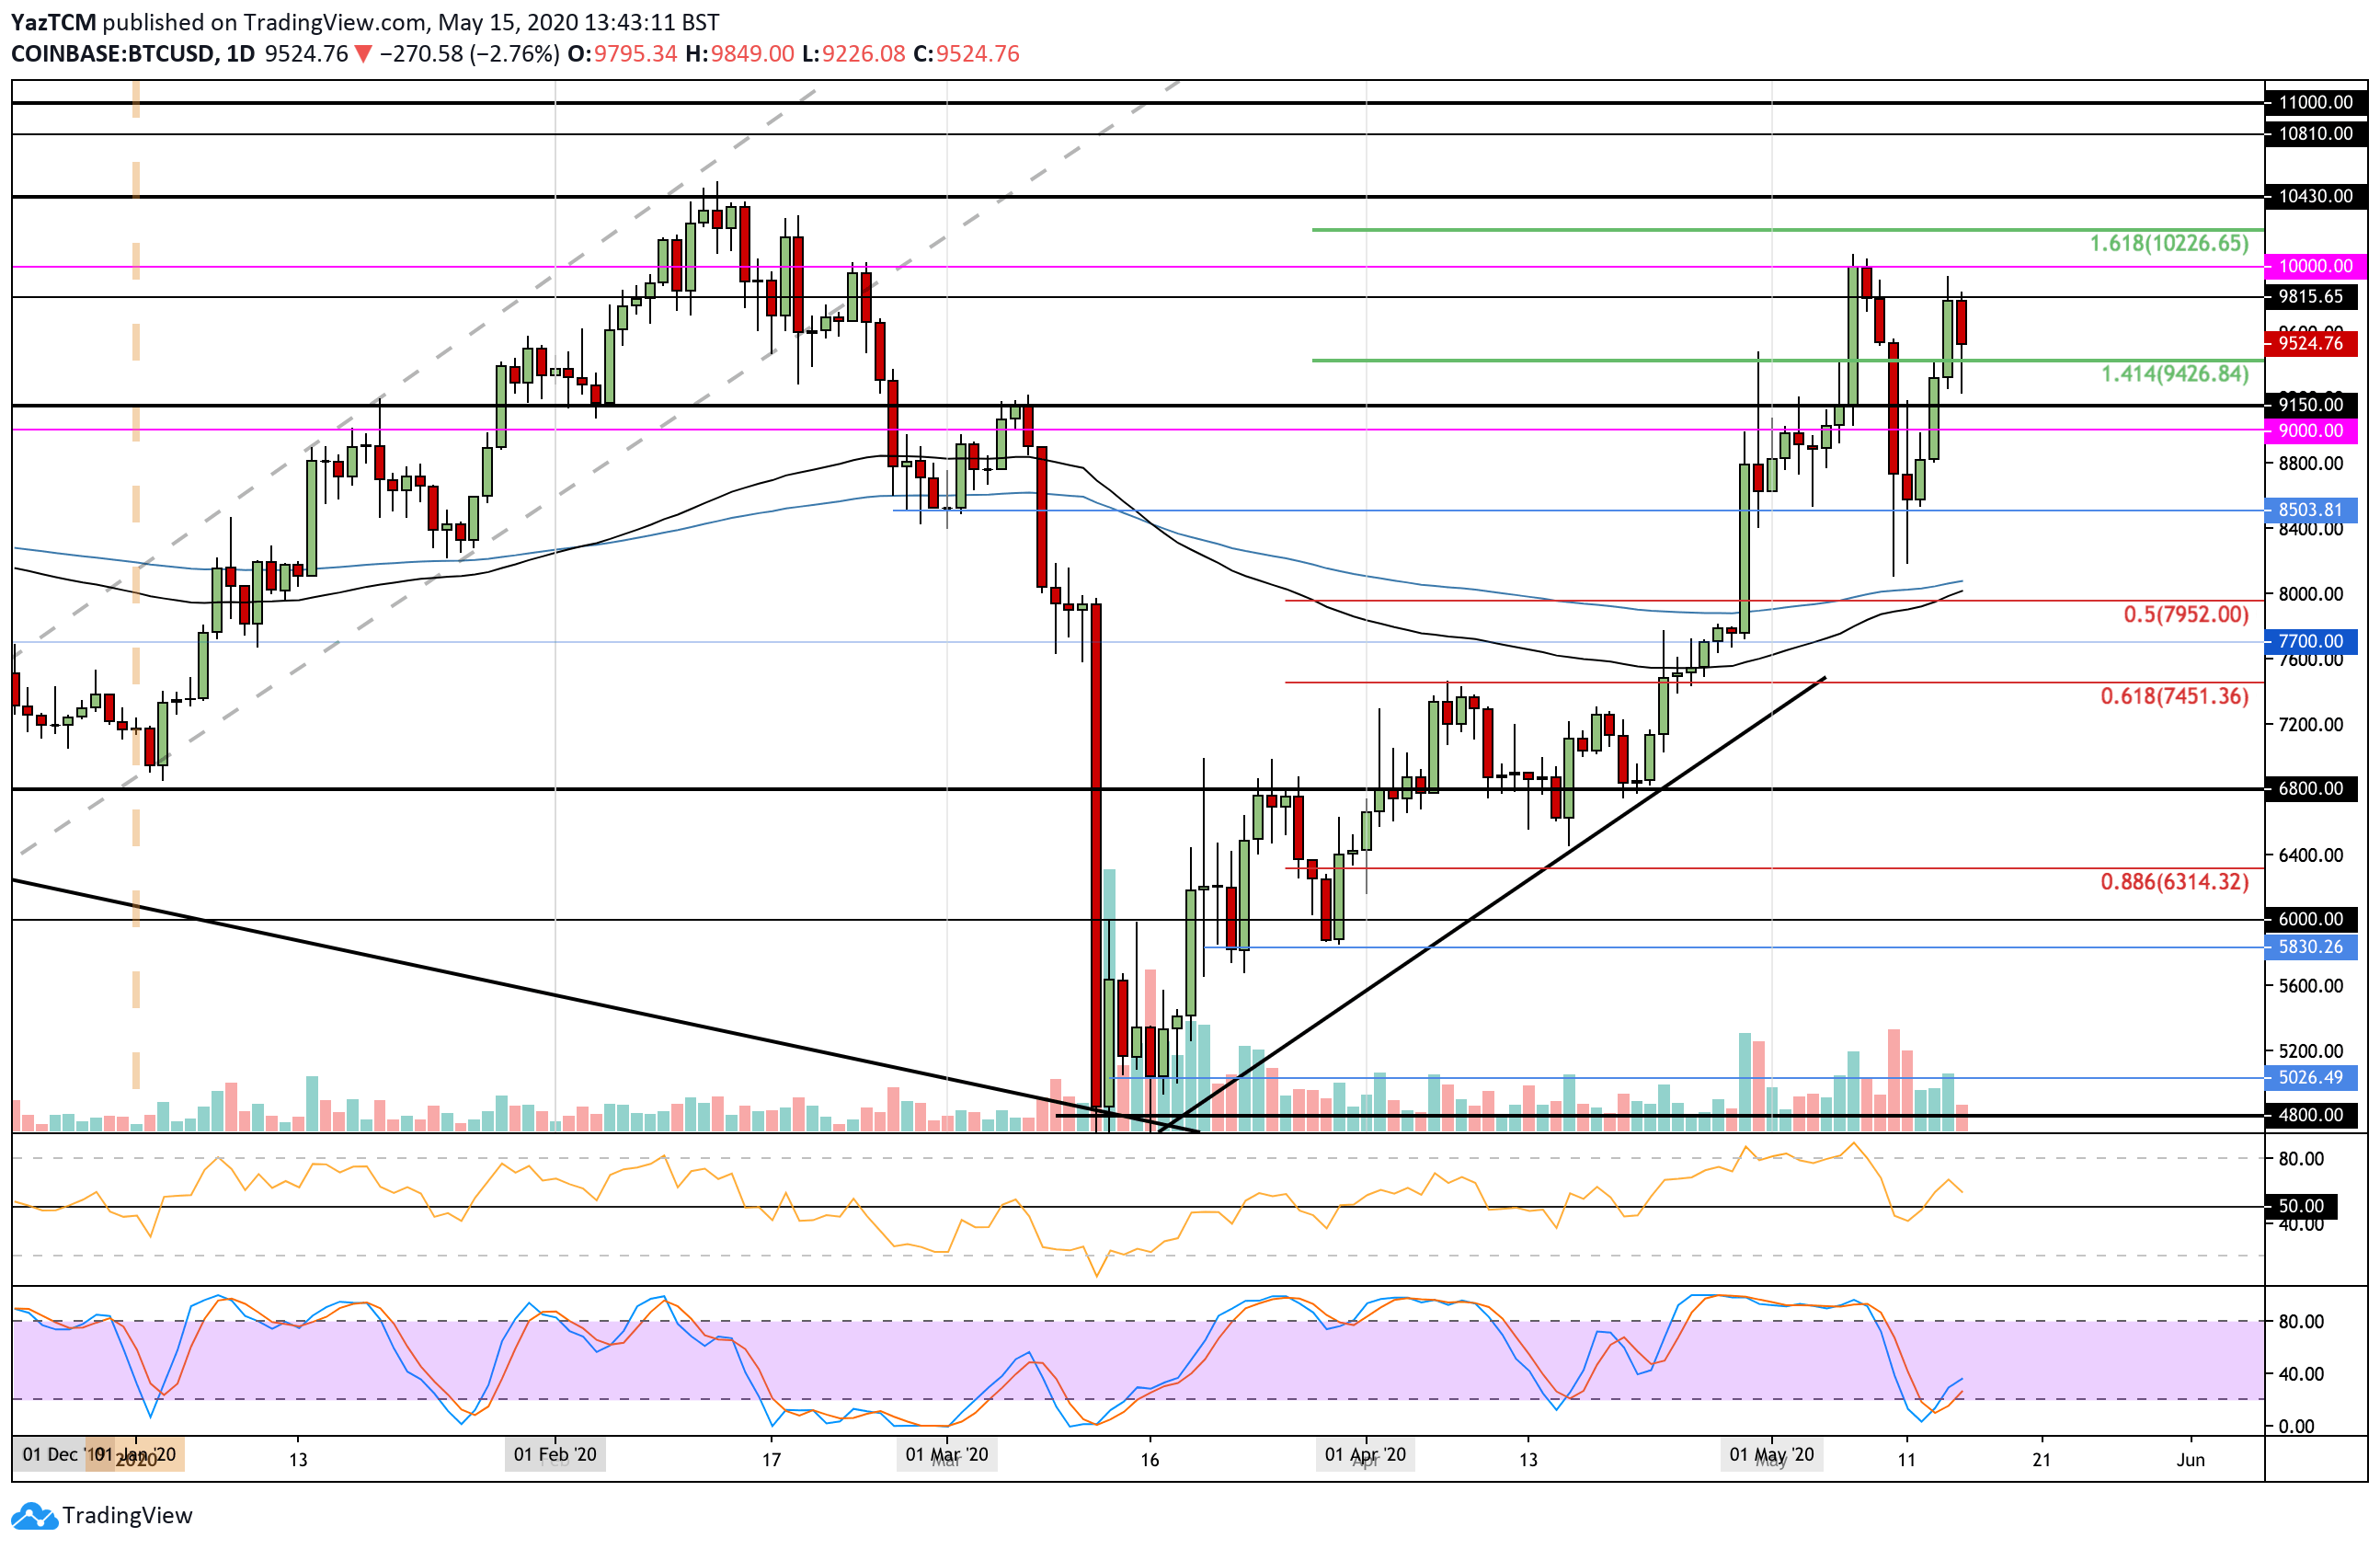
Bitcoin had an interesting 7-day trading period as the coin dropped by a small 3% over the week. However, this is because BTC fell by a strong 10% over the weekend as the coin fell from $9,600 to reach as low as $8,500. It rebounded from here and started to climb after the halving occurred earlier in the week.
After rebounding, Bitcoin reclaimed the $9,000 level and continued upward to reach the resistance at $9,815 yesterday. It dropped lower from this level today to reach the current $9,500 trading level.
Looking ahead, if the sellers push BTC beneath $9,400, support is located at $9,150 and $9,000. Beneath this, added support can be found at $8,800, $8,500, and $8,000 (200-days EMA).
On the other side, if the bulls can rebound from $9,400, resistance is located at $9,815. This is followed by resistance at $10,000, $10,226 (1.618 Fib Extension), $10,430 (2020 high), and $10,810.

Ethereum
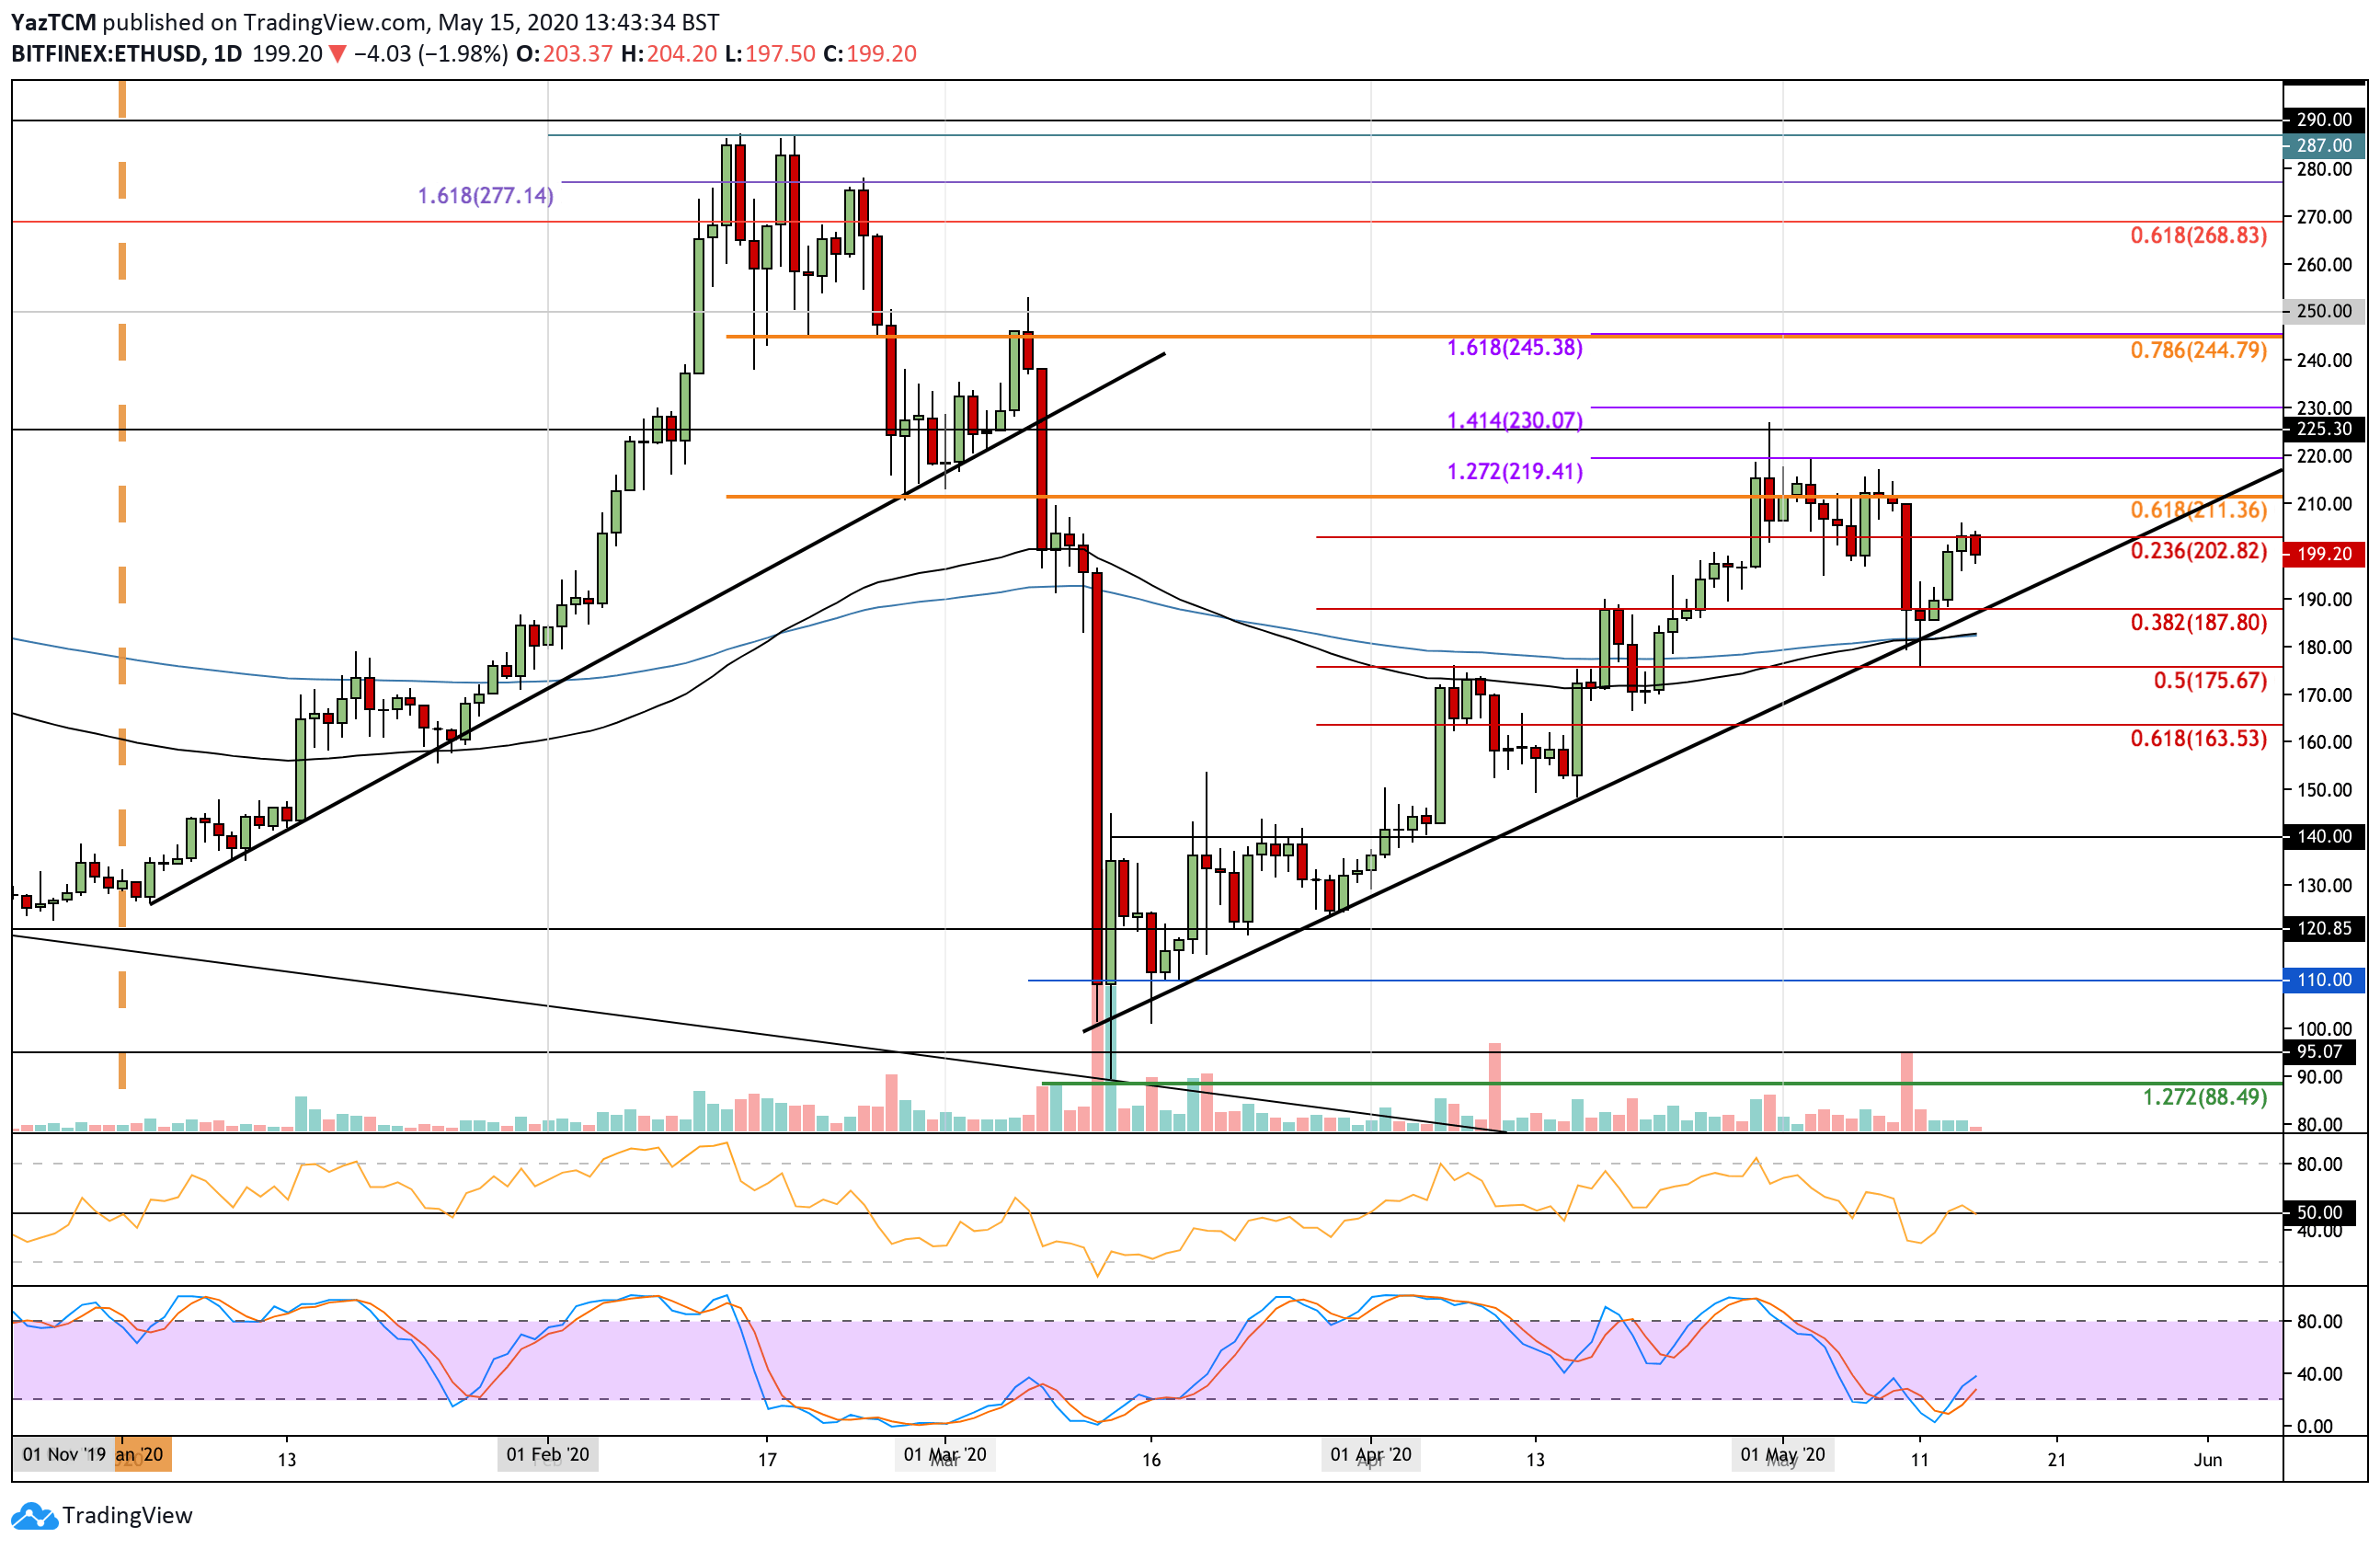
Ethereum fell by a sharp 6% over the previous week as the coin dropped from a high of $210 over the weekend to reach as low as $175. Ethereum went on to rebound from support at a rising trend line and started to push higher to reach the current $200 trading level.
Moving forward, if the buyers can break back above $200, the first level of resistance is located at $211 (bearish .618 Fib Retracement). This is followed by resistance at $220 (1.272 Fib Extension), $225, and $230 (1.414 Fib Extension). Additional resistance is located at $245 (bearish .786 Fib Retracement).
Alternatively, if the sellers push lower, support is firstly located at the rising support trend line. Beneath this, support lies at $187 (.382 Fib Retracement), $180 (200-days & 100-days EMA), and $175 (.5 Fib Retracement).

Against Bitcoin, ETH continues to suffer heavily as it creates a fresh low for May at around 0.0205 BTC. It dropped from a high of around 0.023 BTC earlier in the week and fell beneath the support at 0.021 BTC (.786 Fib Retracement) to reach the current support at 0.0208 BTC (.886 Fib Retracement).
Looking ahead, if the sellers break beneath 0.0208 BTC, support is expected at 0.0201 BTC (March lows) and 0.02 BTC. Beneath this, added support lies at 0.0196 BTC, 0.0192 BTC, and 0.019 BTC.
On the other side, if the bulls push higher, resistance is located at 0.0213 BTC, 0.022 BTC, and 0.0225 BTC (200-days EMA). This is followed by resistance at 0.023 BTC and 0.0236 BTC.

Ripple
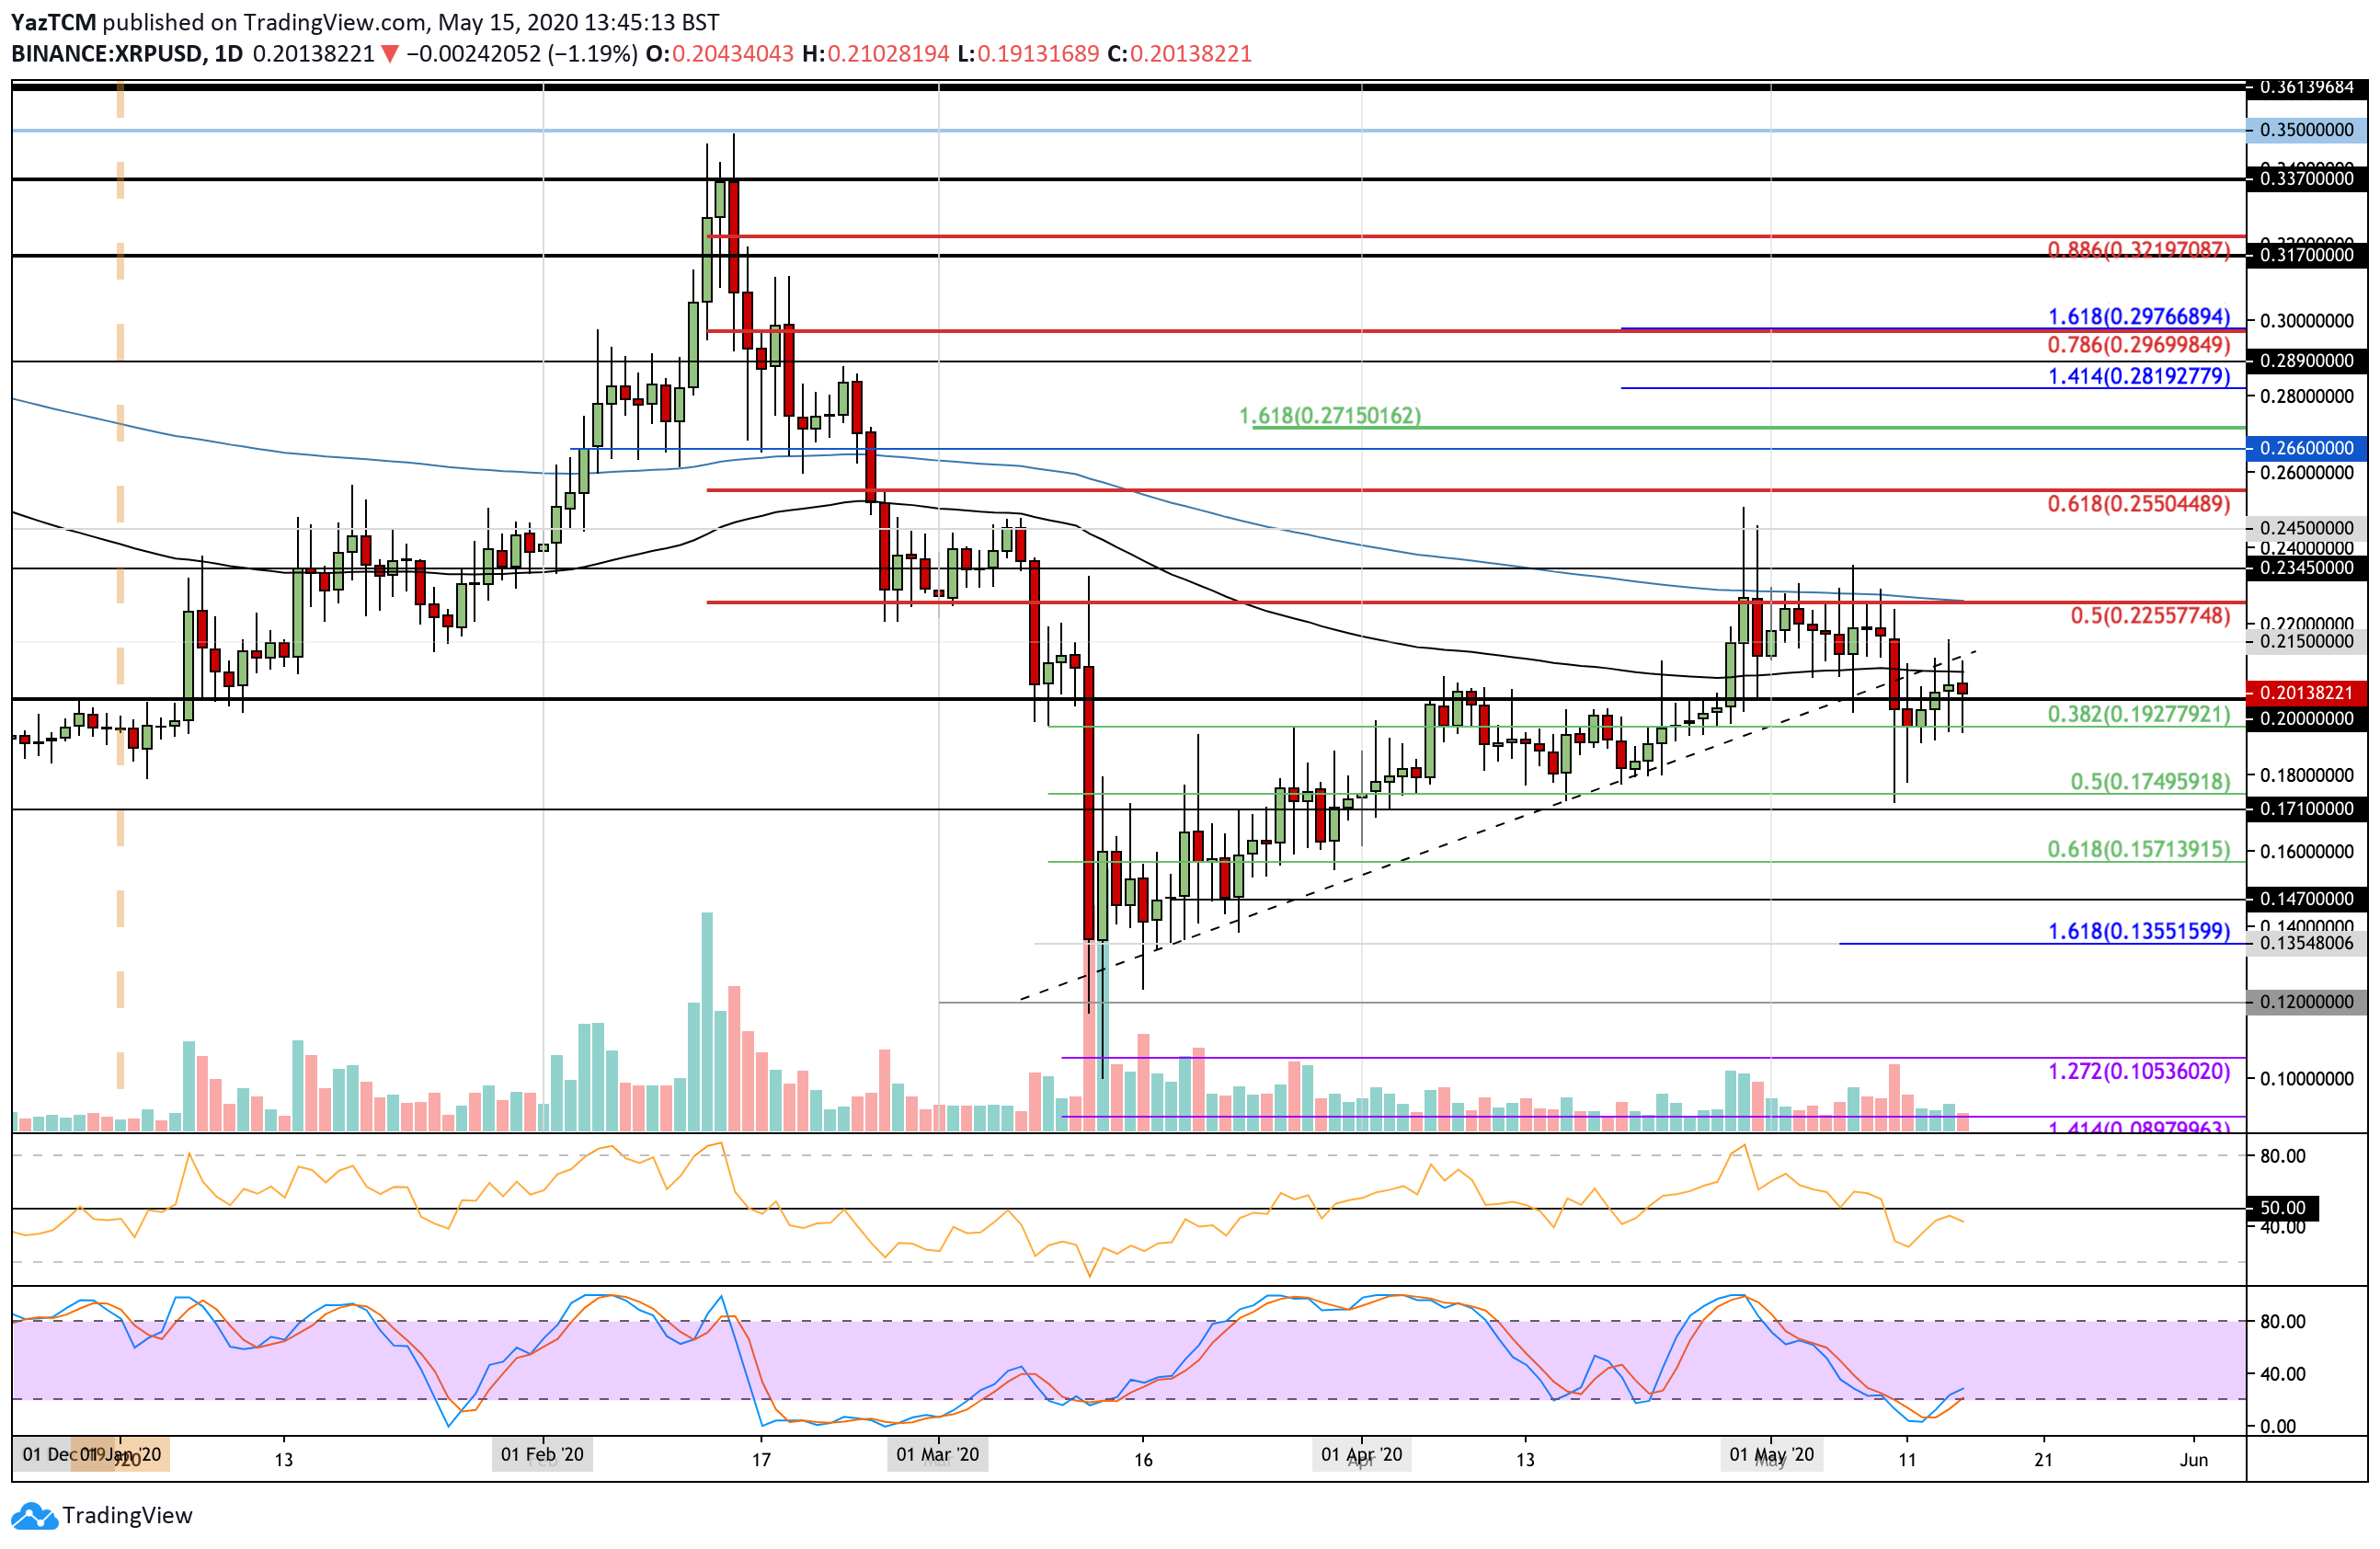
XRP saw a steep 7% price fall this week as the cryptocurrency trades at the $0.20 level. XRP fell from a high of around $0.225 over the weekend, which saw the coin breaking beneath a rising support trend line and dropped as low as $0.175. Luckily, it found strong support at $0.192 (.382 Fib Retracement) and rebounded higher to reclaim the $0.20 level. However, it is now struggling to pass the 100-days EMA at $0.207.
Moving forward, if the bulls can break above the 100-days EMA, resistance is found at $0.215 and $0.225 (bearish .5 Fib Retracement & 200-days EMA). This is followed by resistance at $0.234 and $0.245.
Alternatively, if the sellers push lower and break beneath $0.20, support can be found at $0.192 (.382 Fib Retracement). Beneath this, support lies at $0.18, $0.175 (.5 Fib Retracement), and $0.17.

Against Bitcoin, XRP price capitulation continues as it falls beneath the 2300 SAT level and drops as low as 2071 SAT today to trade at fresh 2-year price lows. It found support at a long term downside 1.414 Fib Extension and rebounded above 2100 SAT the buyers battle to keep the coin above this.
If the sellers break beneath 2100 SAT again, support is located at 2071 SAT. Beneath this, added support is found at 2022 (downside 1.414 Fib Extension), 1950 SAT (downside 1.618 Fib Extension), and 1890 SAT.
On the other side, the first level of strong resistance lies at 2200 SAT. Above this, resistance is located at 2300 SAT, 2360 SAT, and 2400 SAT.

Tezos
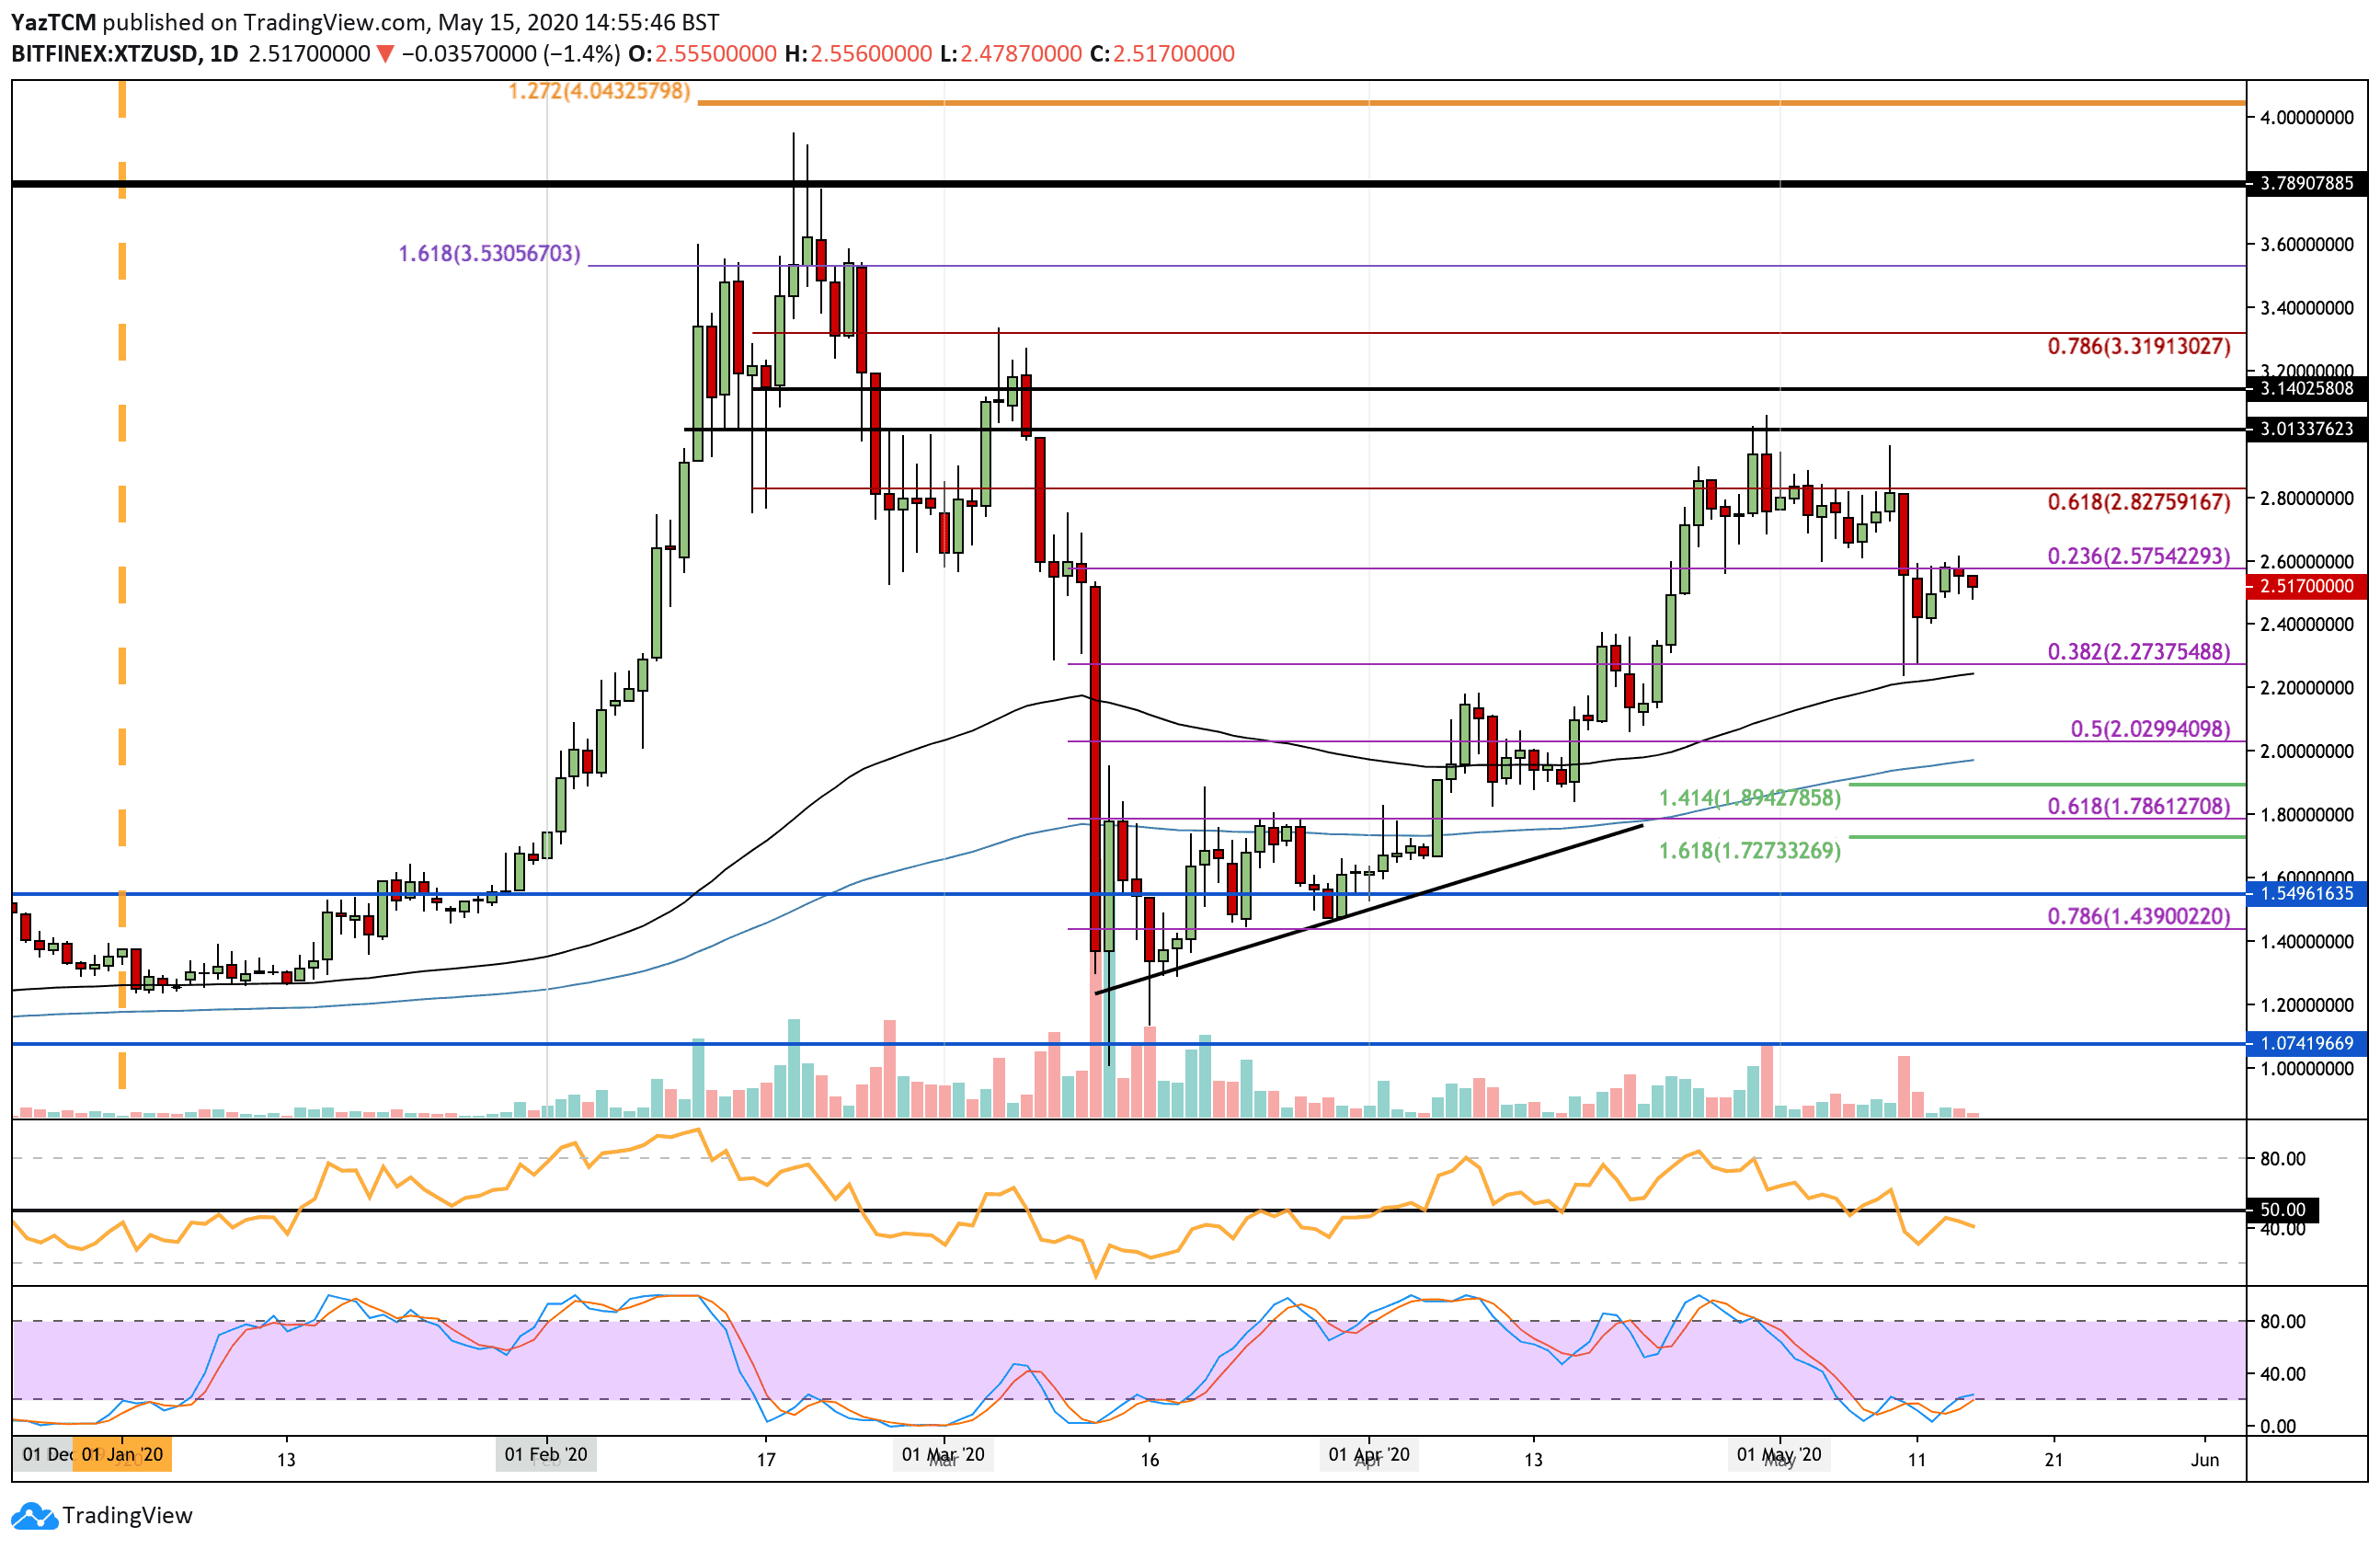
Tezos saw a sharp 8% price decline this week as the cryptocurrency drops from $2.80 to reach the $2.51 level. It had spiked even lower during the week but managed to find strong support at $2.27 (.382 Fib Retracement), where it rebounded higher. It is now struggling to overcome the resistance at $2.60 as it looks to head lower.
Moving forward, if the sellers push lower, support can be expected at $2.40 and $2.27 (.382 Fib Retracement & 100-days EMA). Beneath this, support lies at $2.00 (.5 Fib Retracement), $1.95 (200-days EMA), and $1.89 (downside 1.414 Fib Exension).
On the other side, if the buyers push above $2.60, resistance lies at $2.82 (bearish .618 Fib Retracement), $3.00, and $3.14. This is followed by added resistance at $3.14 and $3.31 (bearish .786 Fib Retracement).

Against BTC, Tezos has been dropping throughout May 2020. It fell from a high above 0.00032 BTC and reached 0.00027 BTC last week. This week, it fell further beneath this support as it approached the 0.00026 BTC level yesterday.
If the sellers push further beneath 0.00026 BTC, support lies at 0.000256 BTC (.886 Fib Retracement), 0.000246 BTC (200-days EMA), and 0.000241 (April low).
On the other hand, resistance is located at 0.00027 BTC, 0.00028 BTC (100-days EMA), and 0.000293 BTC.

Chainlink
Chainlink moved sideways this week as it drops by a minor 0.2% to reach the $3.76 level. The coin has been trading sideways between $4.05 and $3.46 for the entire period of May 2020 and must break this range to dictate the next direction for the coin.
If the buyers push higher, the first level of resistance lies at $4.05 (1.272 Fib Extension). Above this, resistance lies at $4.22 (bearish .786 Fib Retracement), $4.34, and $4.54 (1.618 Fib Extension).
On the other side, if the sellers push beneath $3.75, support lies at $3.46 (.382 Fib Retracement). Beneath this, support lies at $3.22 (100-days EMA & .5 Fib Retracement), $3.00 (.618 Fib Retracement), and $2.90 (200-days EMA).

Against BTC, LINK has been falling this week as it drops from 0.00044 BTC to break beneath the 100-days EMA at 0.000404 BTC and reach the current 0.000395 BTC level.
If the sellers push beneath 0.00039 BTC, support lies at 0.000372 (.786 Fib Retracement), 0.000366 BTC, and 0.00036 BTC (200-days EMA). Added resistance lies at 0.000352 BTC and 0.000342 BTC.
Alternatively, if the bulls push higher, resistance lies at 0.00040 BTC (100-days EMA). Above this, resistance is located at 0.00042 BTC, 0.00044 BTC, and 0.000451 BTC.

