BitcoinBitcoin managed to increase by around 8% over the past 7-days of trading as the cryptocurrency climbed above crucial resistance at ,800 today. Bitcoin had actually been trading within an ascending triangle and bounced from the lower boundary of this pattern 5-days ago, which allowed it to break above the upper boundary at ,800.Note: Today’s candle has still not closed, so it is not fully confirmed if this is a real breakout.From above, the first level of resistance lies at ,000. Above this, resistance lies at ,185 (bearish .5 Fib Retracement), ,500, and ,700 (100-days EMA). Beyond this, added resistance is located at ,000 (bearish .618 Fib Retracement) and ,100 (200-days EMA).On the other side, the first level of support is located at ,800. Beneath this, support
Topics:
Yaz Sheikh considers the following as important: Bitcoin (BTC) Price, BTC Analysis, EOS Price, ETH Analysis, Ethereum (ETH) Price, Market Updates, Price Analysis, Ripple (XRP) Price, Tezos (XTZ) Price, XRP Analysis
This could be interesting, too:
Chayanika Deka writes XRP, SOL, and ADA Inclusion in US Crypto Reserve Pushes Traders on Edge
Chayanika Deka writes Why Arthur Hayes Is Bullish on Bitcoin Under Trump’s Economic Strategy
Mandy Williams writes Why the Bitcoin Market Is Stuck—and the Key Metric That Could Change It: CryptoQuant CEO
Jordan Lyanchev writes Liquidations Top 0M as Bitcoin Falls K, Reversing Trump-Driven Rally
Bitcoin
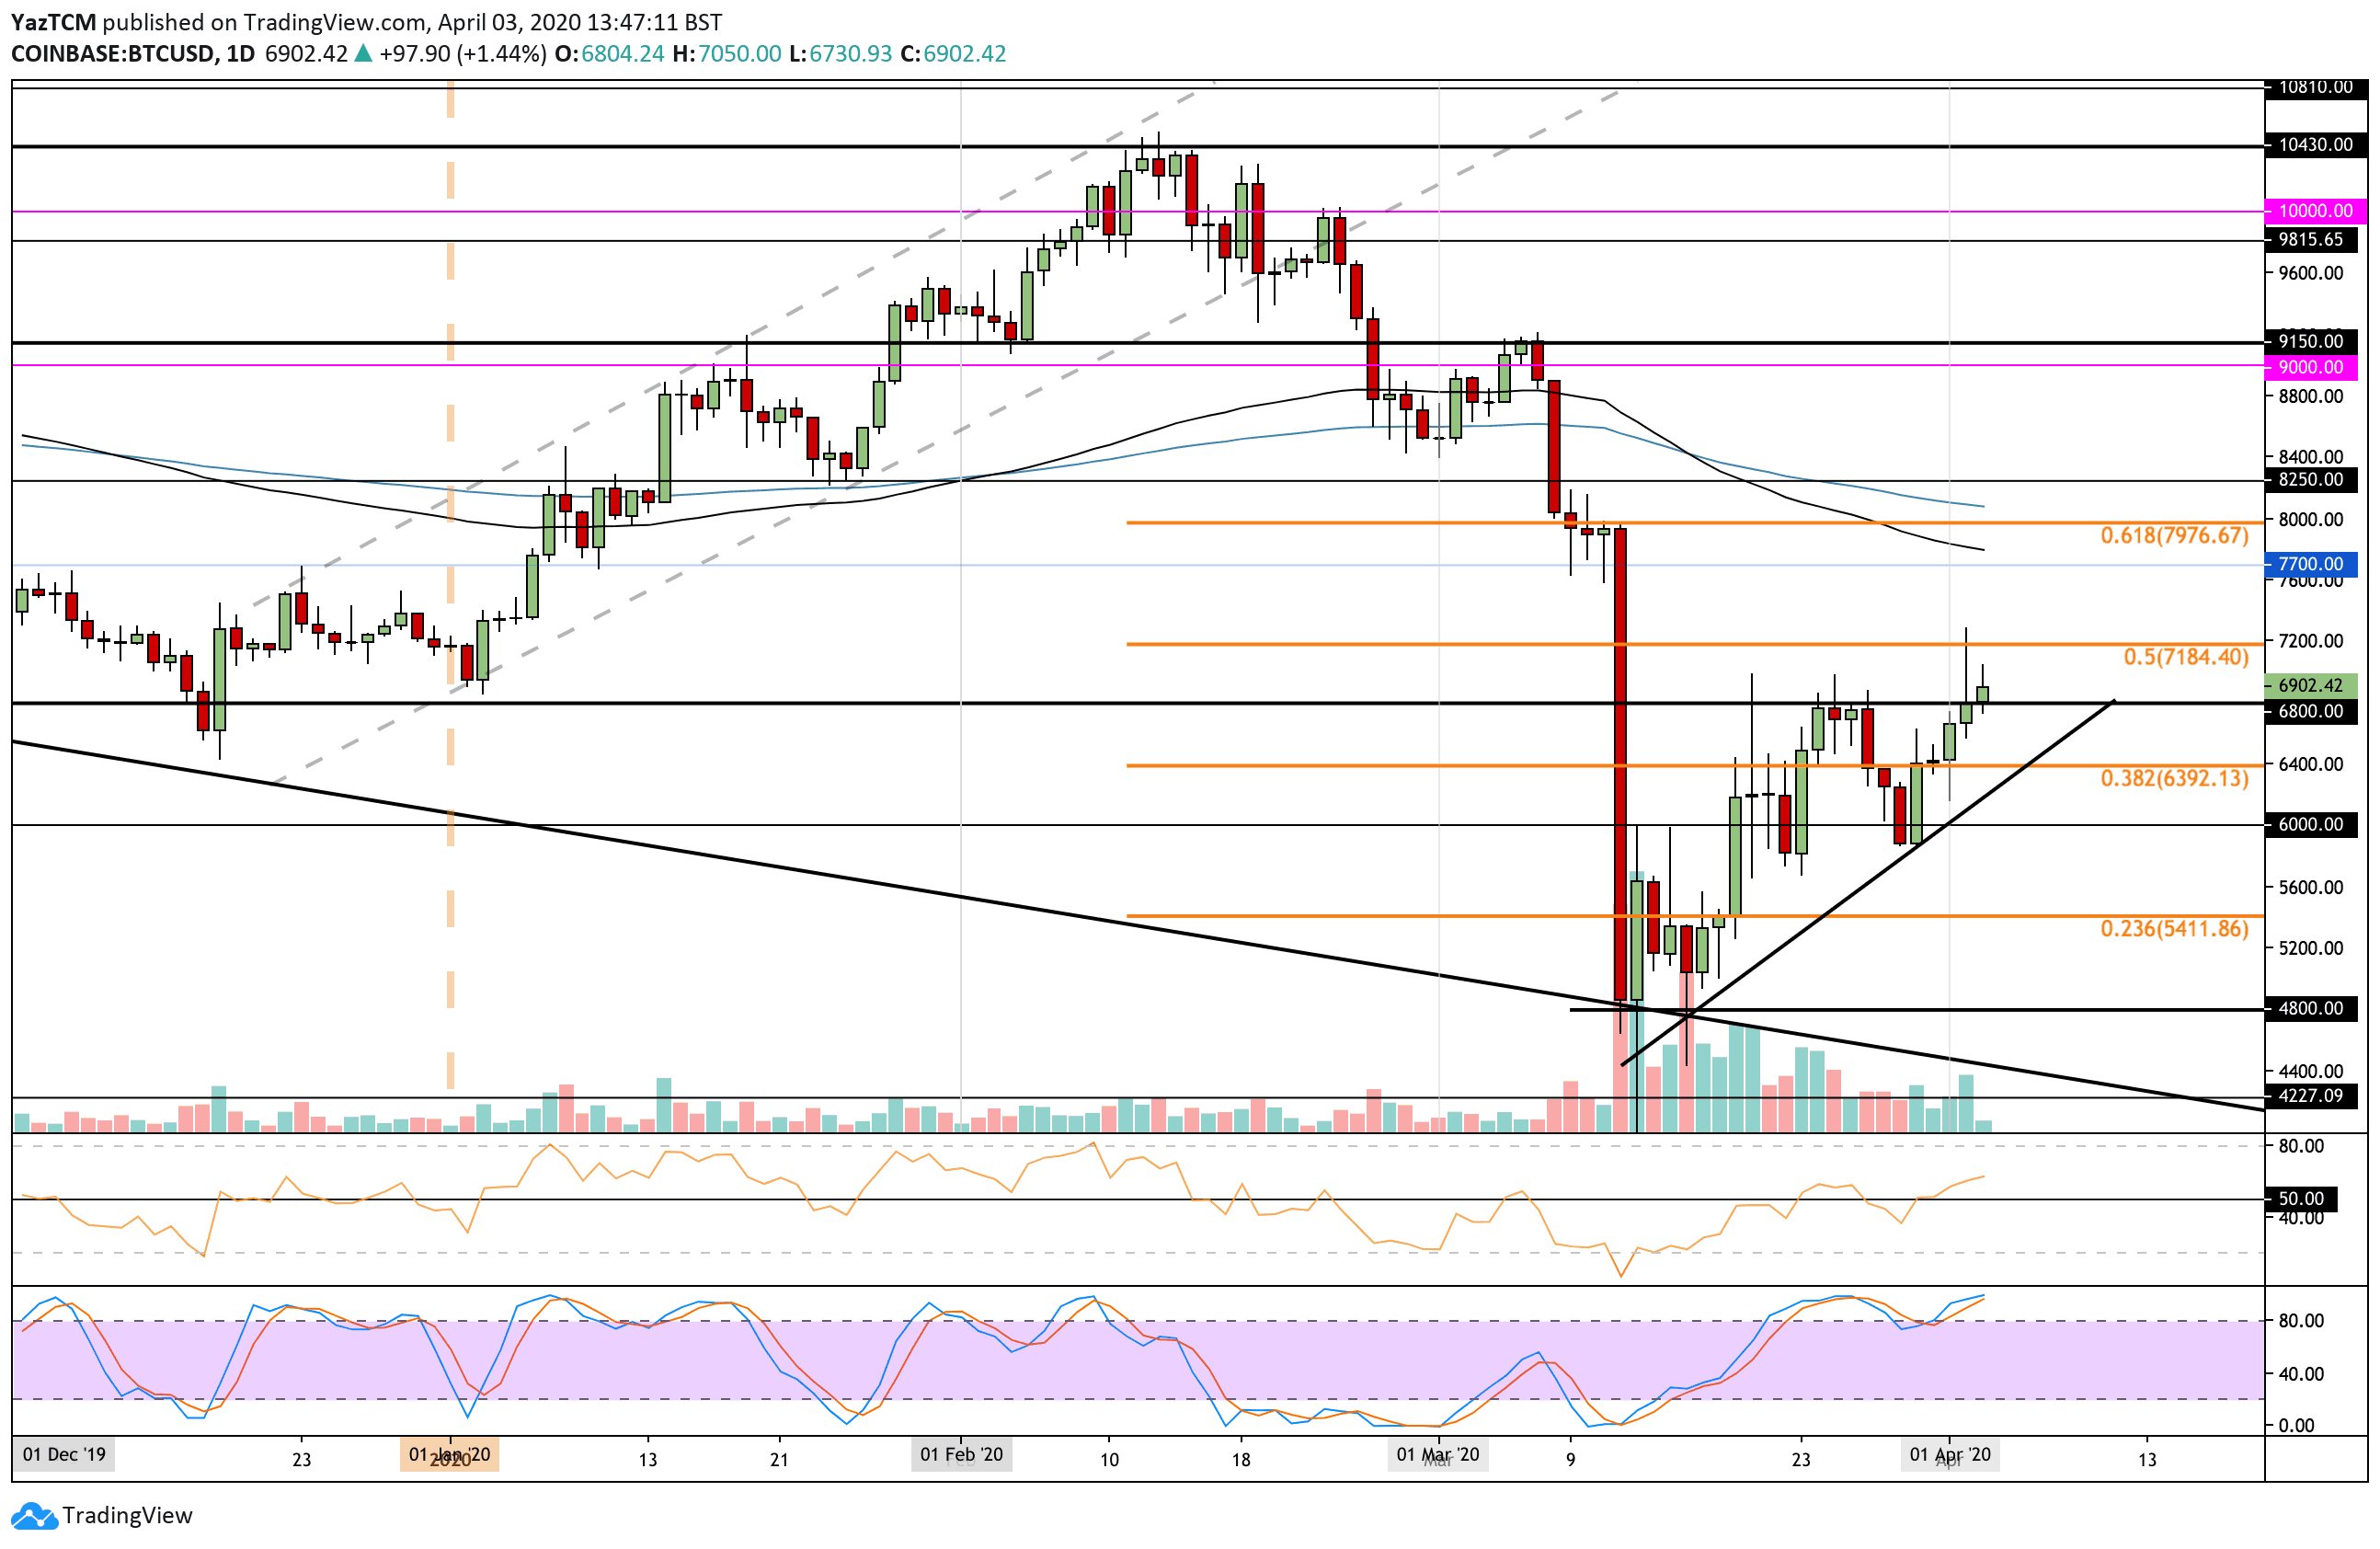
Bitcoin managed to increase by around 8% over the past 7-days of trading as the cryptocurrency climbed above crucial resistance at $6,800 today. Bitcoin had actually been trading within an ascending triangle and bounced from the lower boundary of this pattern 5-days ago, which allowed it to break above the upper boundary at $6,800.
Note: Today’s candle has still not closed, so it is not fully confirmed if this is a real breakout.
From above, the first level of resistance lies at $7,000. Above this, resistance lies at $7,185 (bearish .5 Fib Retracement), $7,500, and $7,700 (100-days EMA). Beyond this, added resistance is located at $8,000 (bearish .618 Fib Retracement) and $8,100 (200-days EMA).
On the other side, the first level of support is located at $6,800. Beneath this, support lies at $6,400, the lower boundary of the triangle, and $6,000.
Ethereum
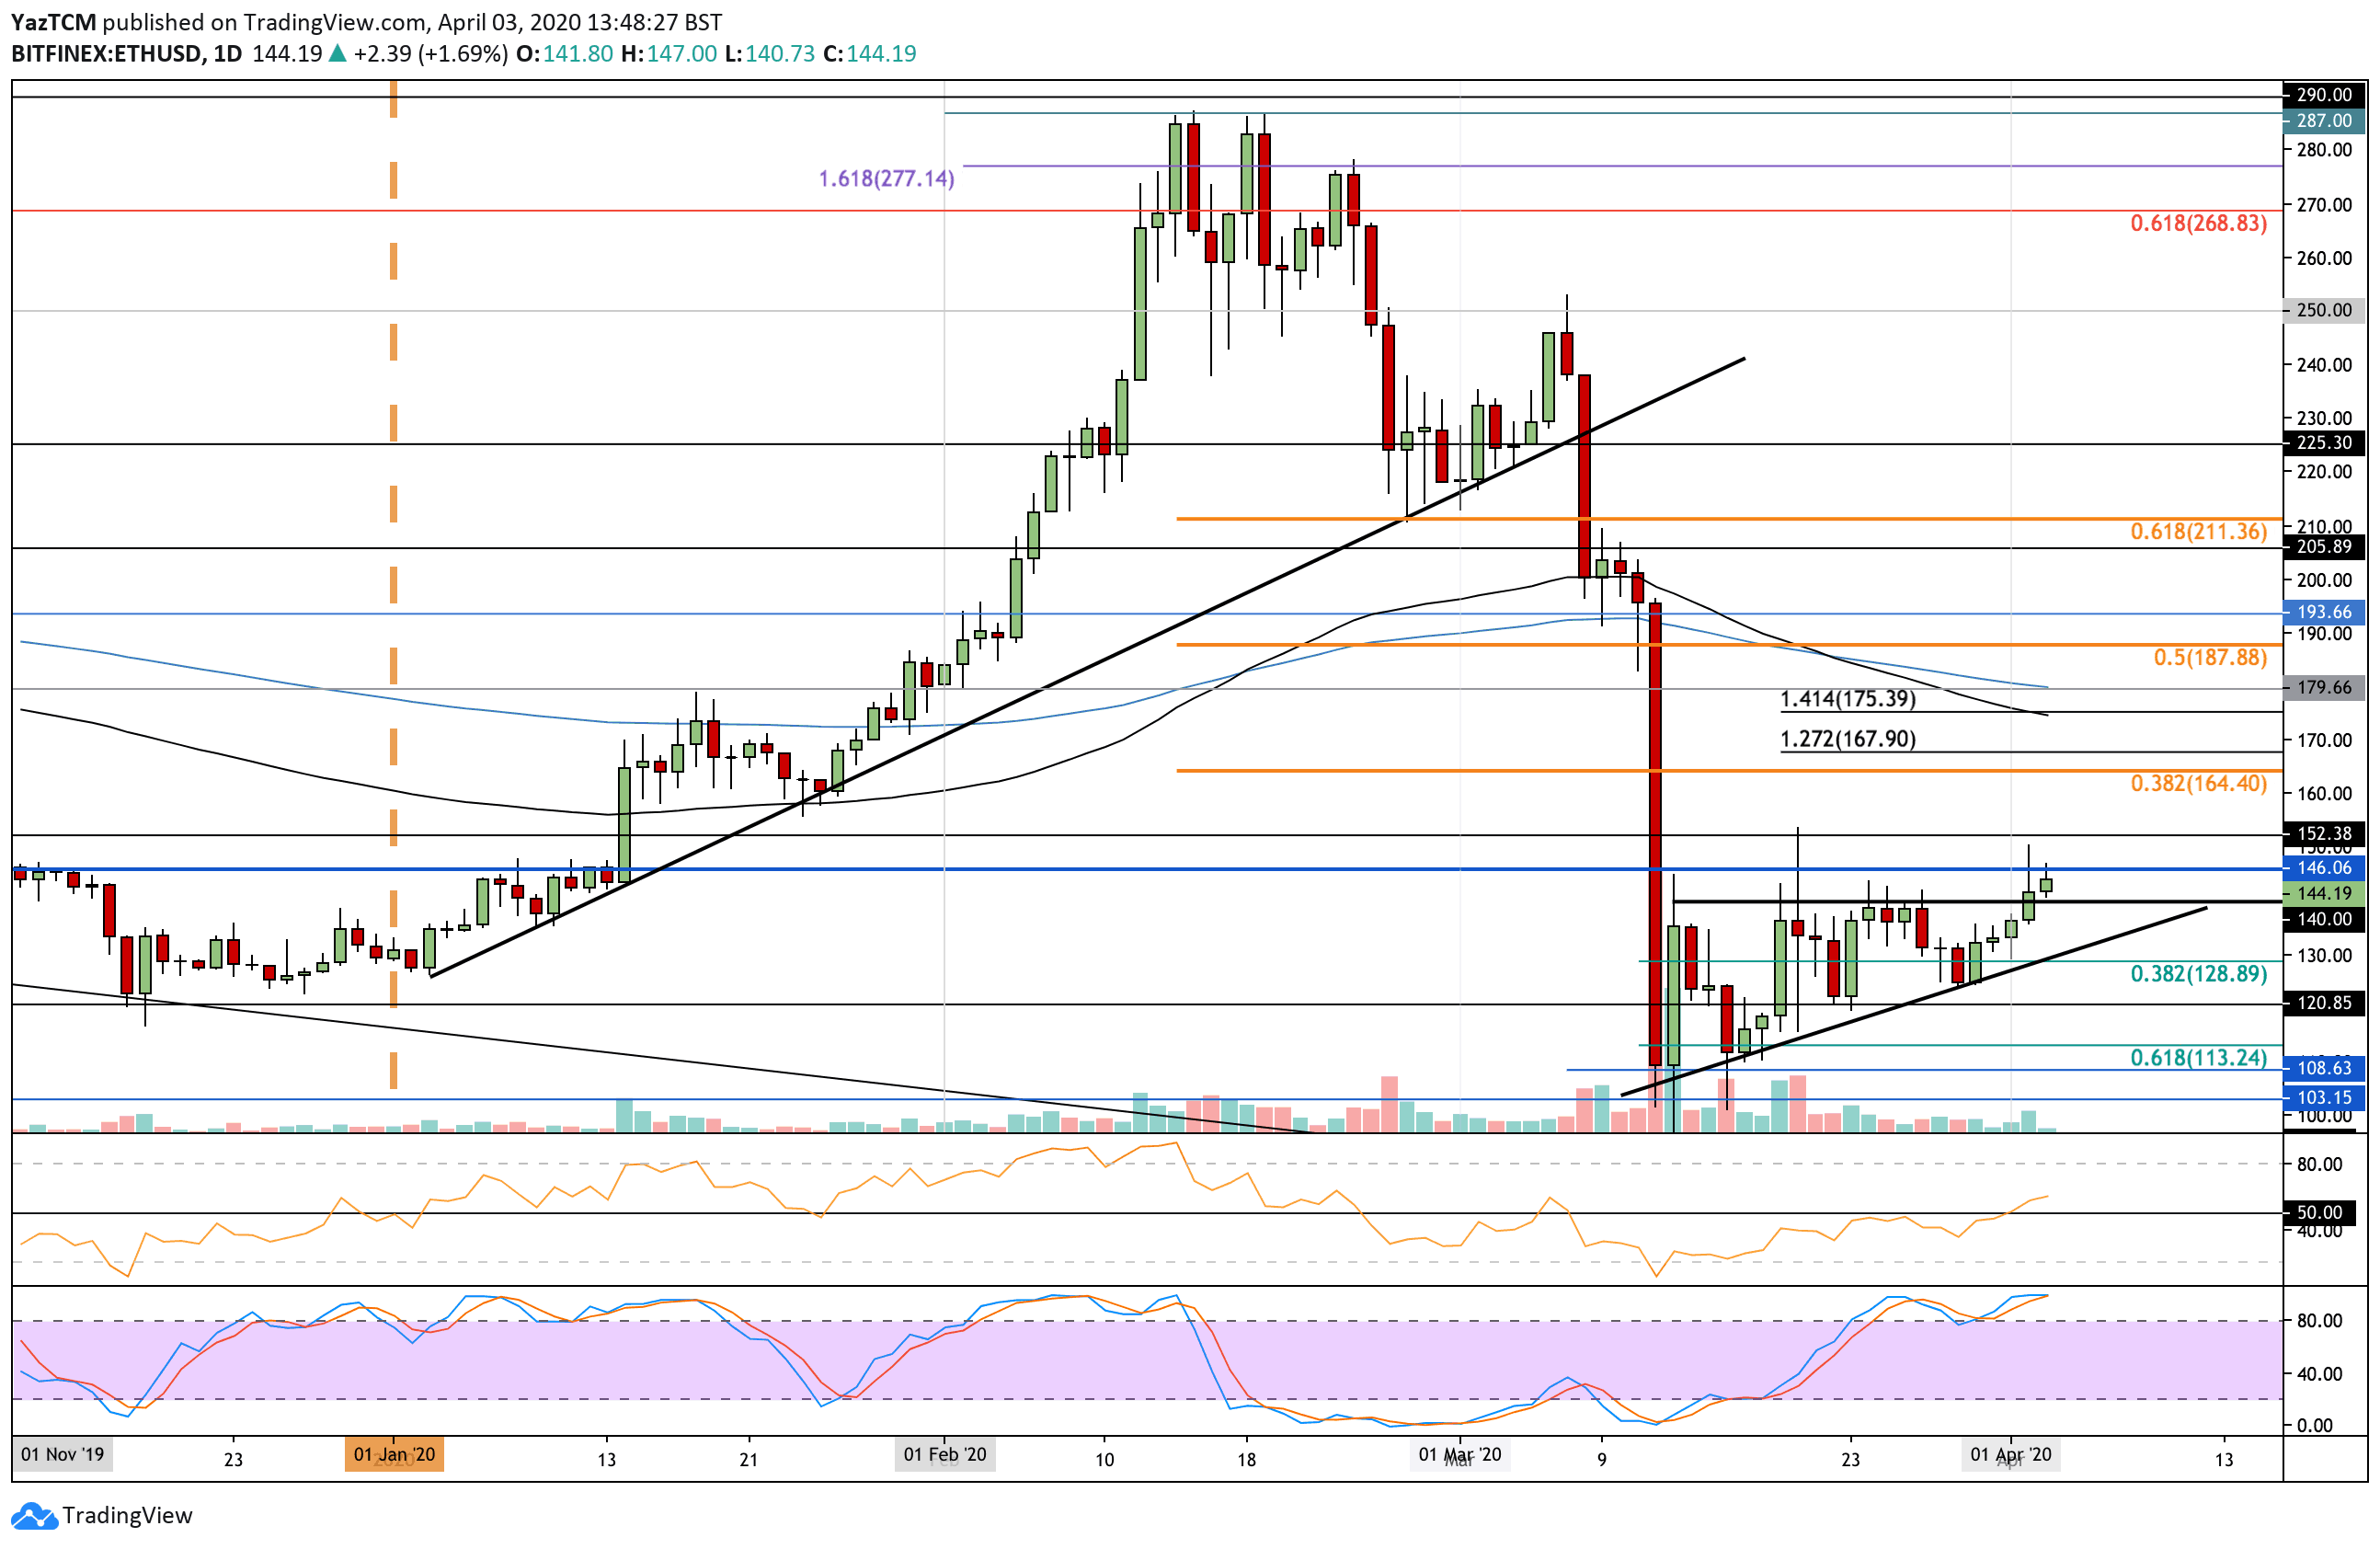
Ethereum went on to drop into the lower boundary of the triangle this week but managed to rebound from here to surge by a total of 15% over the past 5-days of trading. It recently broke above the upper boundary at $140 to reach the current $145 price.
Toward the upside, resistance is located at $146, $152, and $165 (bearish .382 Fib Retracement). Following this, resistance lies at $175 (100-days EMA) and $180 (200-days EMA).
On the other side, support lies at $140. Beneath this, support lies at $135, the rising trend line, $125, and $120.
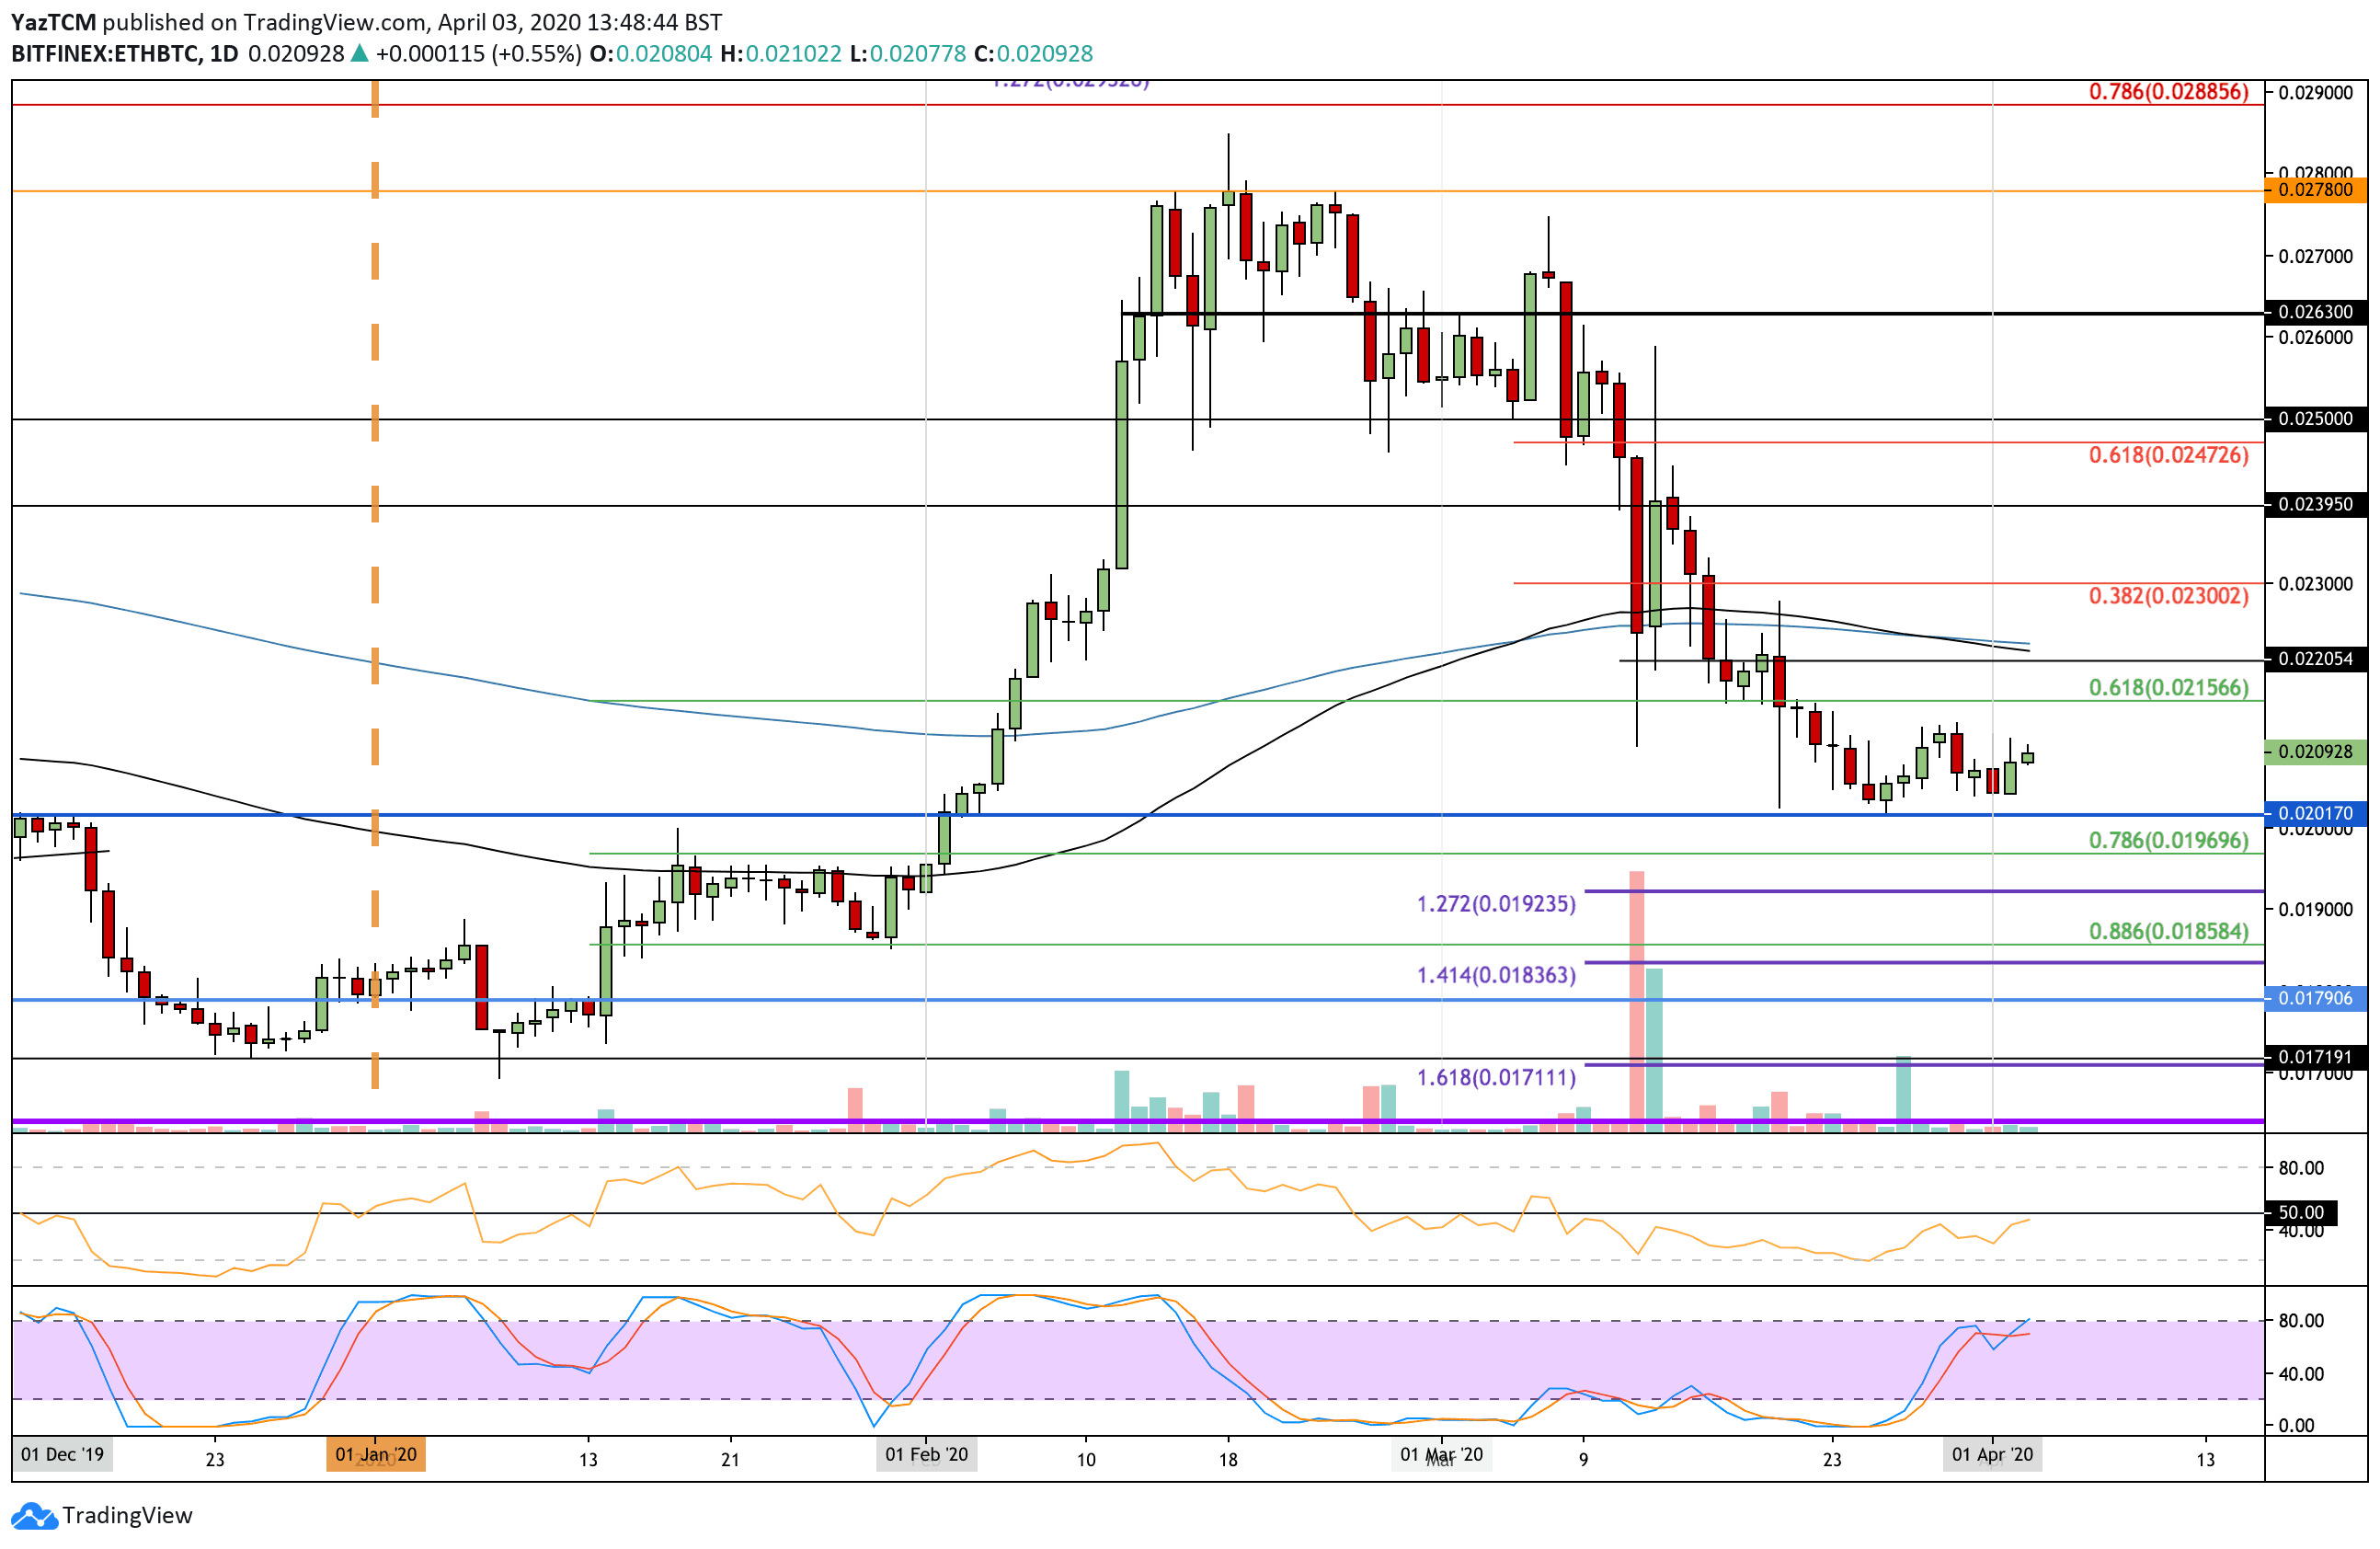
Against Bitcoin, ETH traded sideways this week as it remains rangebound between 0.0213 BTC and 0.0203 BTC. The buyers are slowly gathering momentum as the RSI starts to rise, but it still is beneath the 50 level.
From below, support lies at 0.0203 BTC, 0.0201 BTC, and 0.02 BTC. If it drops beneath 0.02 BTC, added support lies at 0.0196 BTC (.786 Fib Retracement) and 0.0192 BTC (downside 1.272 Fib Extension).
On the other side, resistance is expected at 0.0213 BTC. Above this, resistance lies at 0.0215 BTC, 0.0222 BTC (100-days and 200-days EMA’s), and 0.023 BTC (bearish .382 Fib Retracement).
Ripple
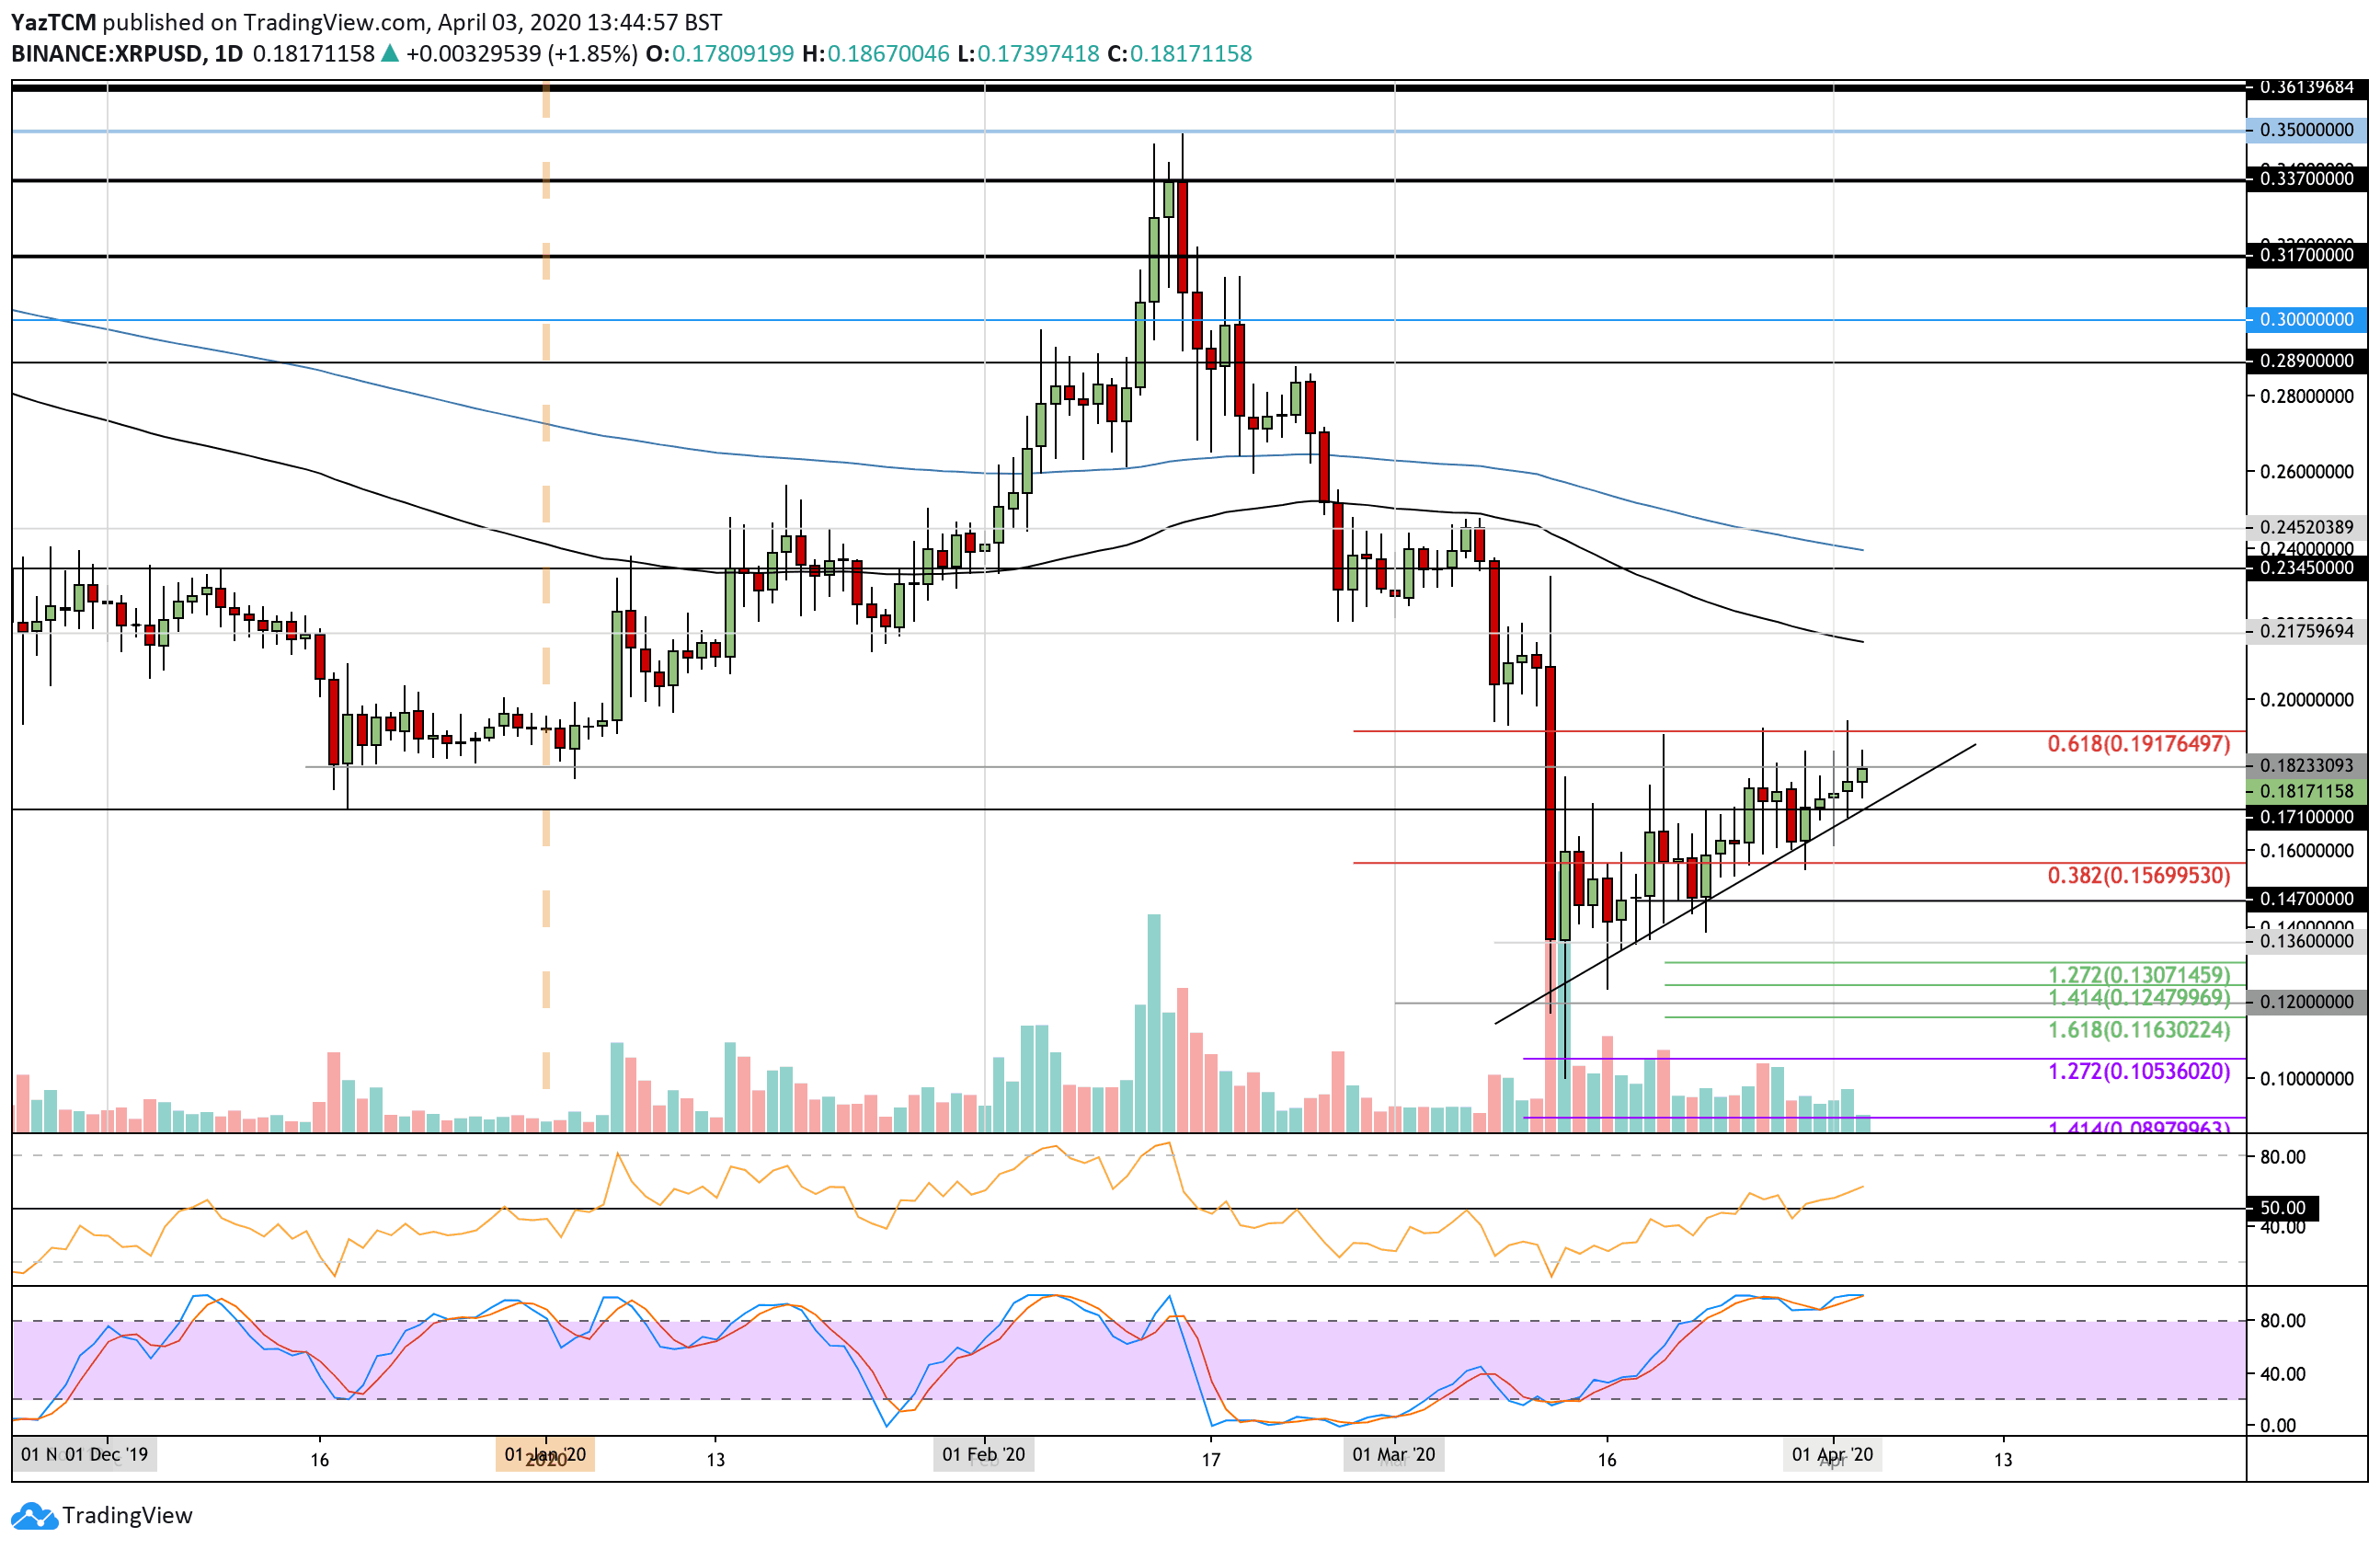
XRP increased by a small 4% this week after dropping back into the rising trend line and rebounding. It is now back above the $0.17 support to trade at the current $0.181 level as it struggles to break above $0.182.
From above, resistance lies at $0.191 (bearish .618 Fib Retracement), $0.2, and $0.215 (100-days EMA). Following this, resistance lies at $0.23 and $0.24 (200-days EMA).
From below, support is located at $0.171. Additional support lies at $0.16, $0.14, $0.136, and $0.13.
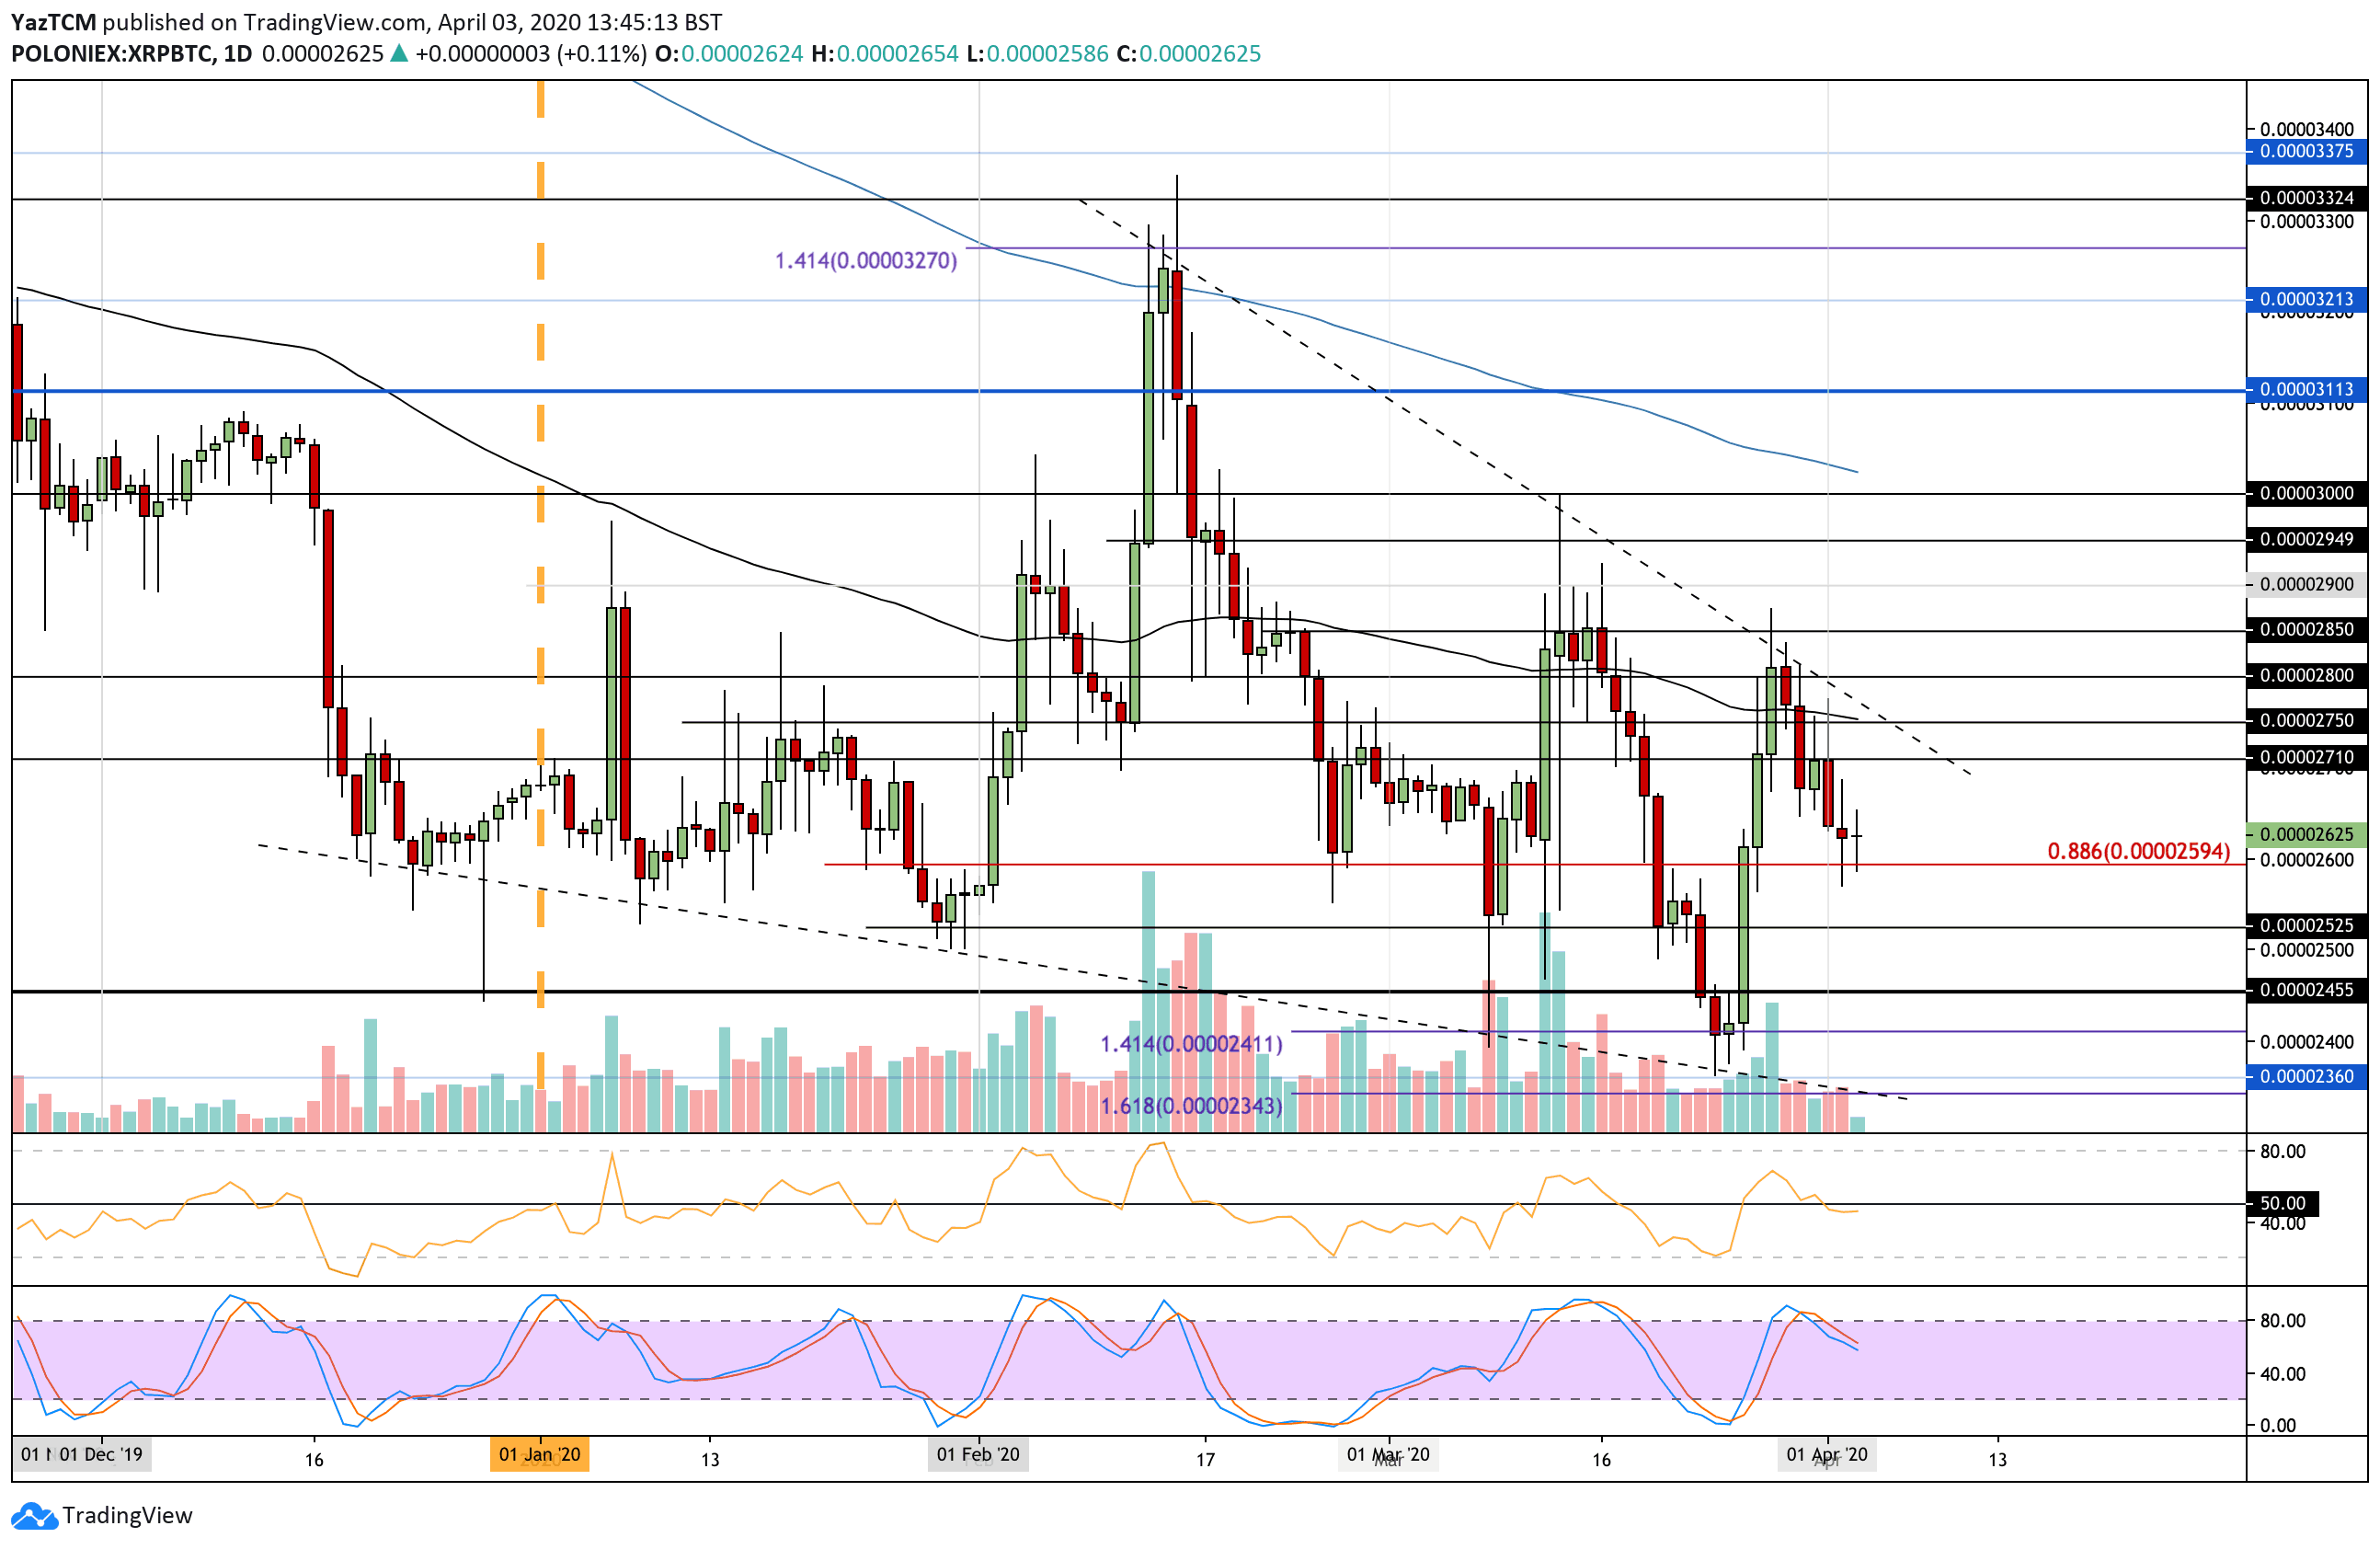
Against Bitcoin, XRP managed to increase as high as 2800 SAT this week but went on to fall further from here to reach the current trading level at 2625 SAT.
From below, the first level of support lies at 2600 SAT. Beneath this, support lies at 2525 SAT, 2500 SAT, 2455 SAT, and 2400 SAT.
On the other side, strong resistance lies at 2710 SAT. Above this, resistance lies at 2750 SAT (100-days EMA) and 2800 SAT.
EOS
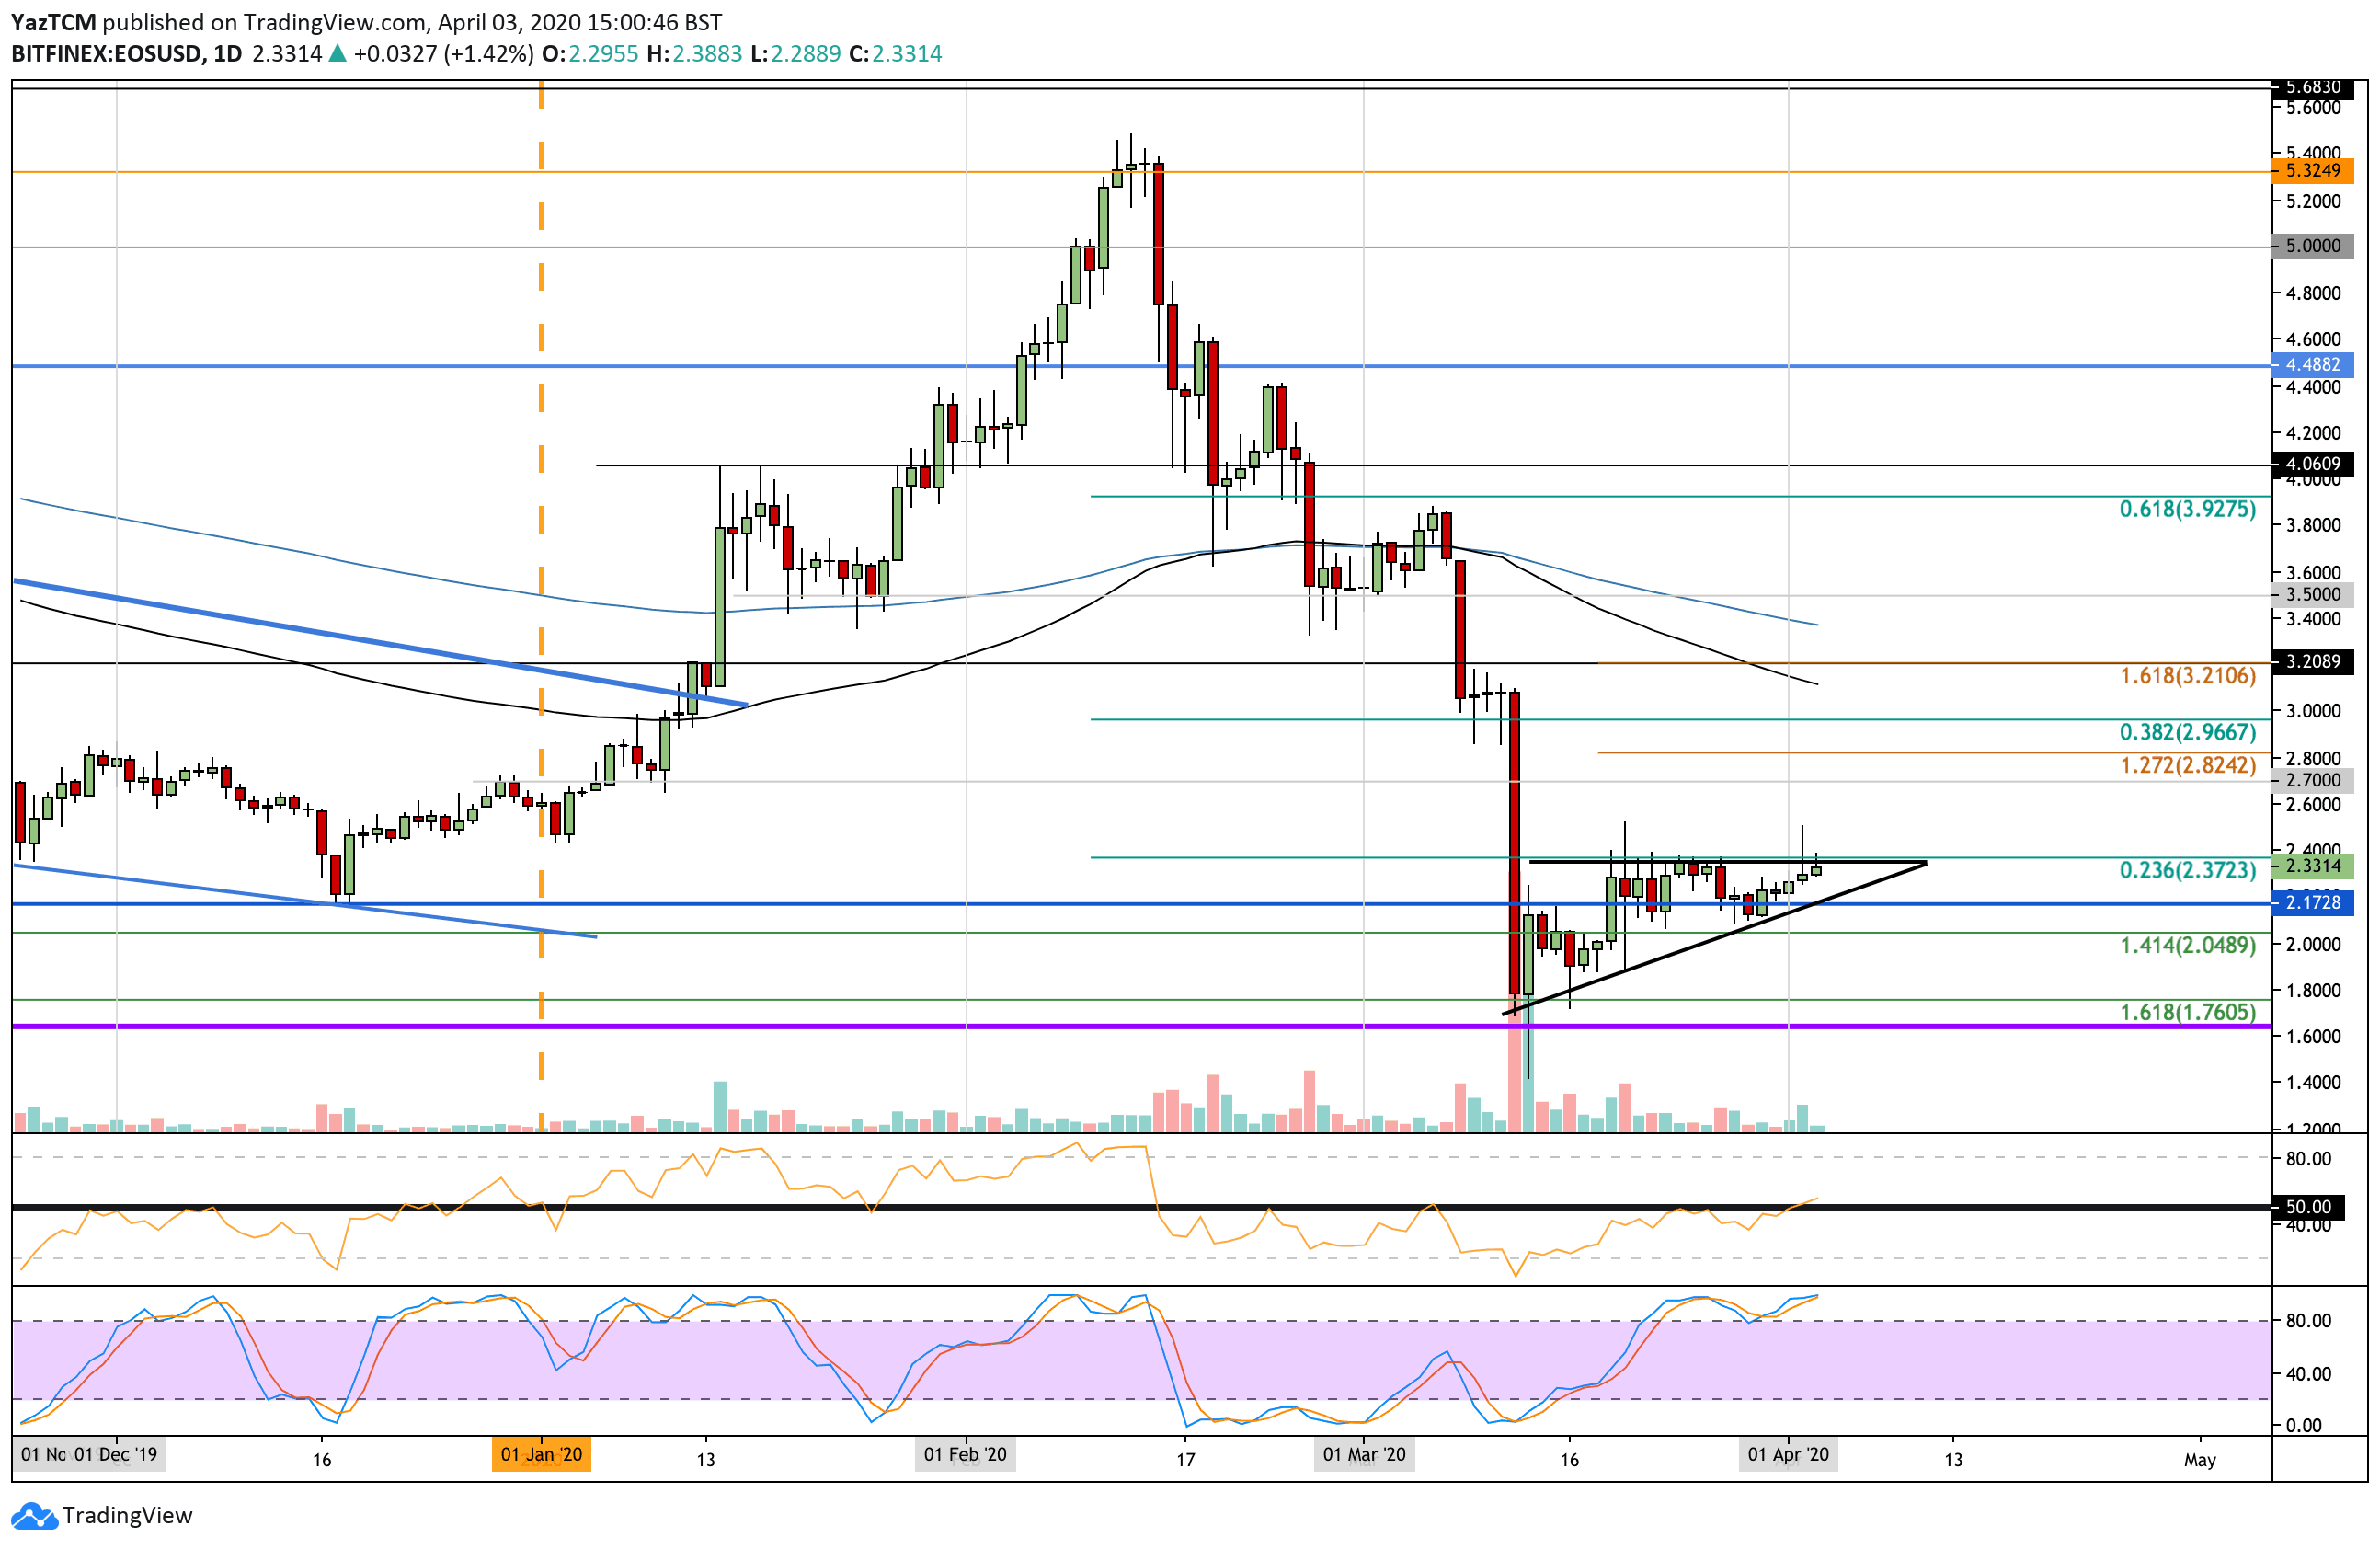
EOS has increased by around 8% over the past 5-days after rebounding from the lower boundary of its ascending triangle. It is currently trading at $2.33, where it is struggling to break the upper boundary as it continues to consolidate.
From above, the first level of resistance lies at the upper boundary of $2.37, which also a bearish .236 Fib Retracement. Beyond this, resistance lies at $2.50, $2.70, $2.82, and $3.00.
Toward the downside, the first level of support lies at the rising trend line. Beneath this, support lies at $2.17, $2.00, and $1.80.
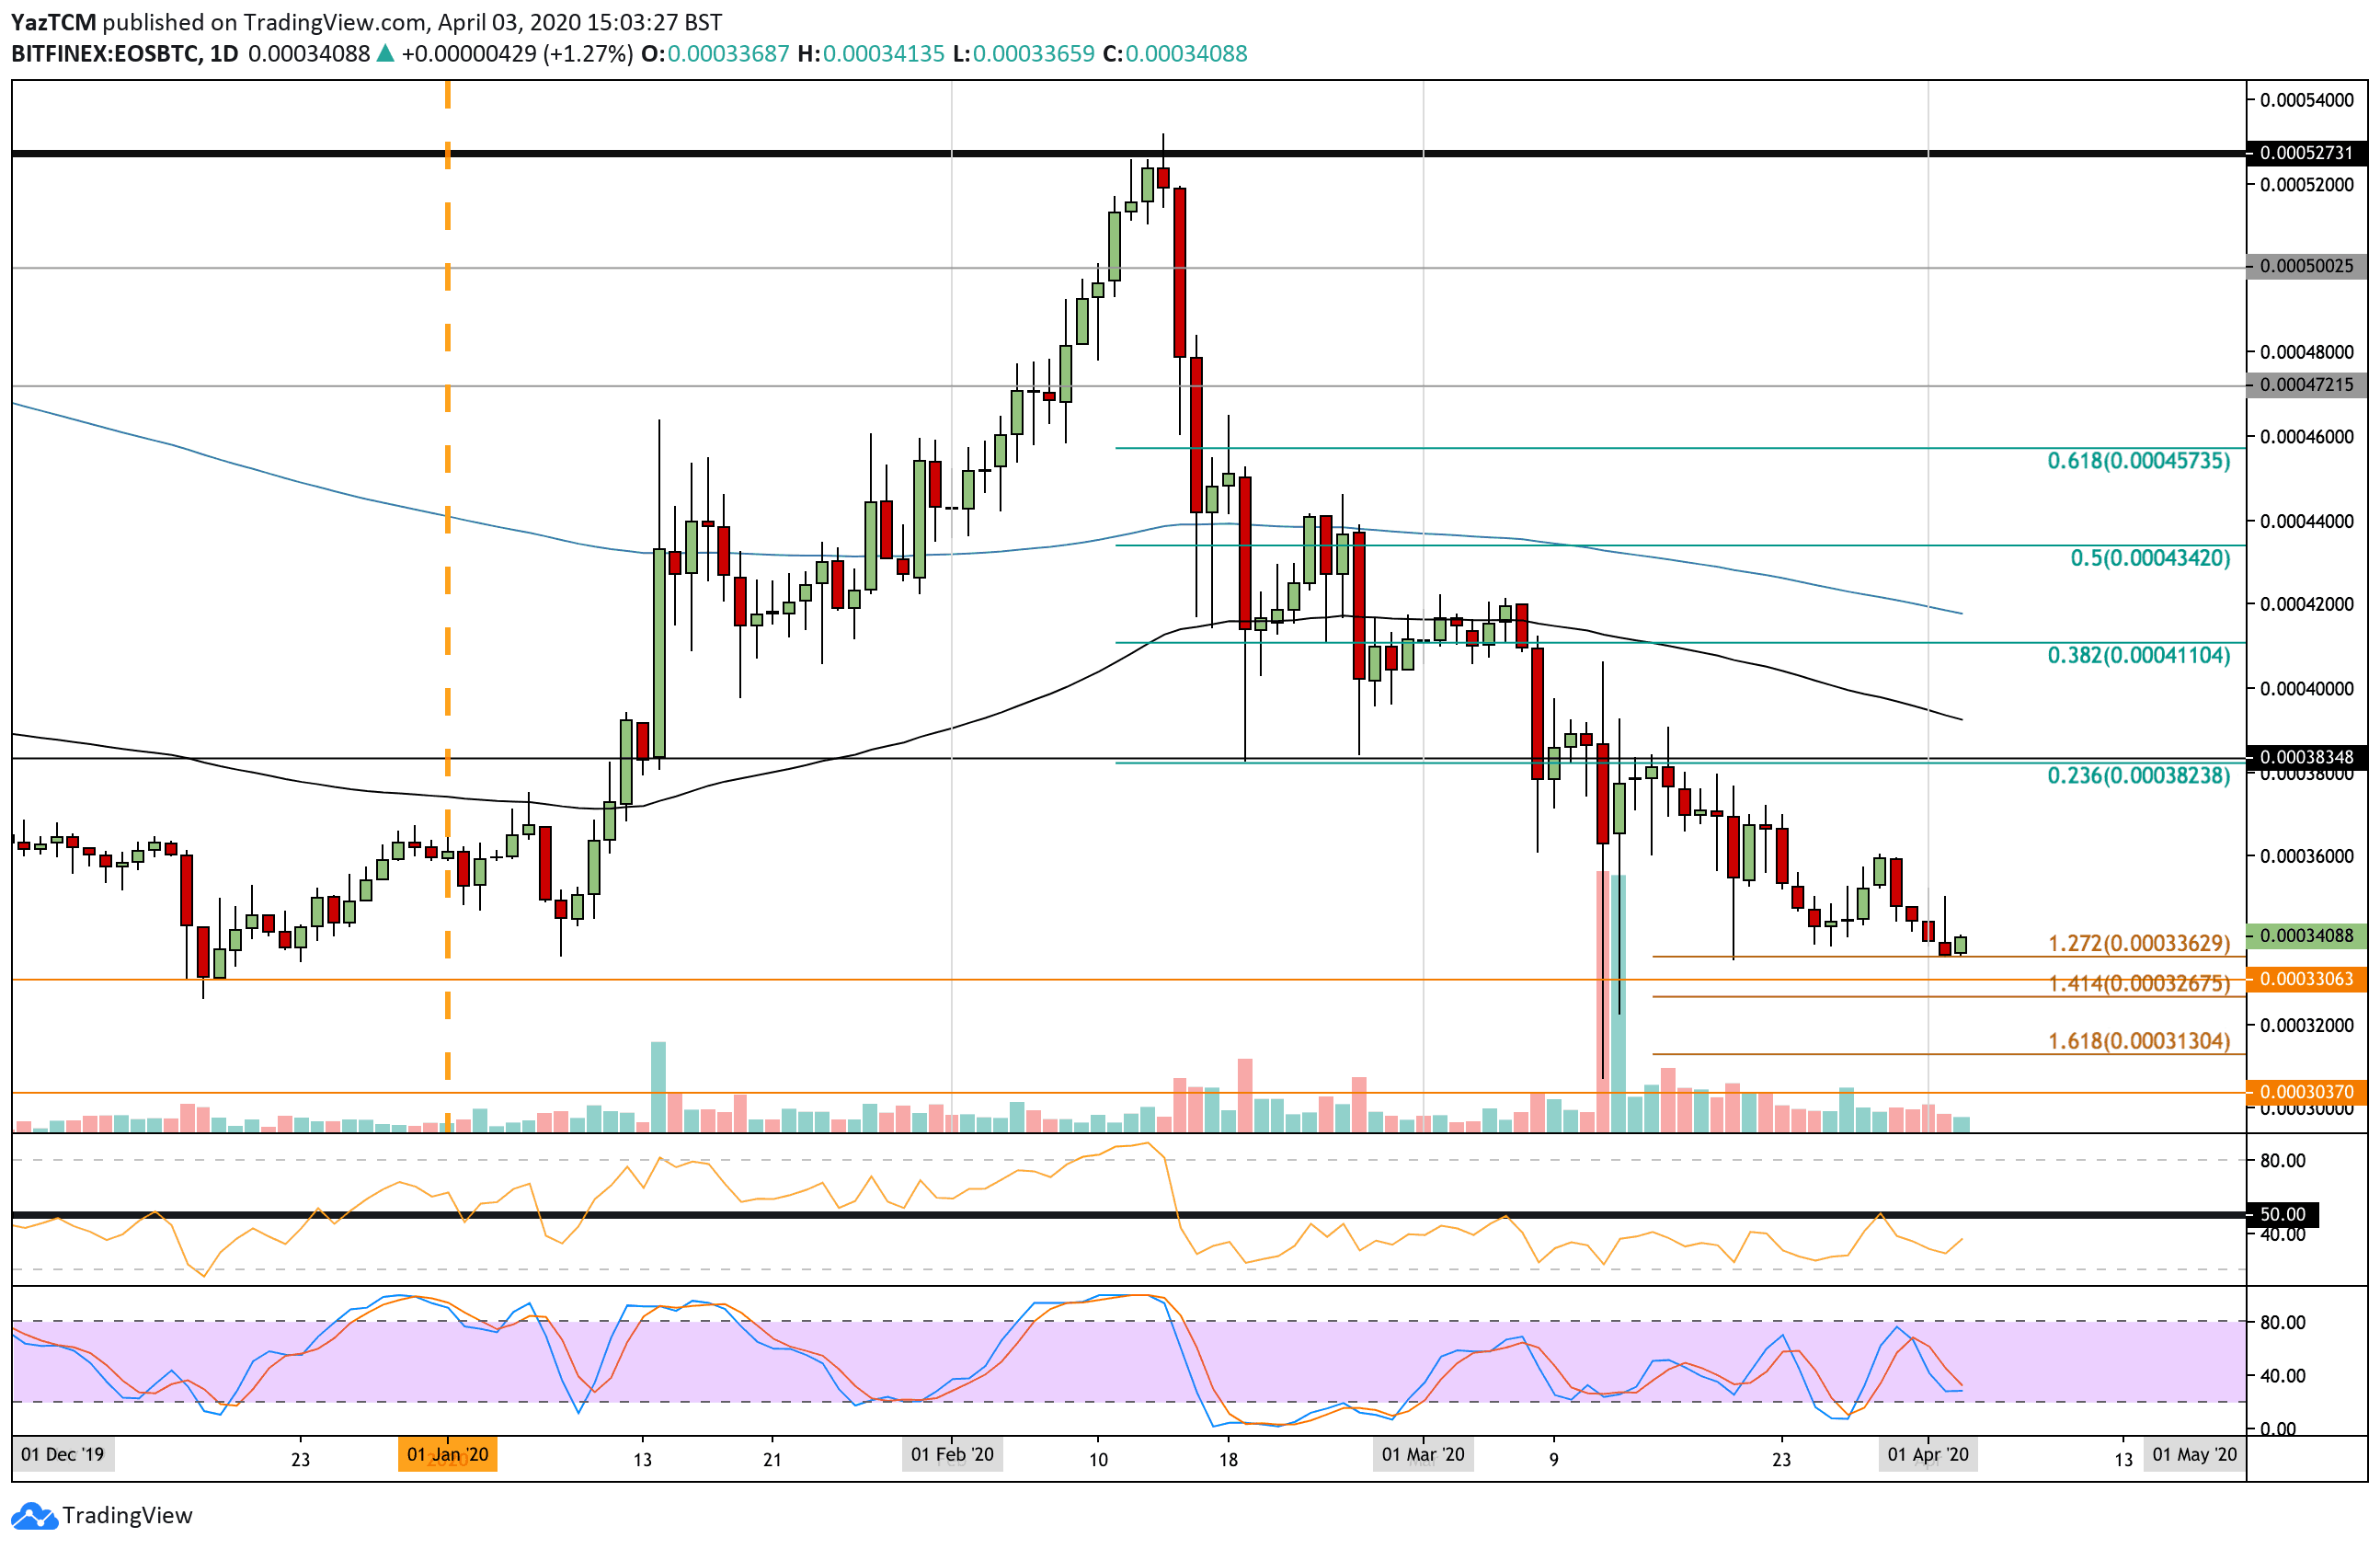
Against Bitcoin, EOS has been suffering quite badly after dropping by a total of 20% in March. It recently found support at a downside 1.272 Fib Extension at 0.000336 BTC, where it is attempting to rebound.
From above, the first level of resistance lies at 0.000365 BTC. Above this, resistance lies at 0.00038 BTC (bearish .236 Fib Retracement), 0.00040 BTC (100-days EMA), and 0.000411 BTC (bearish .382 Fib Retracement).
From below, support lies at 0.000336 BTC, 0.00033 BTC, and 0.000326 BTC. Beneath this, added support lies at 0.000313 BTC and 0.0003 BTC.
Tezos
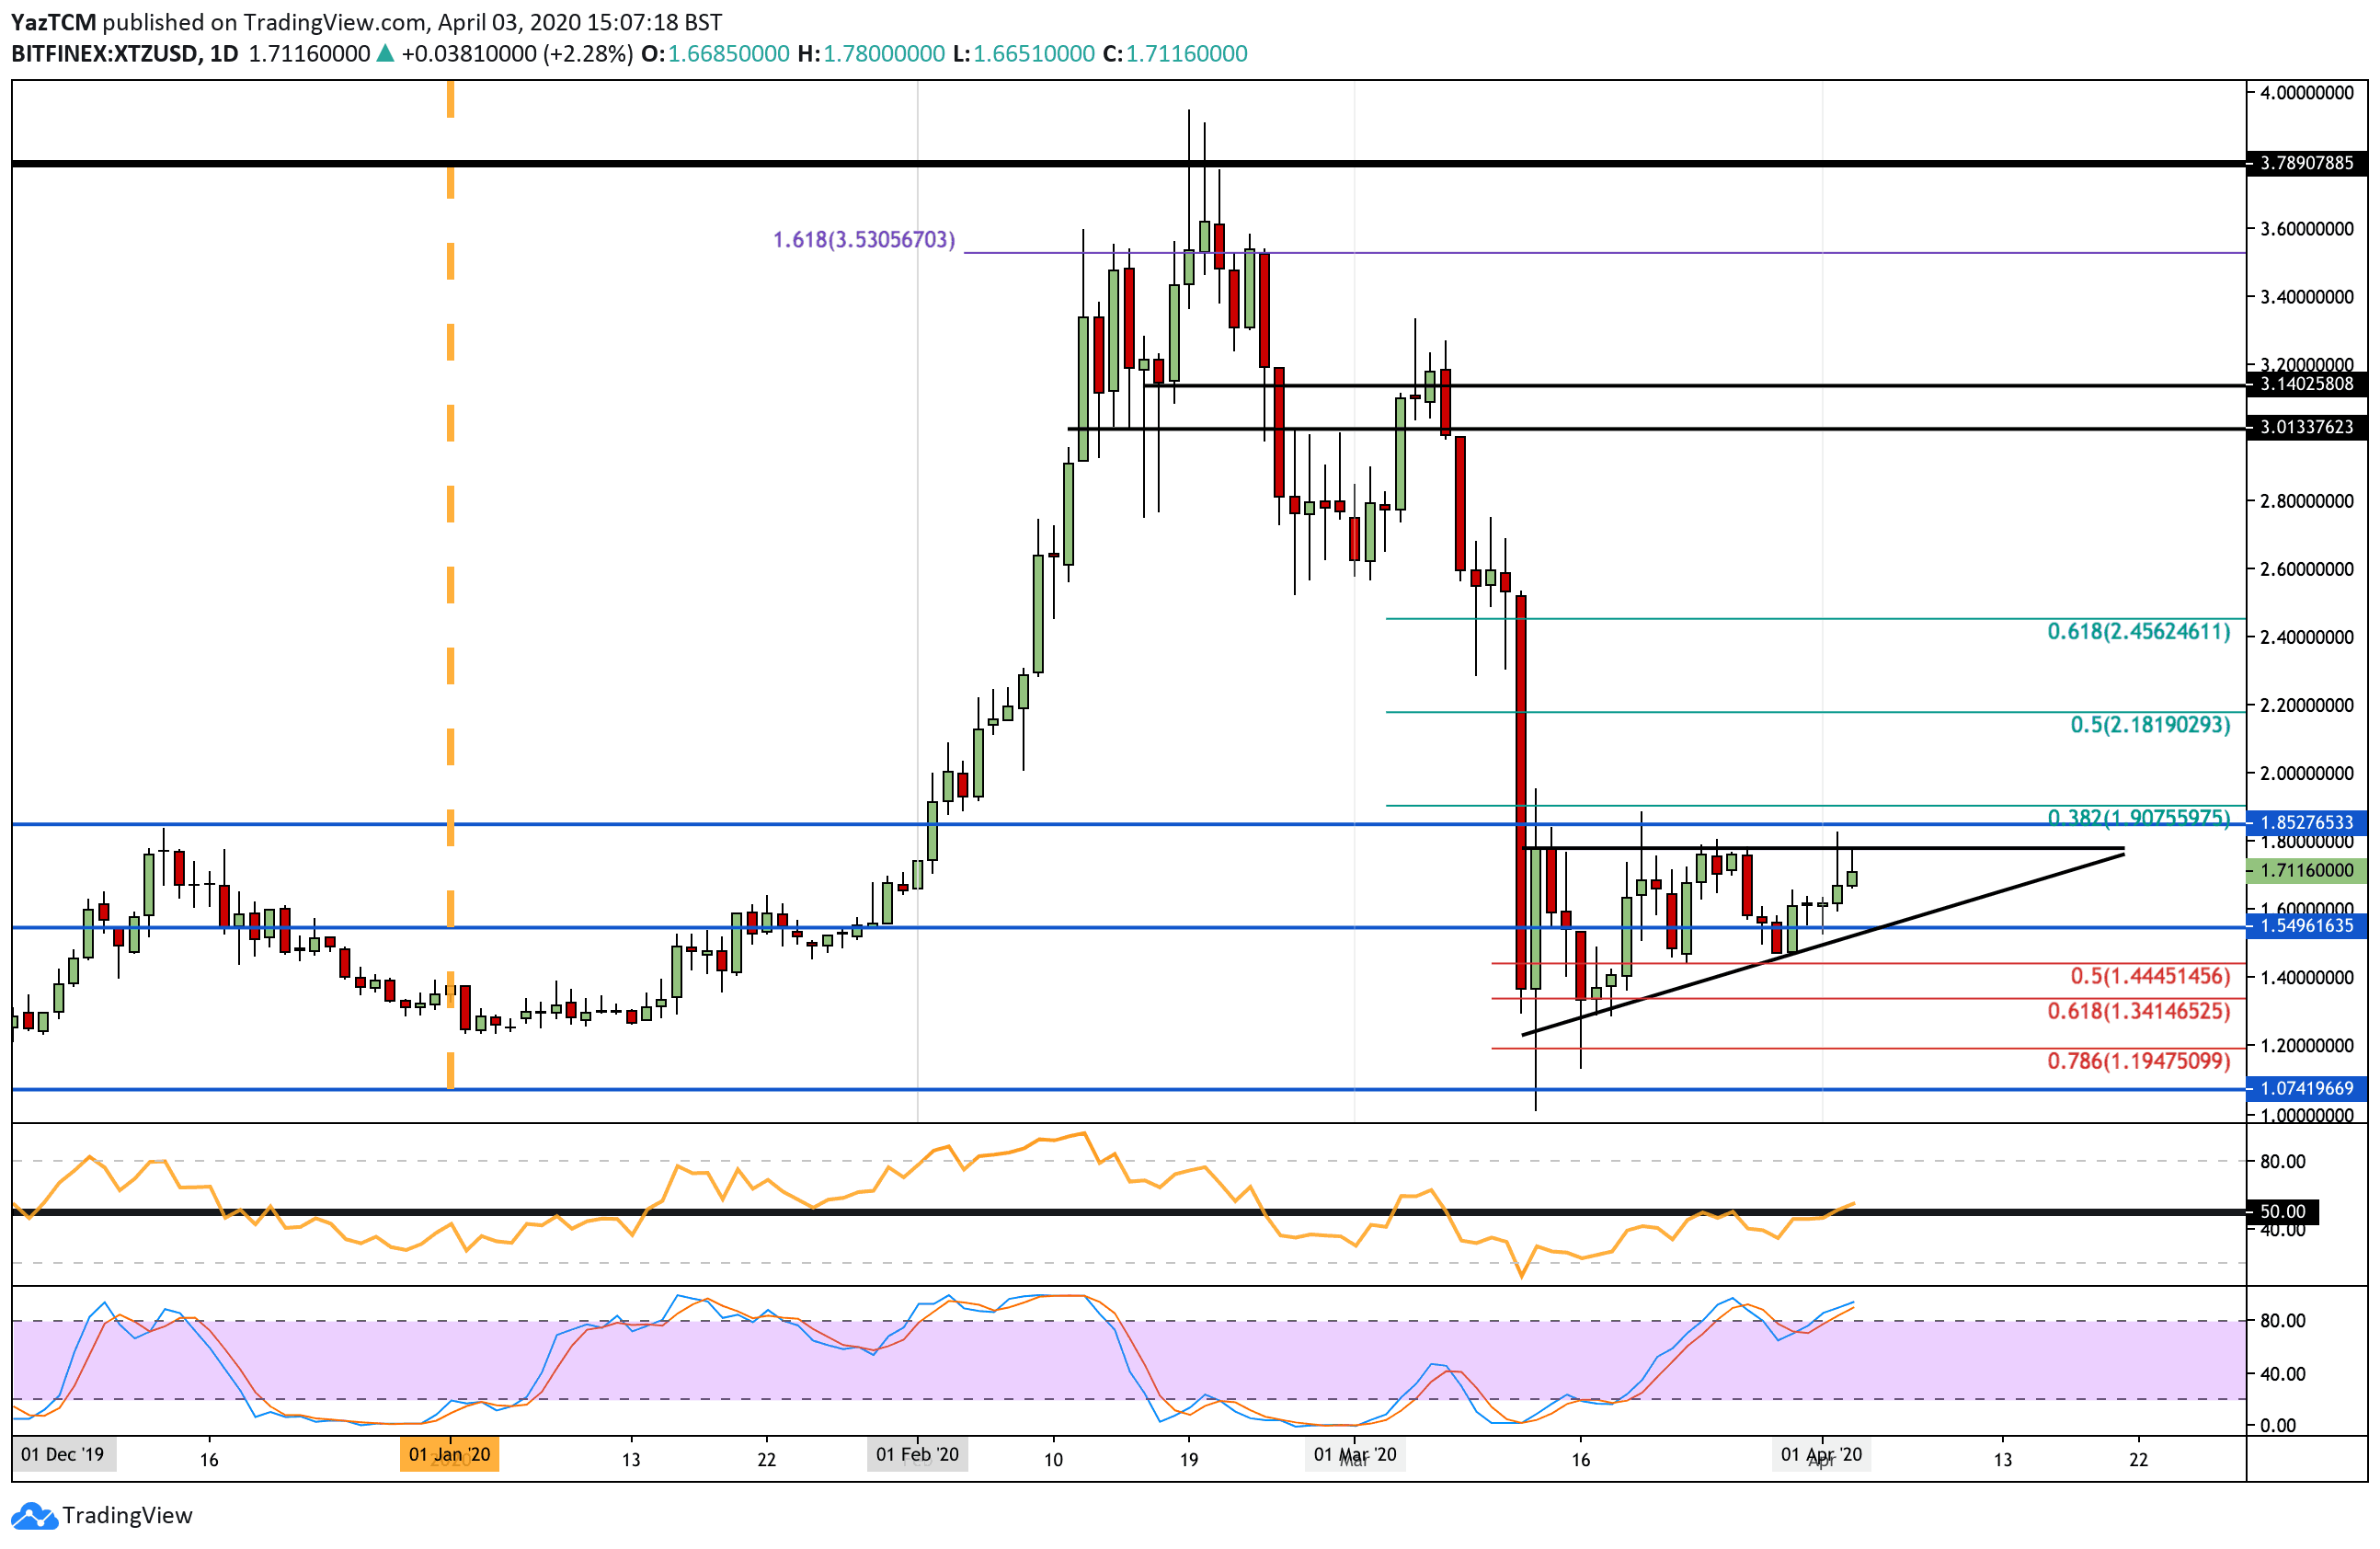
Tezos saw a 17% price increase after rebounding from the lower boundary of its ascending triangle at around $1.46 to reach the current trading level of $1.71. It still faces strong resistance at the upper boundary at $1.80.
If the bulls break $1.80, resistance lies at $1.90 (bearish .382 Fib Retracement), and $2.00. Above this, resistance lies at $2.18 (bearish .5 Fib Retracement) and $2.45.
Toward the downside, support lies at $1.60 and $1.55. Beneath the triangle, added support is found at $1.44 (short term .5 Fib Retracement) and $1.34.
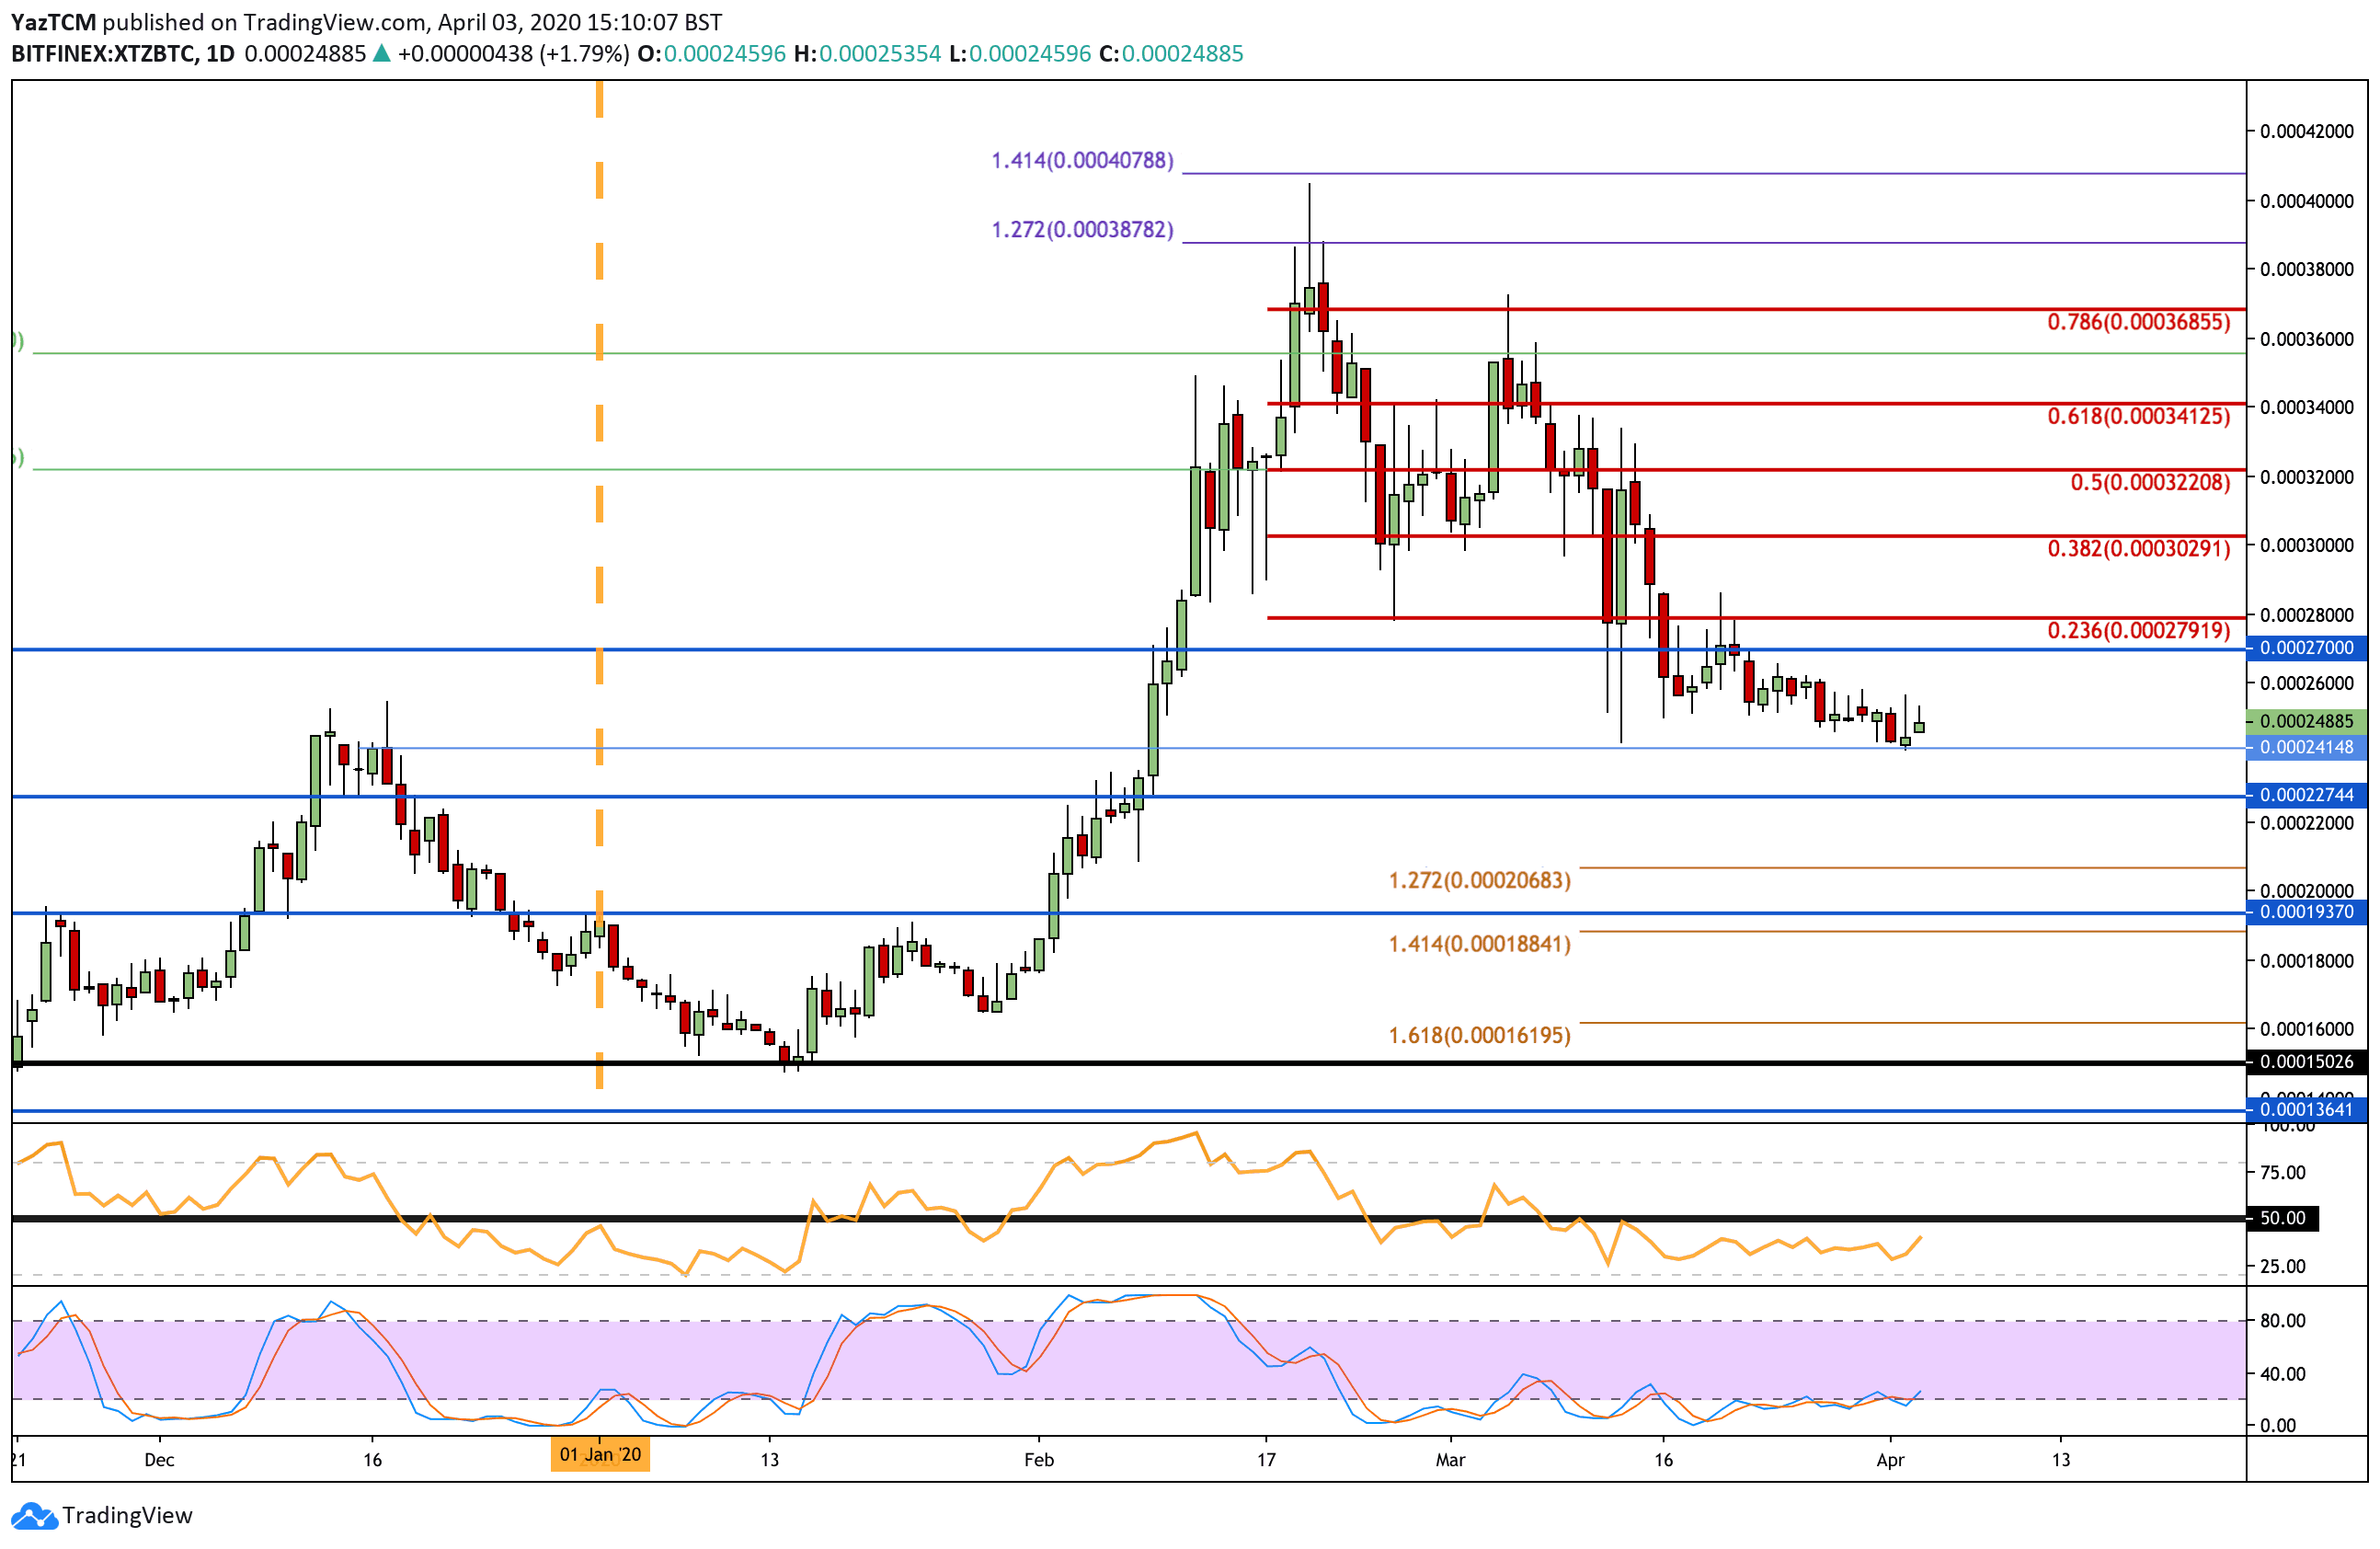
Against Bitcoin, Tezos recently found support at the 0.000241 BTC level as it climbs toward 0.000248 BTC. It is still strongly bearish but has found some form of stability over the past 2-weeks.
From above, strong resistance lies at 0.00027 BTC and 0.00028 BTC (bearish .236 Fib Retracement). This is followed by resistance at 0.00030 BTC (bearish .382 Fib Retracement) and 0.000322 BTC.
From below, strong support lies at 0.00024 BTC. Beneath this, support lies at 0.00022 BTC, 0.000206 BTC, and 0.000193 BTC.
