Bitcoin’s price went on a rollercoaster over the past week but still remains trapped beneath the December resistance at ,686. The cryptocurrency fell below ,000 to find support at ,885. However, after reaching this level, Bitcoin bounced higher as it now trades around ,319.If the bulls continue to drive Bitcoin higher and push it above ,400, immediate resistance lies at ,698 (bearish .382 Fib Retracement), ,000 (100-days EMA), and ,200 (200-days EMA). On the other hand, if the sellers push the market lower, initial support is located at ,290. Beneath this, support is found at ,885, ,790, and ,666.Ethereum has started somewhat of a price reversal after increasing by a total of 5% over the past week to bring the price for the coin up to 5. The cryptocurrency has
Topics:
Yaz Sheikh considers the following as important: Market Updates, Price Analysis
This could be interesting, too:
Jordan Lyanchev writes Stellar (XLM) Explodes by 30% in 2 Days, Bitcoin (BTC) Stable at K (Weekend Watch)
Jordan Lyanchev writes Bitcoin Recovers K Following Dump Below K, Ripple Gains 8% (Weekend Watch)
Jordan Lyanchev writes Crypto Markets Shed Over 0B as BTC Slumped to K (Weekend Watch)
Jordan Lyanchev writes BTC Rejected at 0K After .5B Bybit Hack, SEC to Halt Coinbase Lawsuit: Your Weekly Crypto Recap
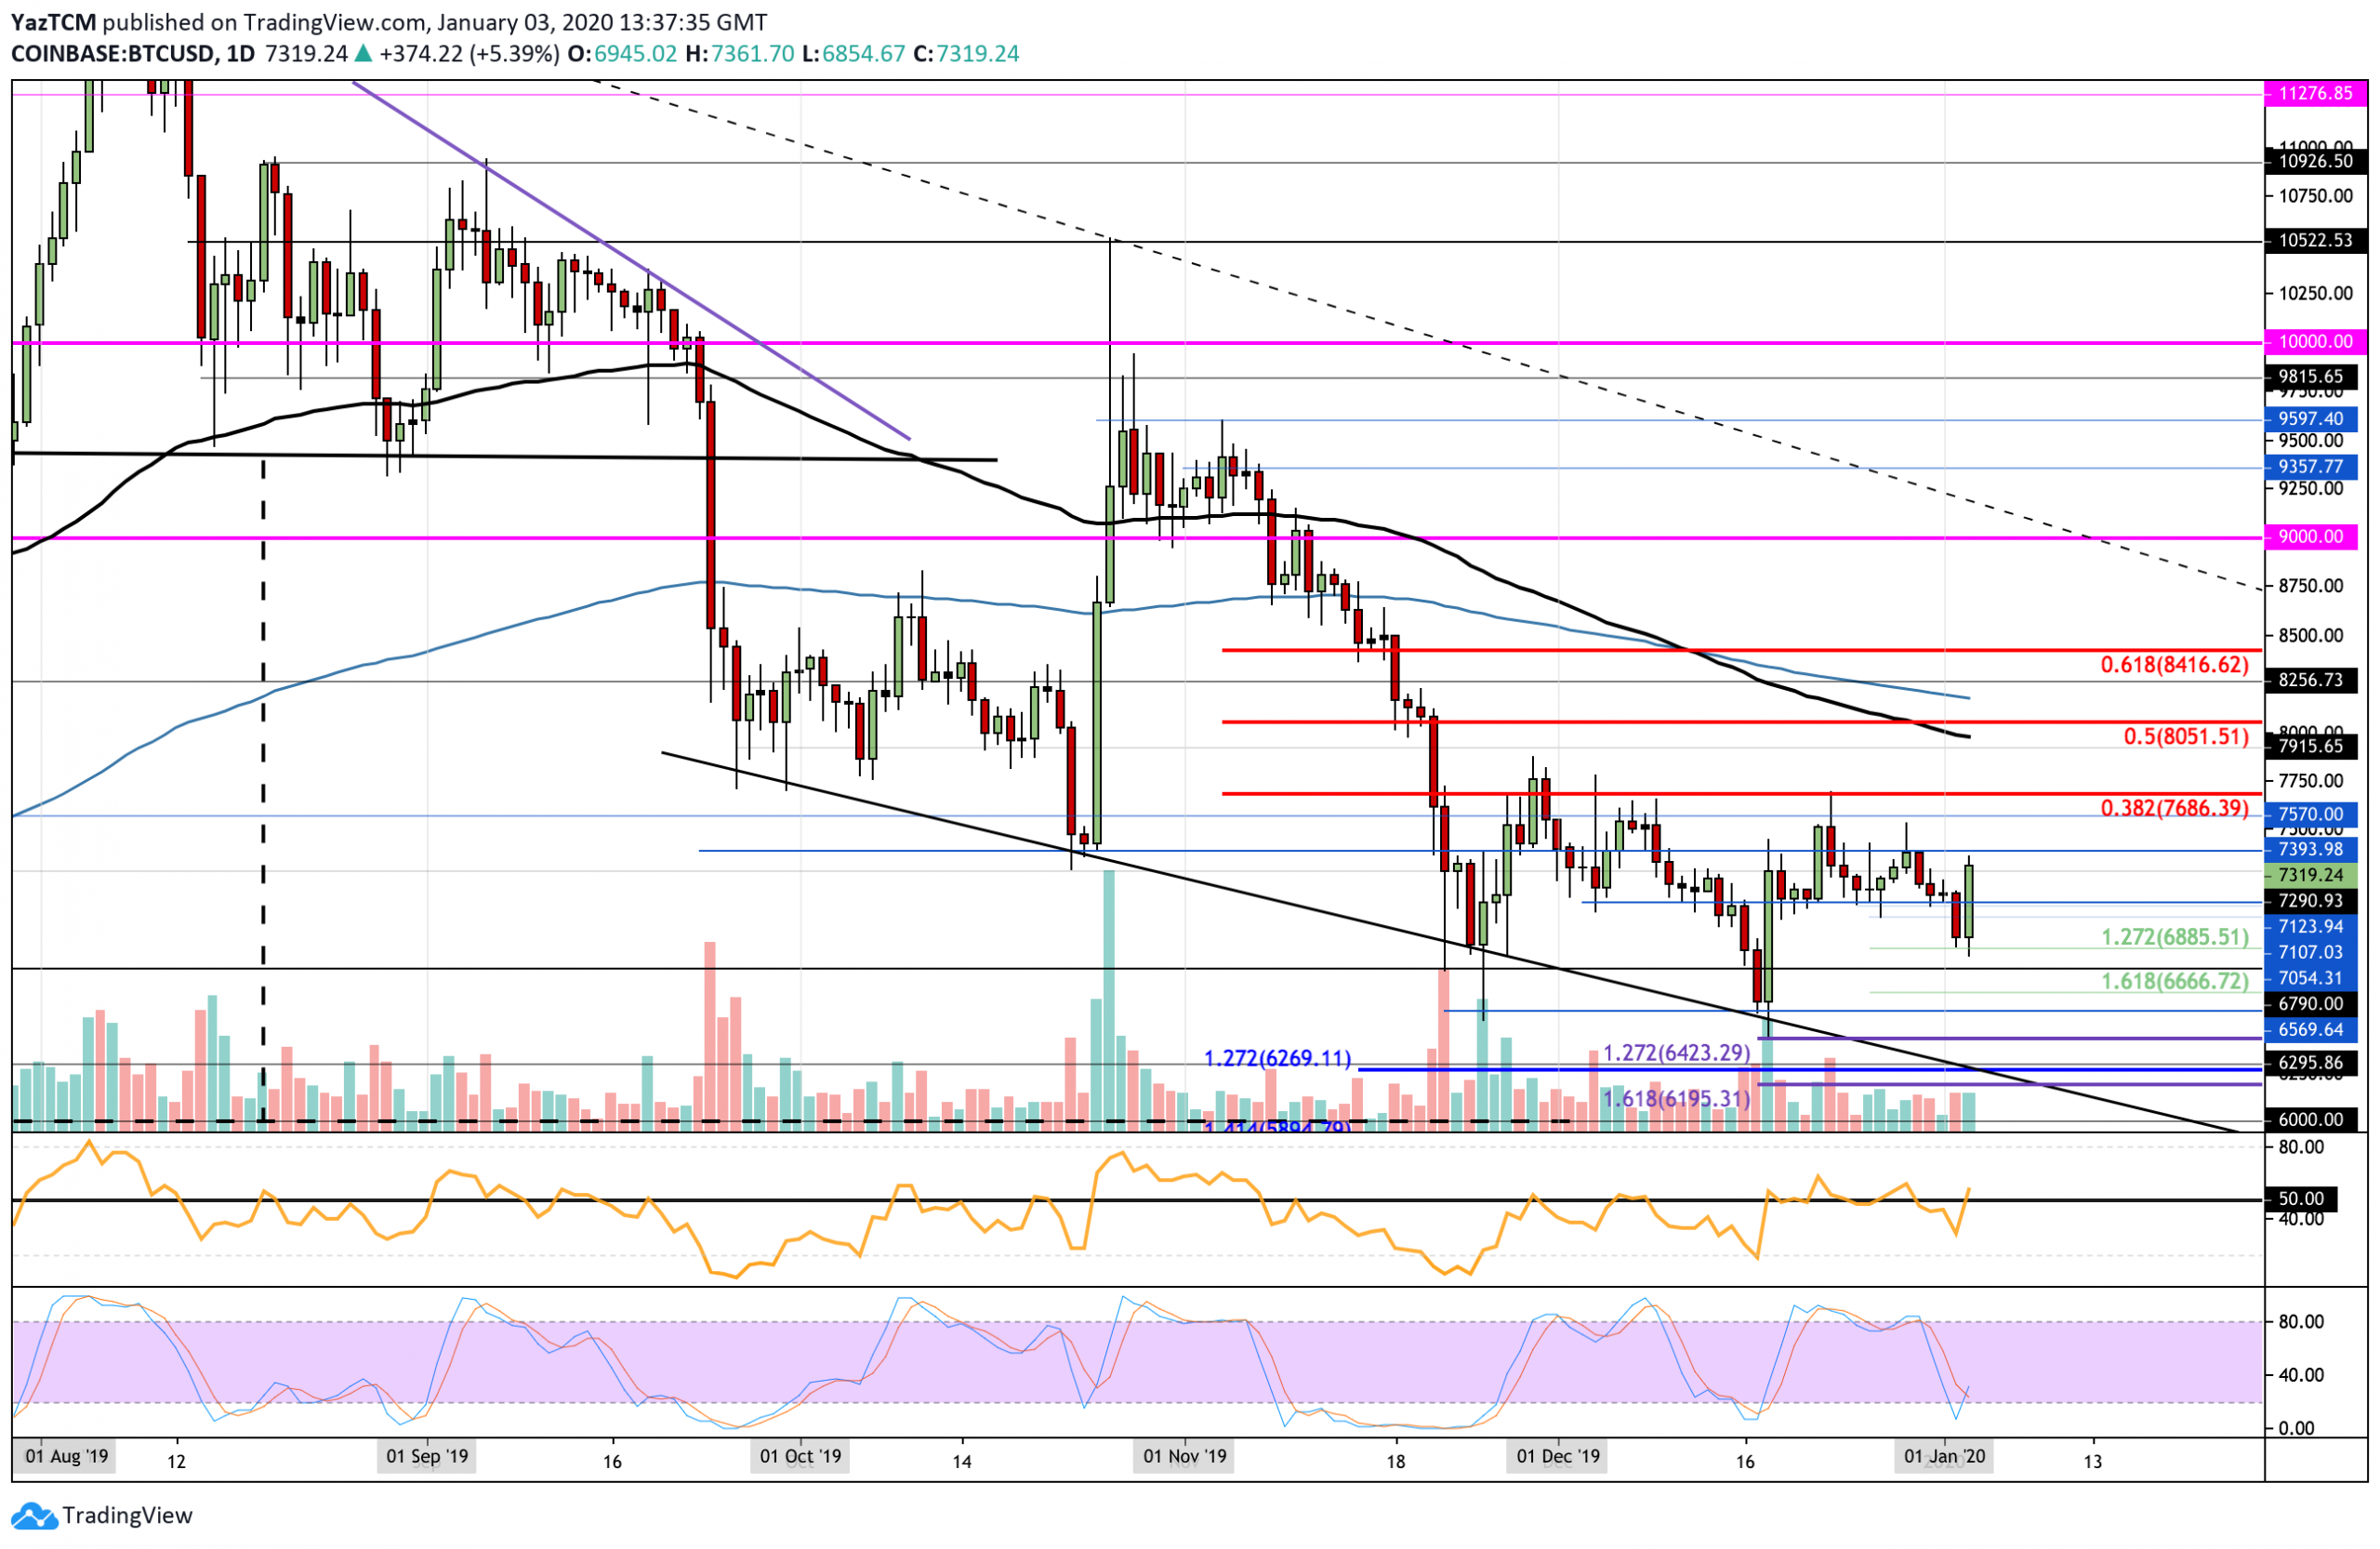
Bitcoin’s price went on a rollercoaster over the past week but still remains trapped beneath the December resistance at $7,686. The cryptocurrency fell below $7,000 to find support at $6,885. However, after reaching this level, Bitcoin bounced higher as it now trades around $7,319.
If the bulls continue to drive Bitcoin higher and push it above $7,400, immediate resistance lies at $7,698 (bearish .382 Fib Retracement), $8,000 (100-days EMA), and $8,200 (200-days EMA). On the other hand, if the sellers push the market lower, initial support is located at $7,290. Beneath this, support is found at $6,885, $6,790, and $6,666.
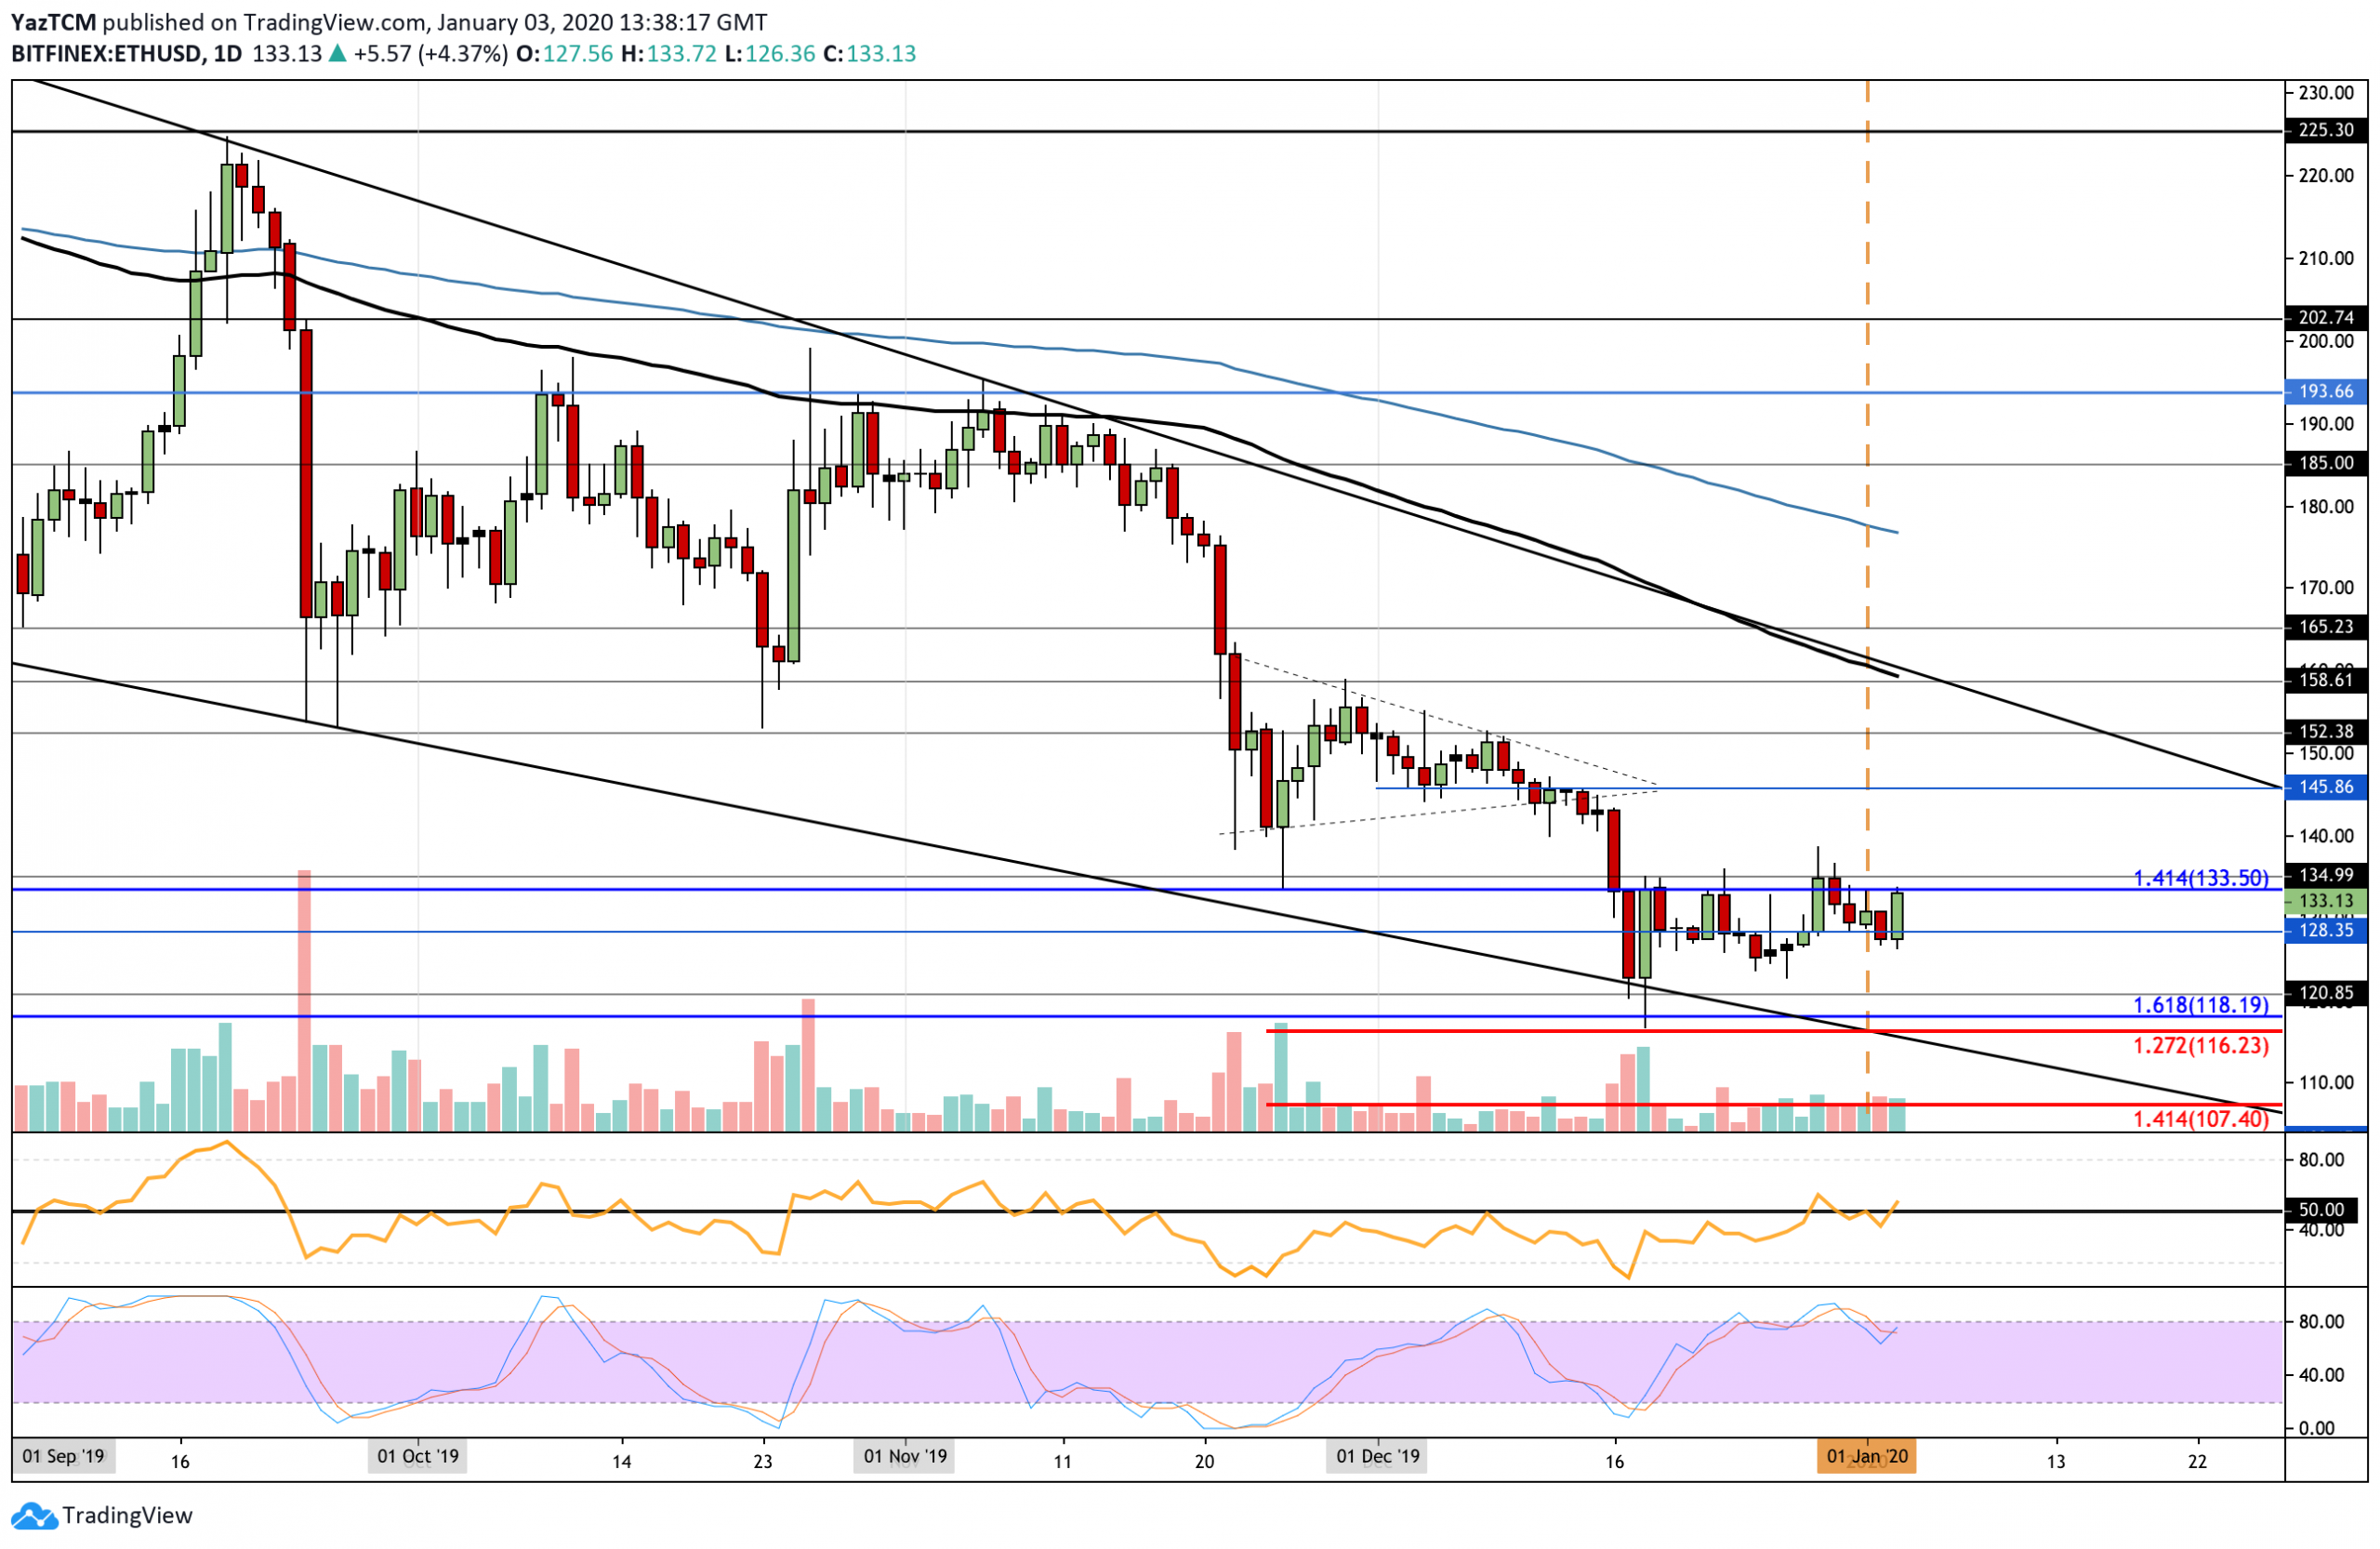
Ethereum has started somewhat of a price reversal after increasing by a total of 5% over the past week to bring the price for the coin up to $135. The cryptocurrency has been trapped at this level of resistance since mid-December and must break above here to see any kind of bullish momentum.
Looking ahead, if the bulls manage to push ETH above $135, immediate resistance toward the upside is located at $145 and $152 (December highs). Above this, resistance can be found at $158 (100-days EMA) and $170. Alternatively, if the sellers regroup and push ETH lower, initial support can be found at $125 and $120. Beneath this, additional support is found at $118 and $116.
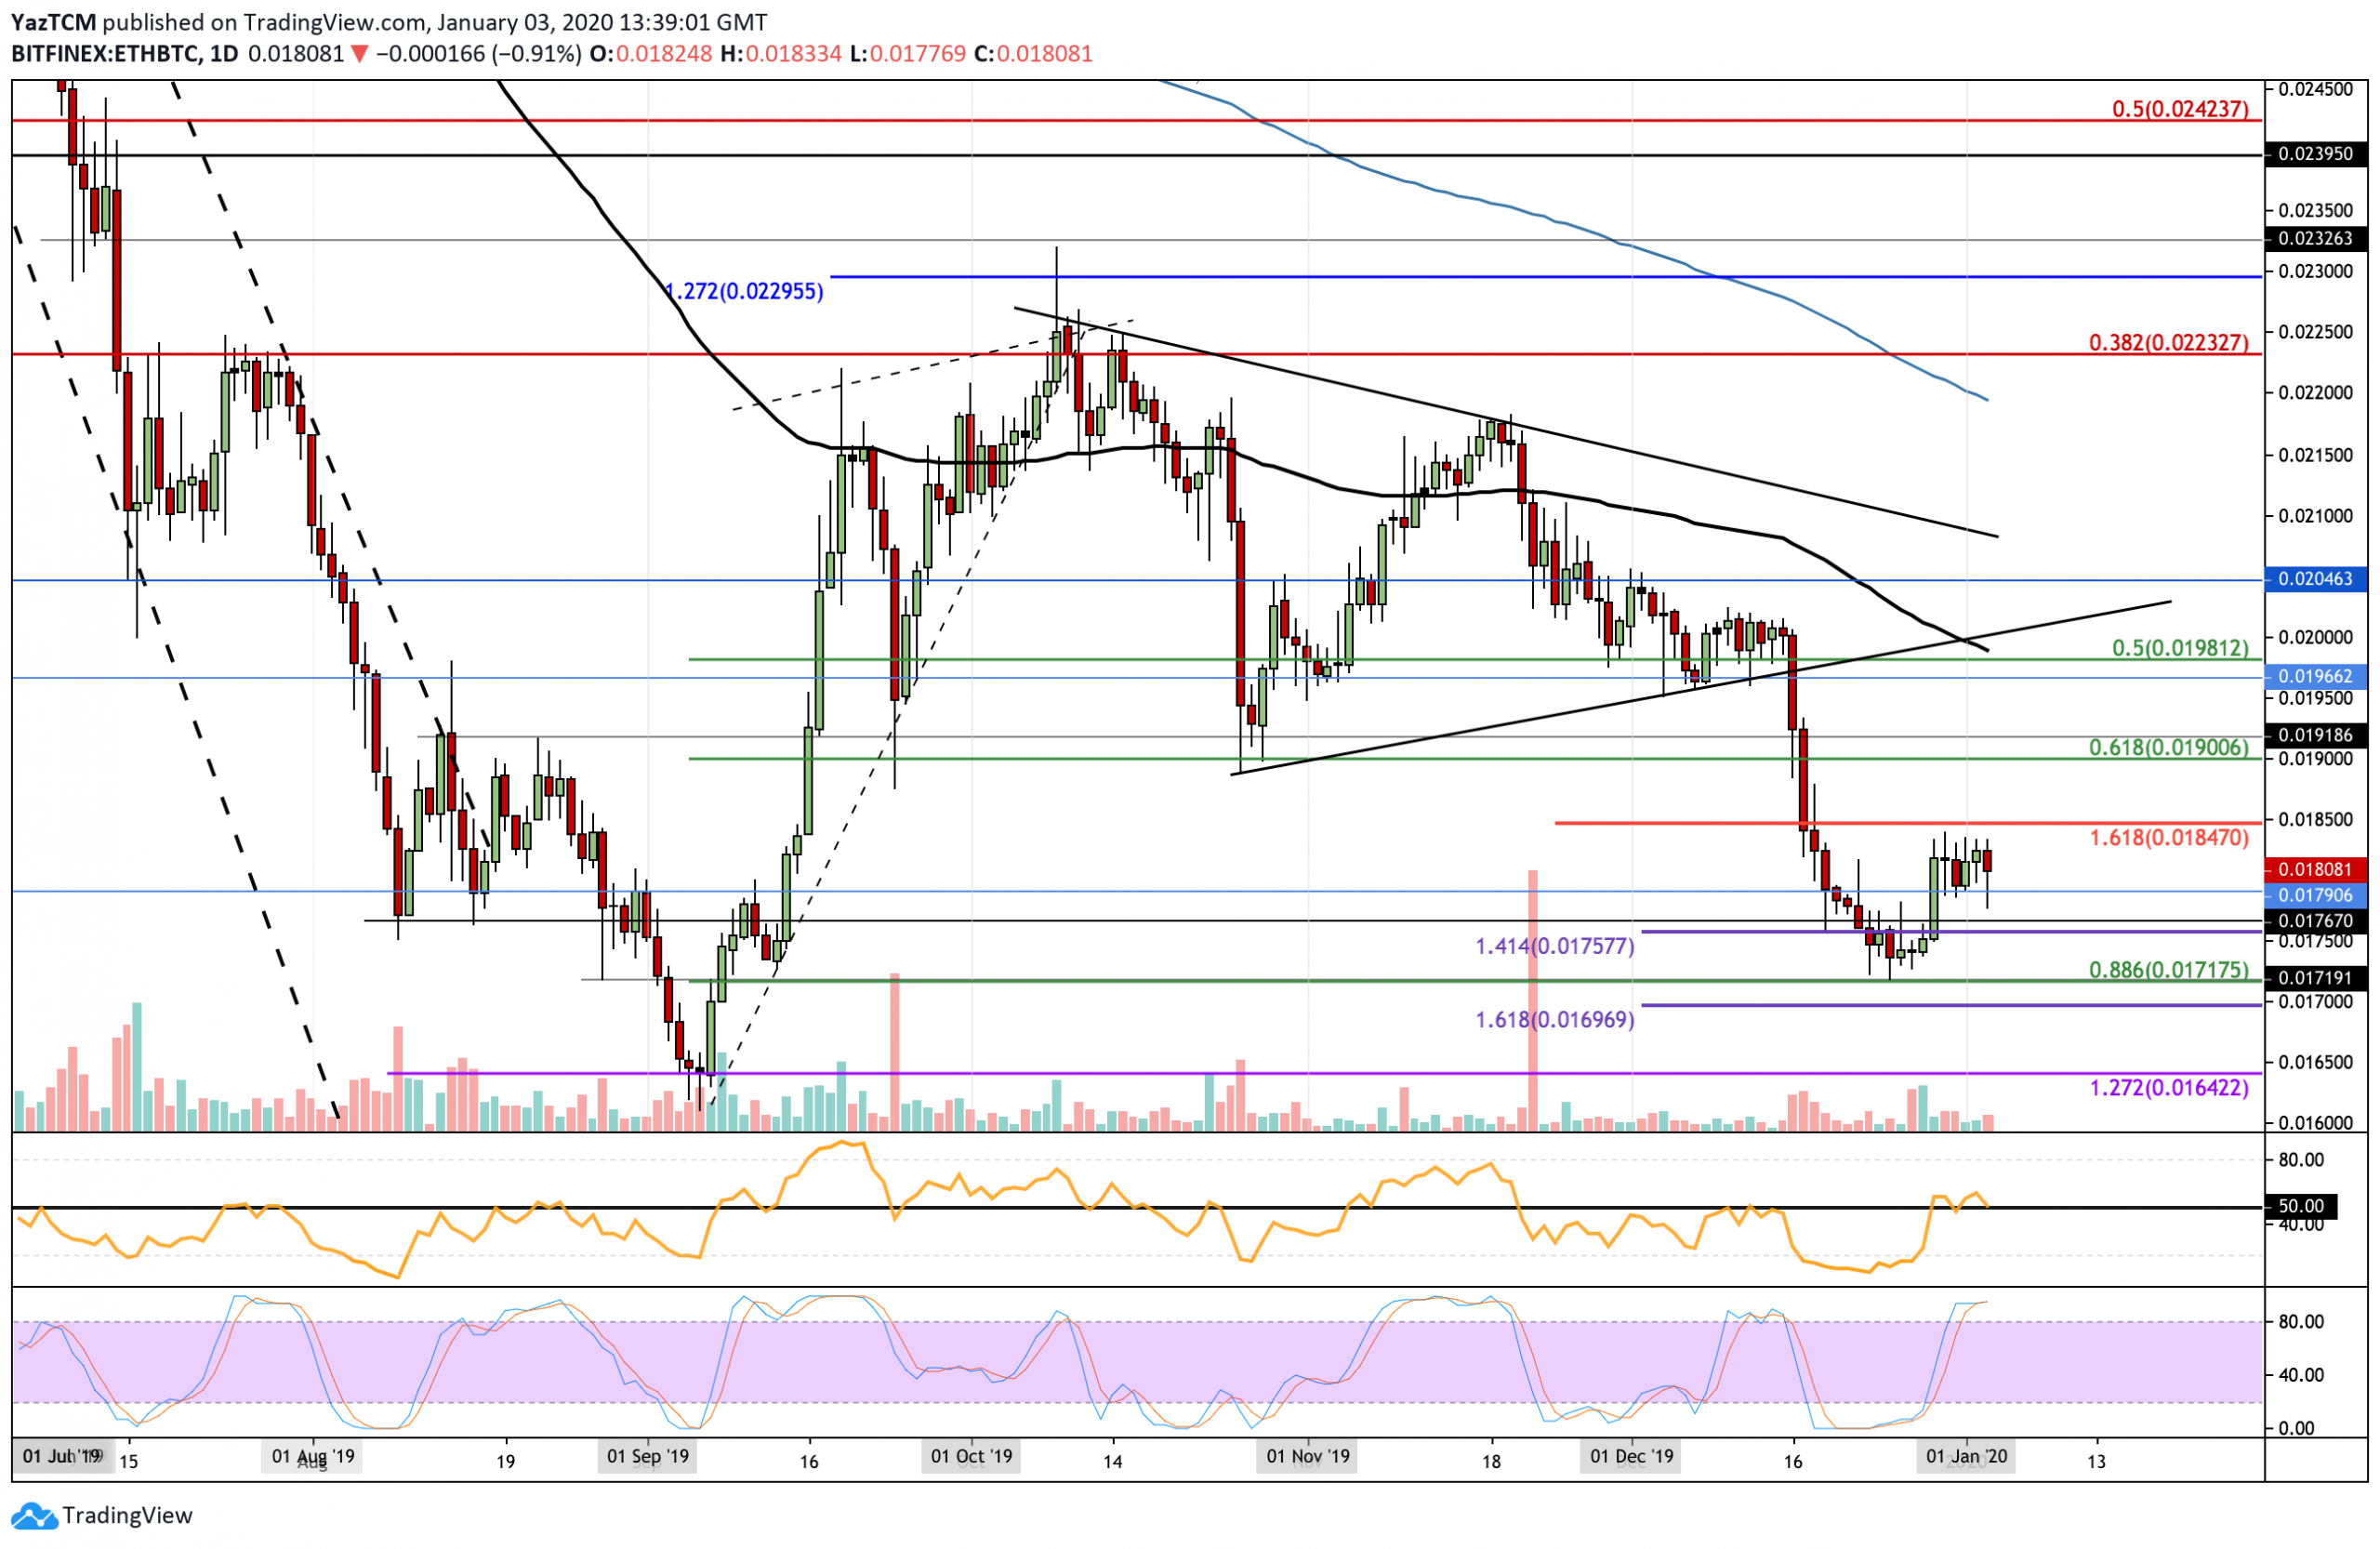
Against Bitcoin, ETH bounced from the support at 0.0171 BTC, allowing it to climb higher into the resistance at 0.0182 BTC. The cryptocurrency has struggled to overcome this level over the past week and must pass it to form a bullish rebound.
If the bulls manage to crack the 0.0182 BTC level, initial higher resistance is located at 0.0185 BTC and 0.019 BTC. Above this, resistance is expected at 0.0198 BTC (100-days EMA), 0.020 BTC, and 0.0204 BTC. Alternatively, if the sellers regroup and push ETH lower, initial support is found at 0.0179 BTC and 0.0176 BTC. Beneath this, support lies at 0.0169 BTC.
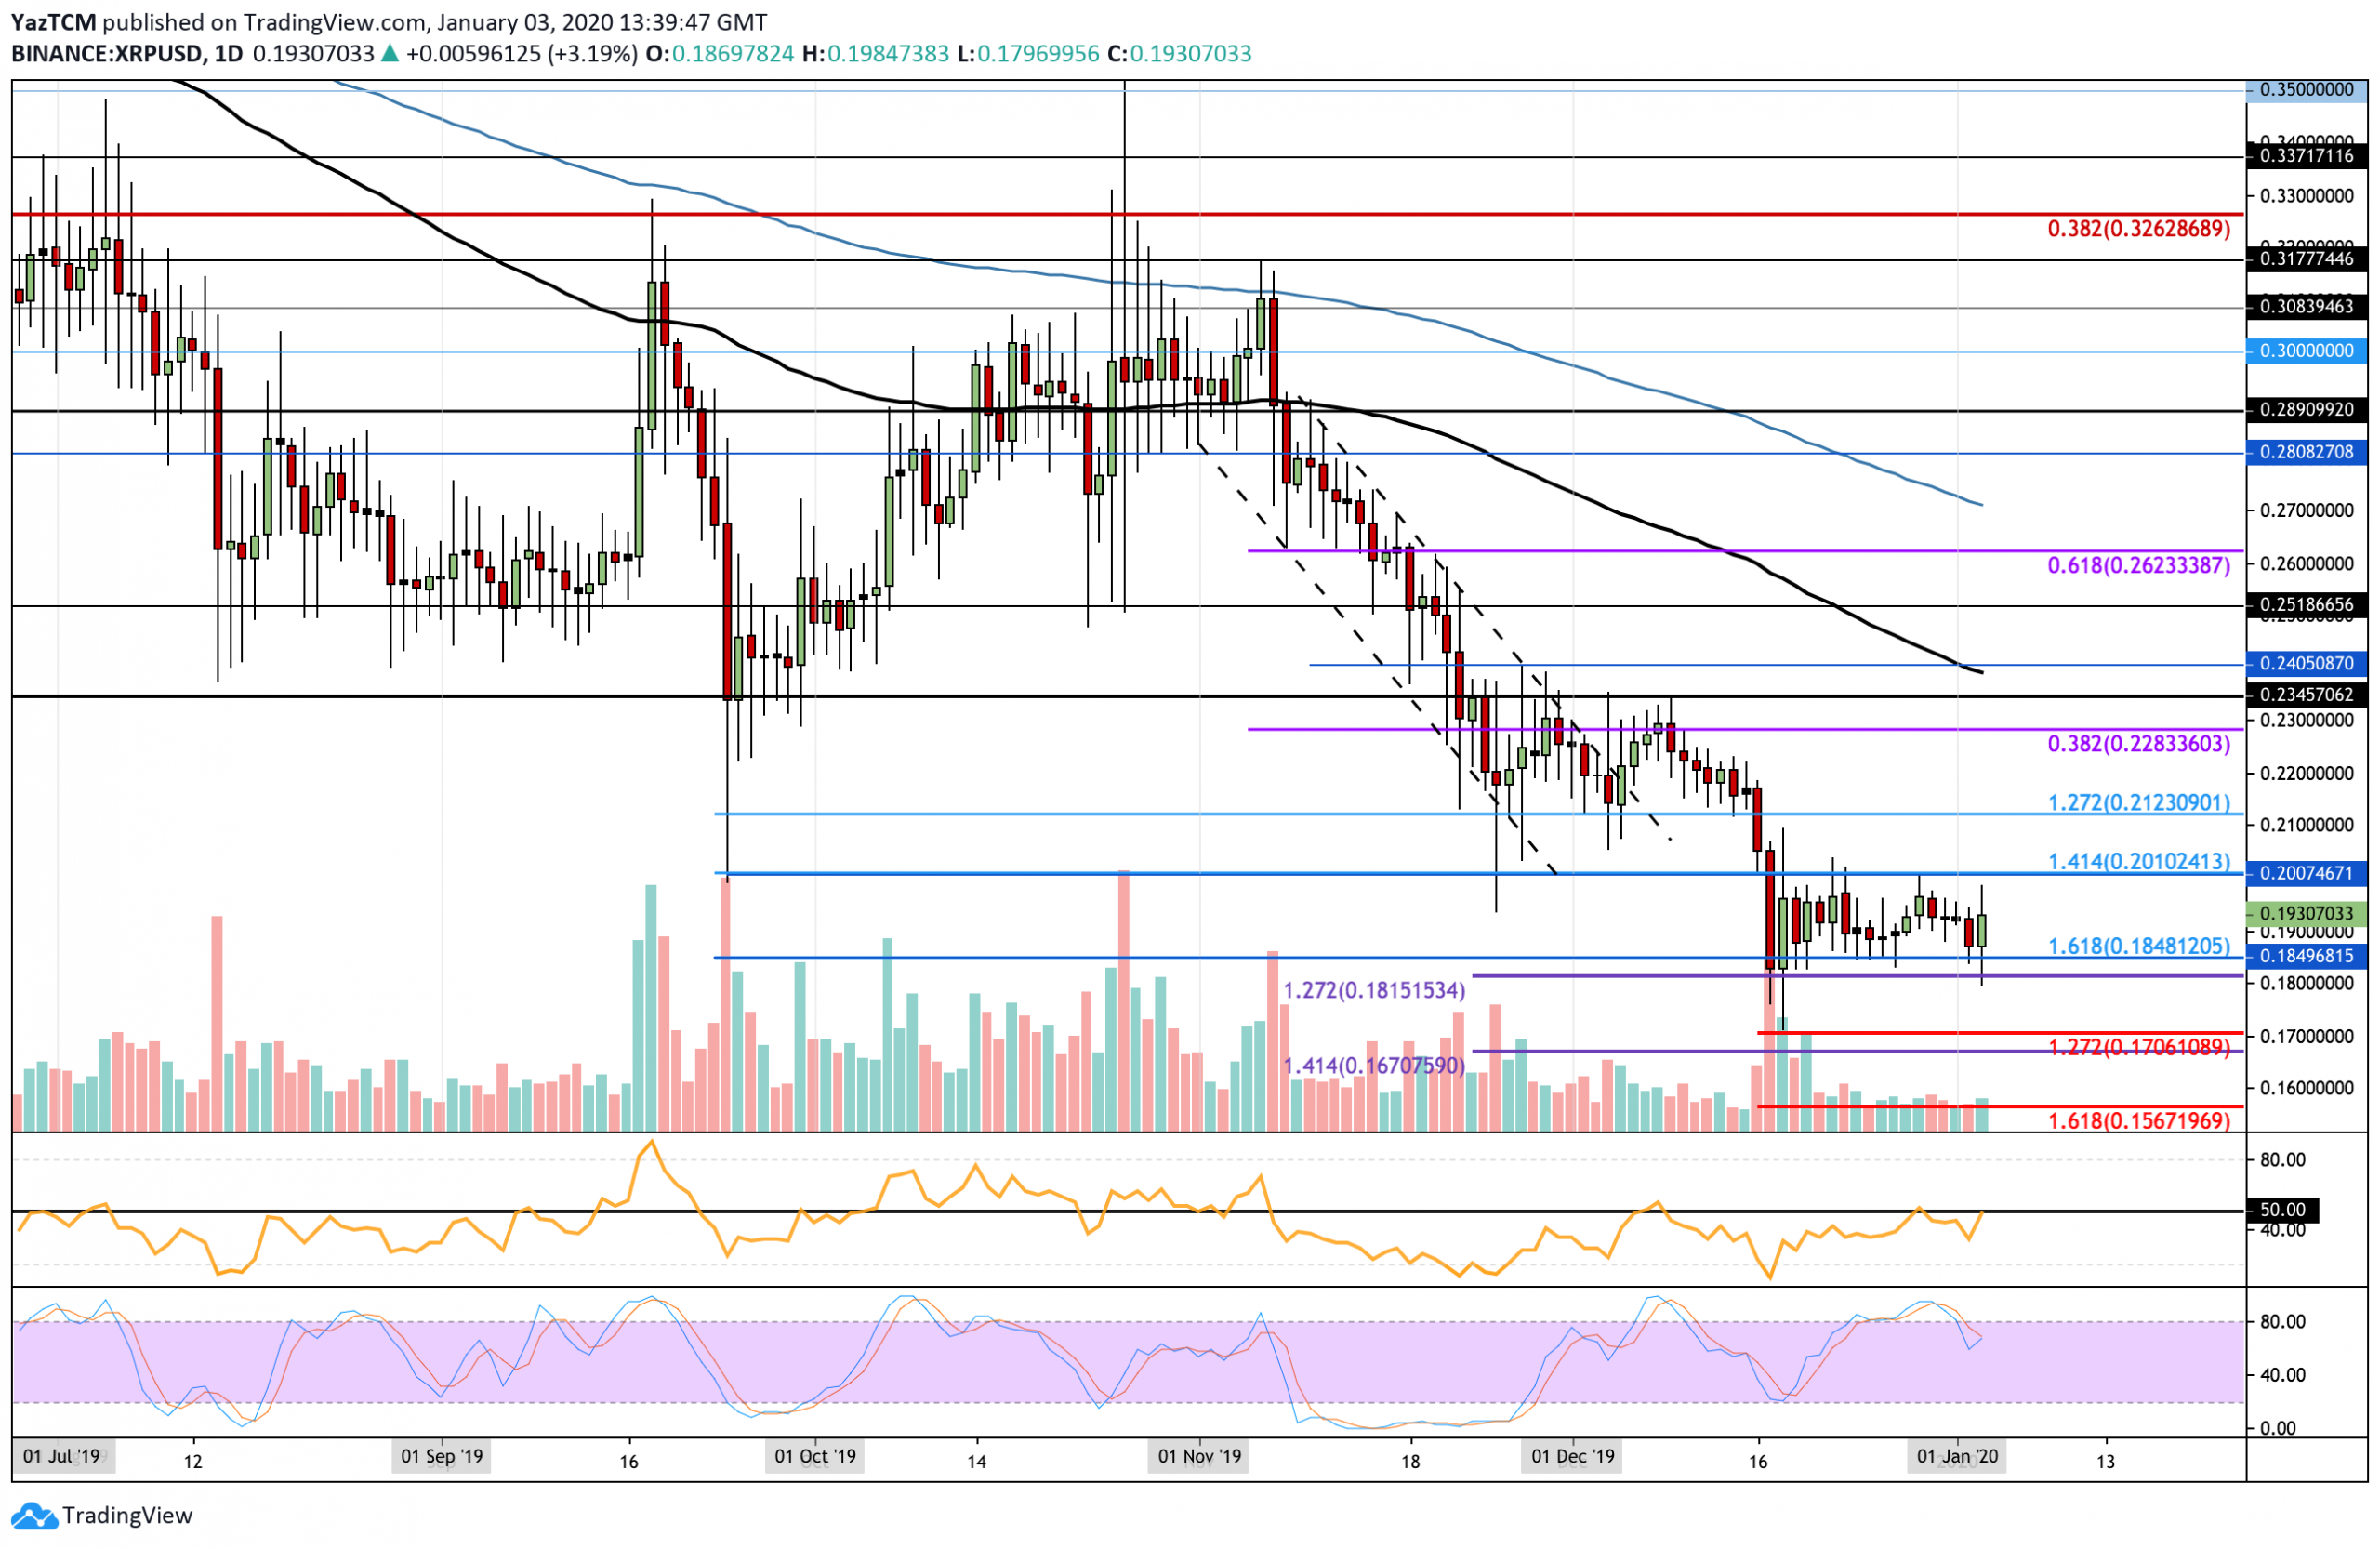
XRP continued to trade sideways within the current trading range between $0.20 and $0.18 this week. The cryptocurrency must break beyond one of these boundaries for the market to dictate the next direction that it would like to head toward.
If the bulls manage to push XRP above $0.20, immediate higher resistance is expected at $0.212 and $0.228. Beyond this, resistance lies at $0.240 (100-days EMA) and $0.25. On the other hand, if the sellers push the market lower, initial support lies at $0.1850 and $0.1815. Beneath the lower boundary of the range, additional support is found at $0.175, $0.17, and $0.167.
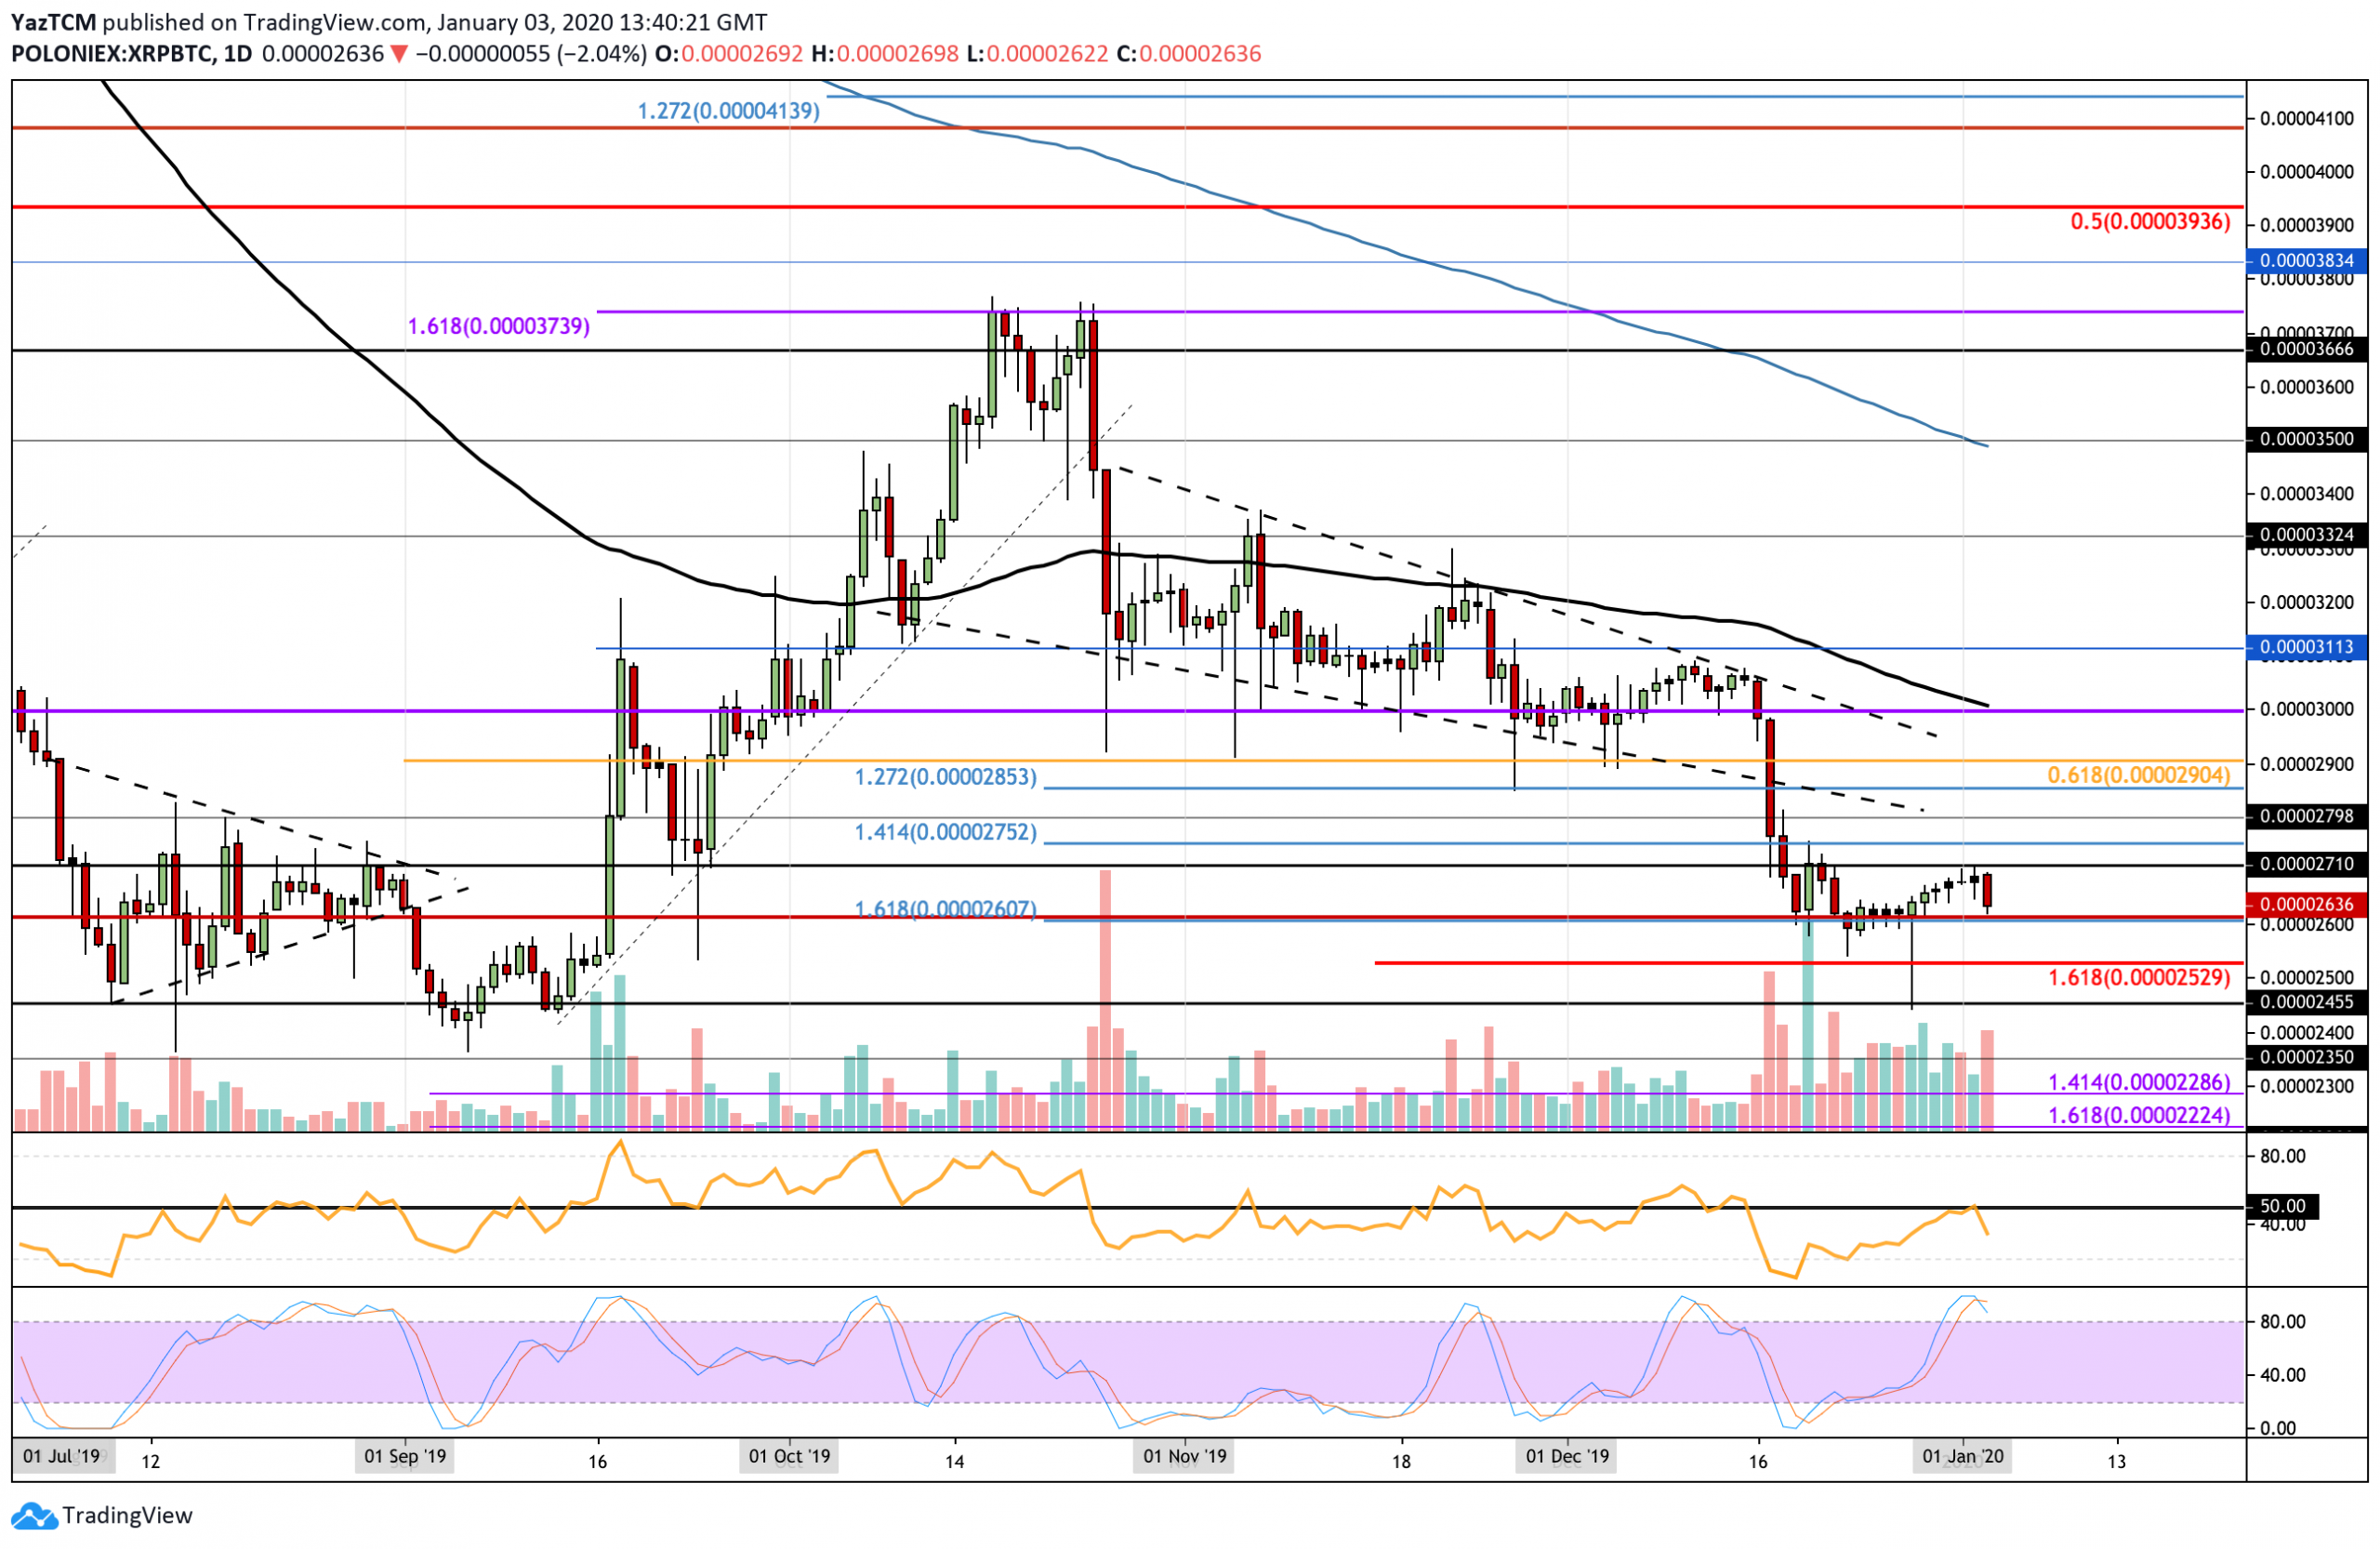
Against BTC, XRP continued to slowly grind higher from the support at 2600 SAT but only managed to climb as high as the resistance at 2710 SAT before rolling over and returning back to 2600 SAT. The cryptocurrency has been trapped within this range for the past week and must break this before we can guess which direction XRP will head toward.
Looking ahead, if the sellers push XRP beneath 2600 SAT, initial support is located at 2530 SAT. Beneath this, support can be found at 2455 SAT, 2400 SAT and 2345 SAT. Alternatively, if the buyers regroup and push the market higher, initial strong resistance lies at 2710 SAT. Above this, resistance lies at 2752 SAT, 2800 SAT, 2900 SAT, and 3000 SAT (100-days EMA).
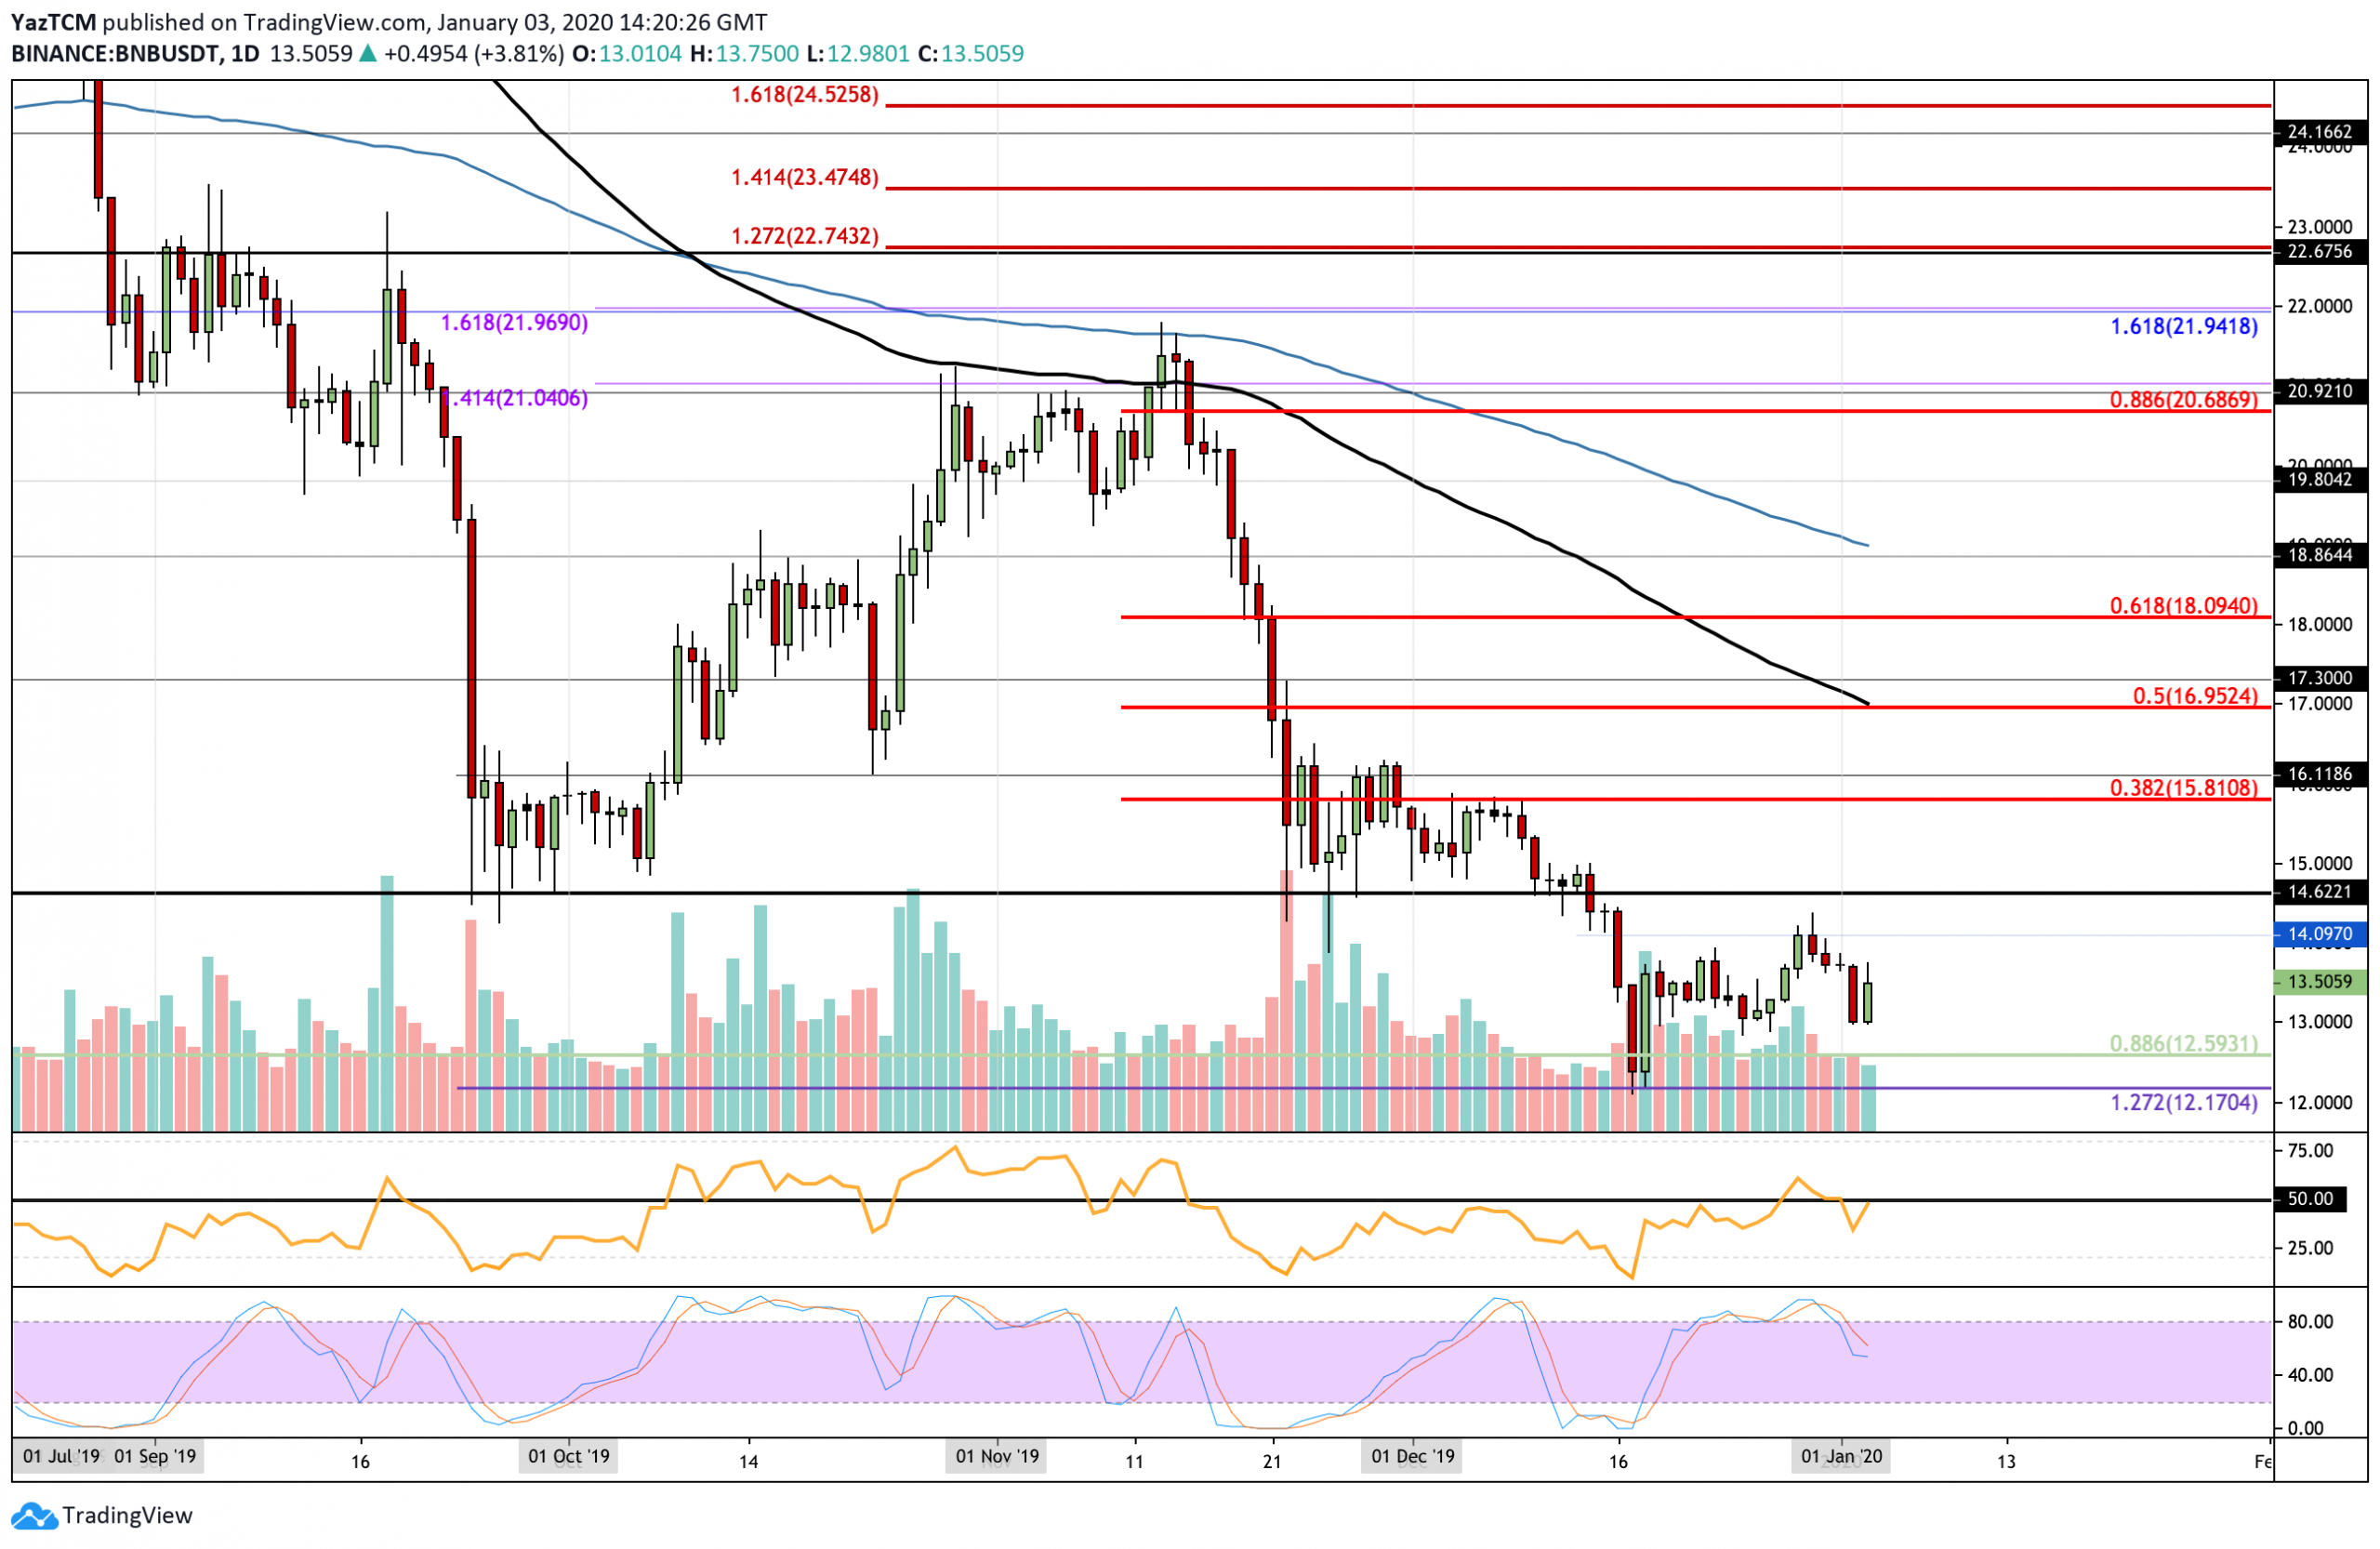
Binance Coin has started 2020 on a bearish footing as it drops into support $13. However, the bulls are attempting to turn this around. BNB found very strong support during mid-December at the $12.17 level that allowed it to bounce higher into $14 before closing the previous decade.
If the bulls continue to cause BNB to bounce higher, an initial resistance is located at $14 and $14.62. If the buyers manage to drive BNB above $15, resistance is found at $15.81 (bearish .382 Fib Retracement) and $16.95 (bearish .5 Fib Retracement and 100-days EMA). On the other hand, if the sellers regroup and push BNB lower, initial support is located at $13. Beneath this, additional support is found at $12.59, $12.17 and $12.
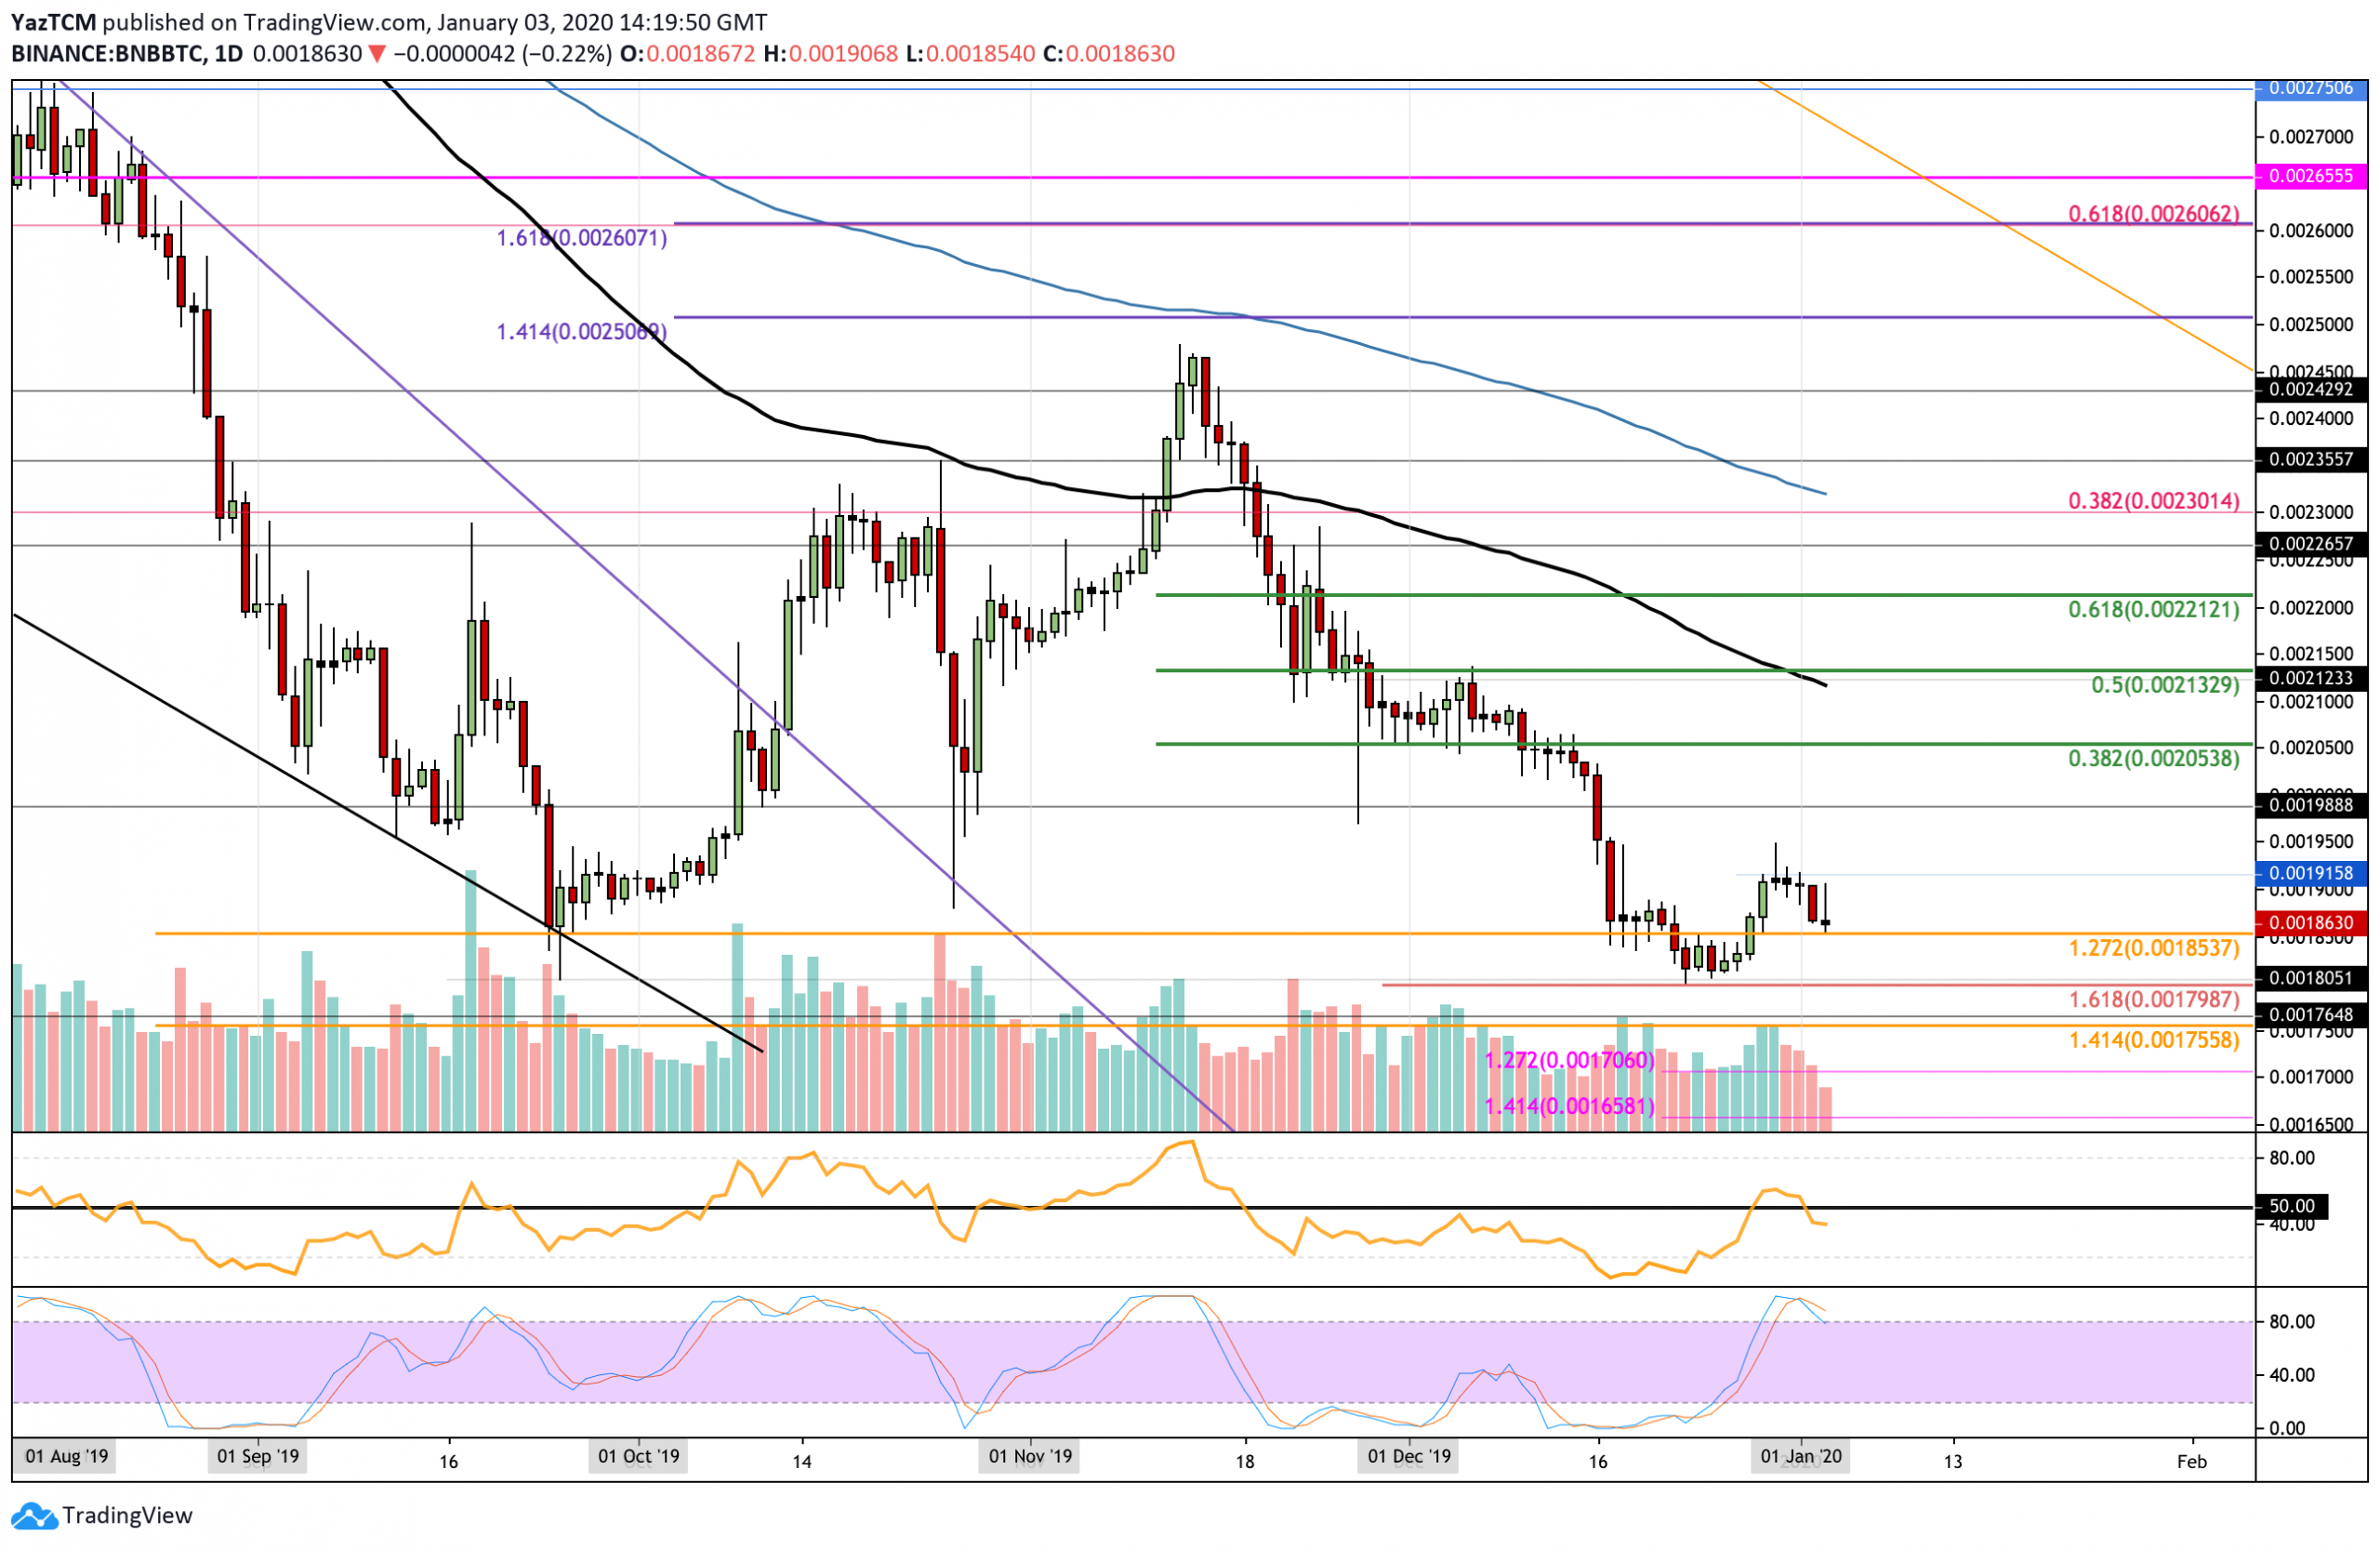
Against Bitcoin, BNB managed to find very strong support at the 0.0179 BTC level toward the end od December. BNB went on to rebound higher toward the end of 2019, reaching as high as 0.00195 BTC before meeting resistance and rolling over back into the current support at 0.00185 BTC.
If the bulls manage to defend the support at 0.00185 BTC and push higher, initial resistance lies at 0.00191 BTC. Above this, resistance lies at 0.0195 BTC, 0.020 BTC, and 0.0212 BTC (100-days EMA). On the other hand, if the sellers push BNB beneath the support at 0.00185 BTC, additional support is found at 0.00179 BTC and 0.000175 BTC.
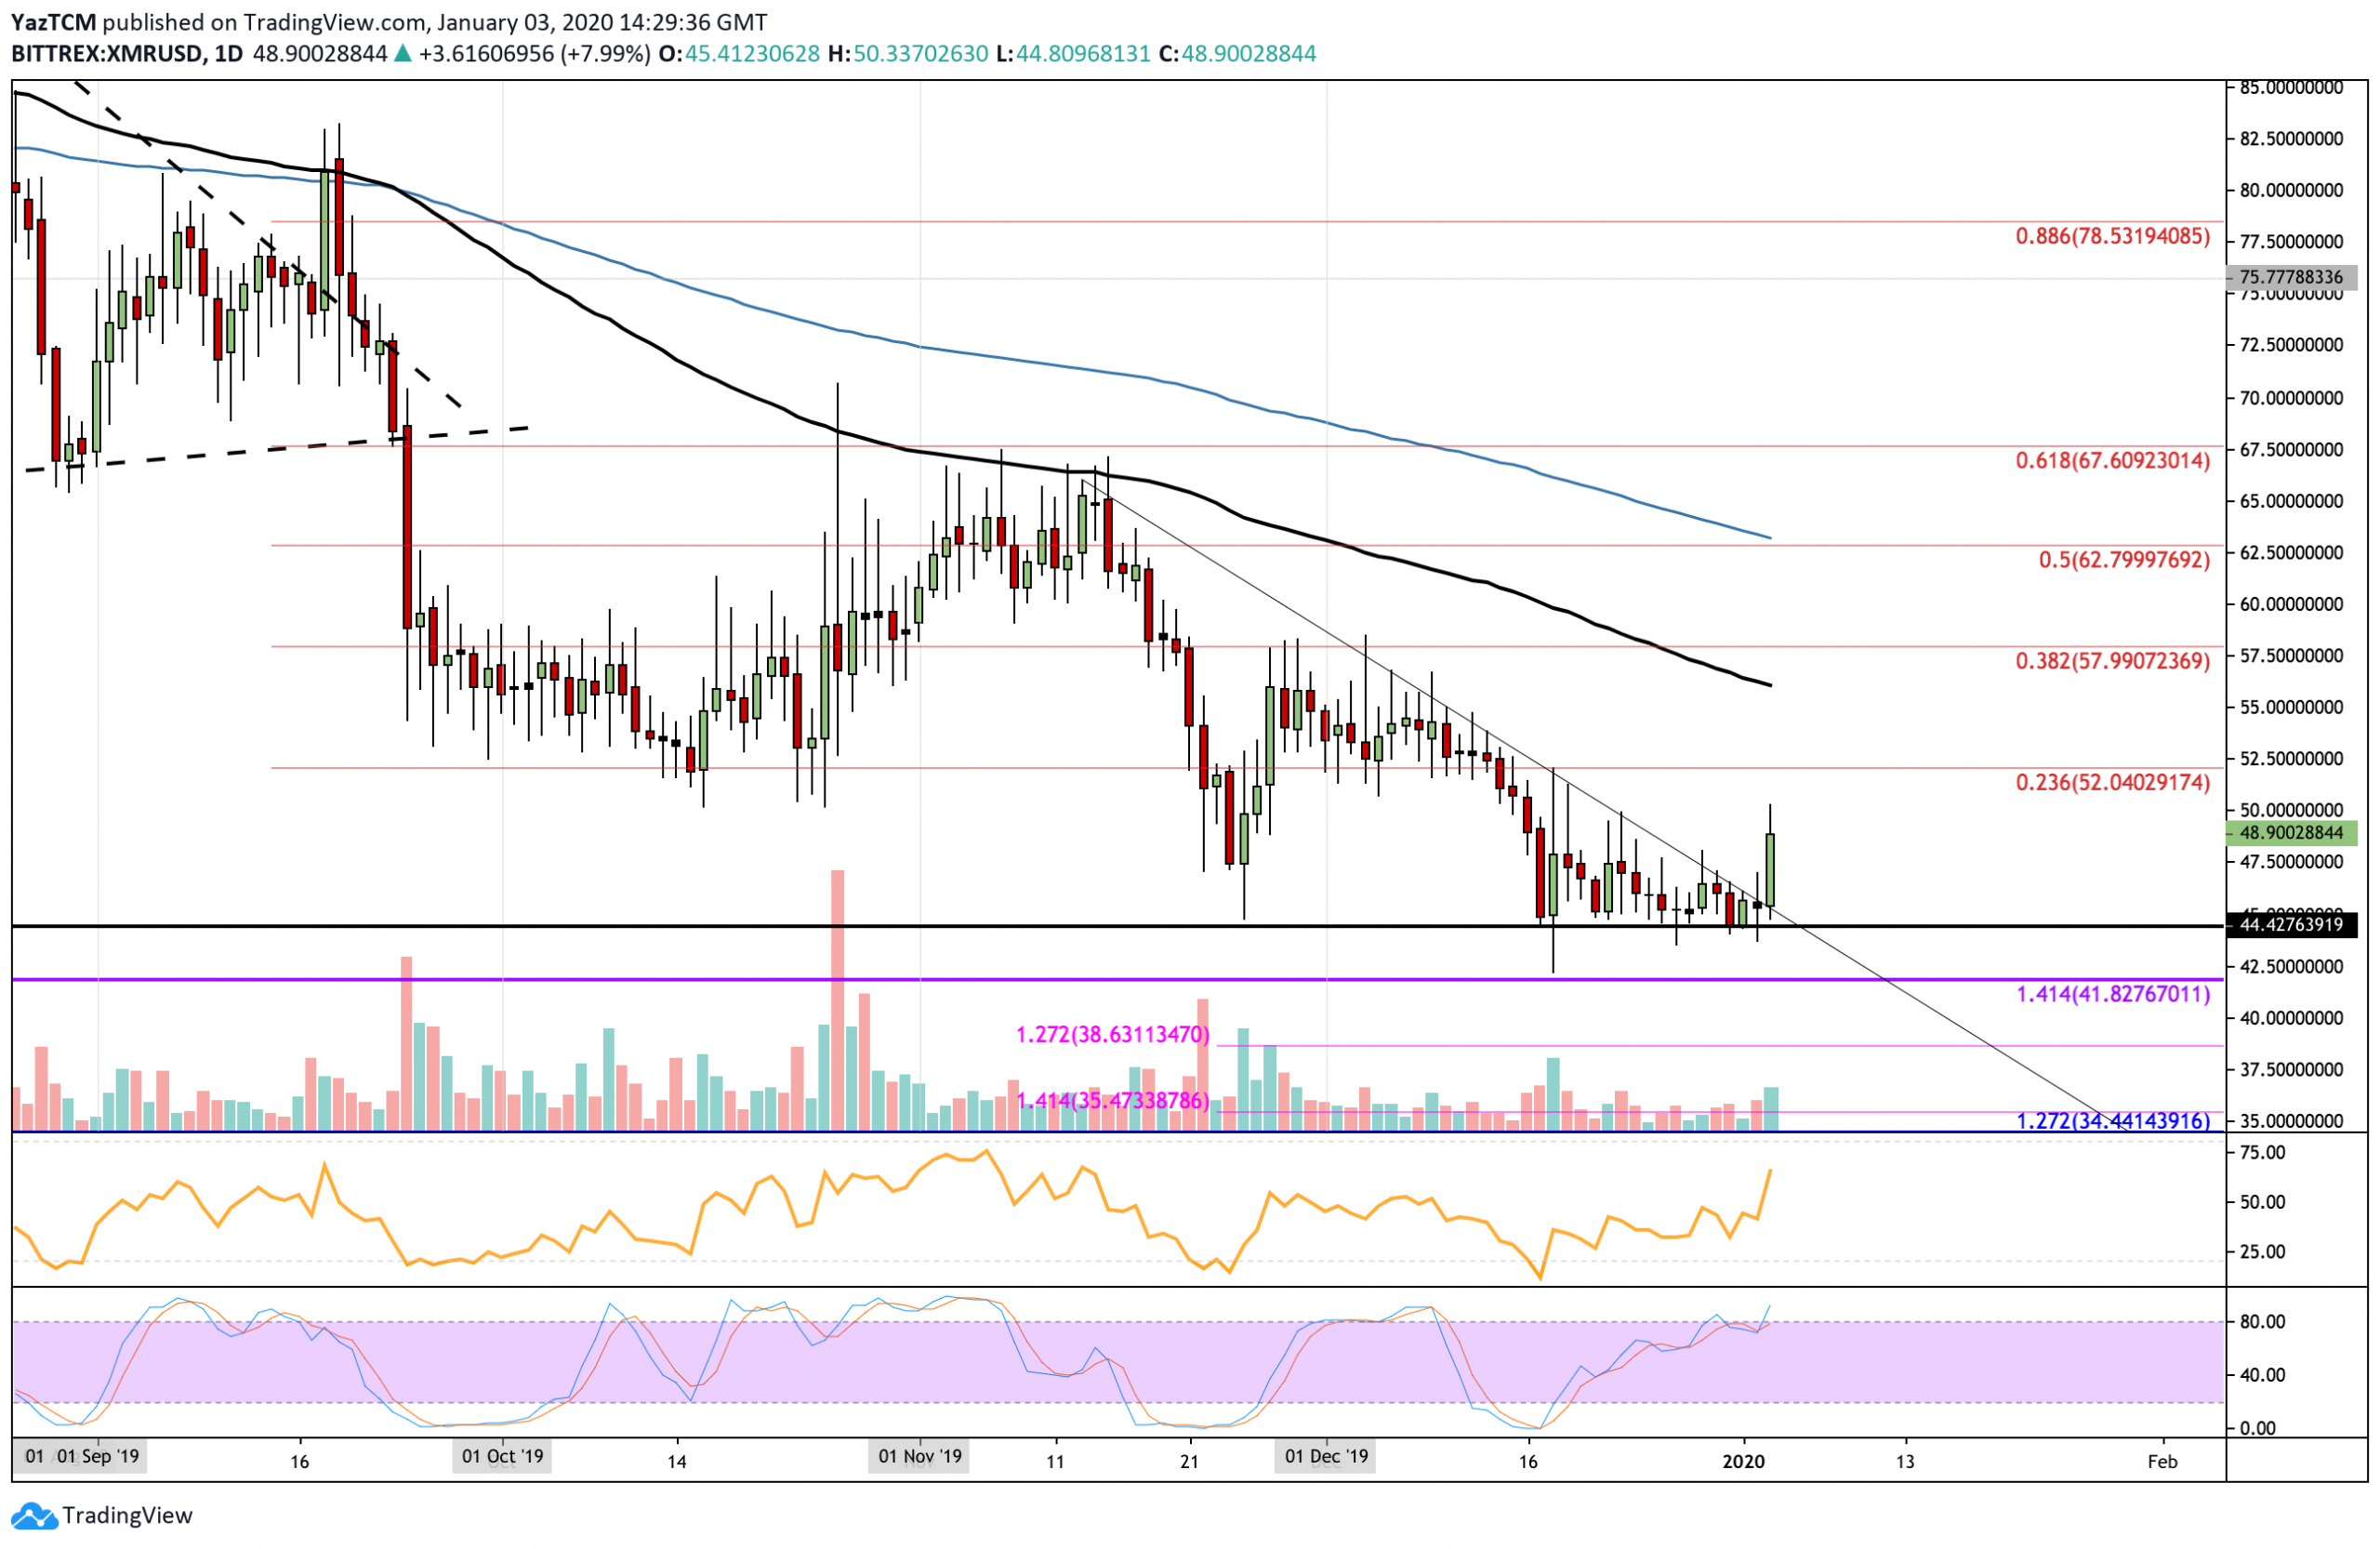
Monero has witnessed an 8% price increase this past week, allowing the coin to rise back toward the $49 level. The cryptocurrency has broken above a 1-month-old descending trend line as it looks to establish a bullish frontier. Monero still must rise and break above the $58 level (December resistance) before being able to turn bullish.
If the buyers continue to drive XMR above $50, initial resistance lies at $52 and $56 (100-days EMA). Above this, resistance lies at $60 and $62 (200-days EMA and bearish .5 Fib Retracement). On the other hand, if the sellers regroup and push XMR lower, support can be expected at $45. Beneath this, additional support is found at $41.80, $40, and $38.63.
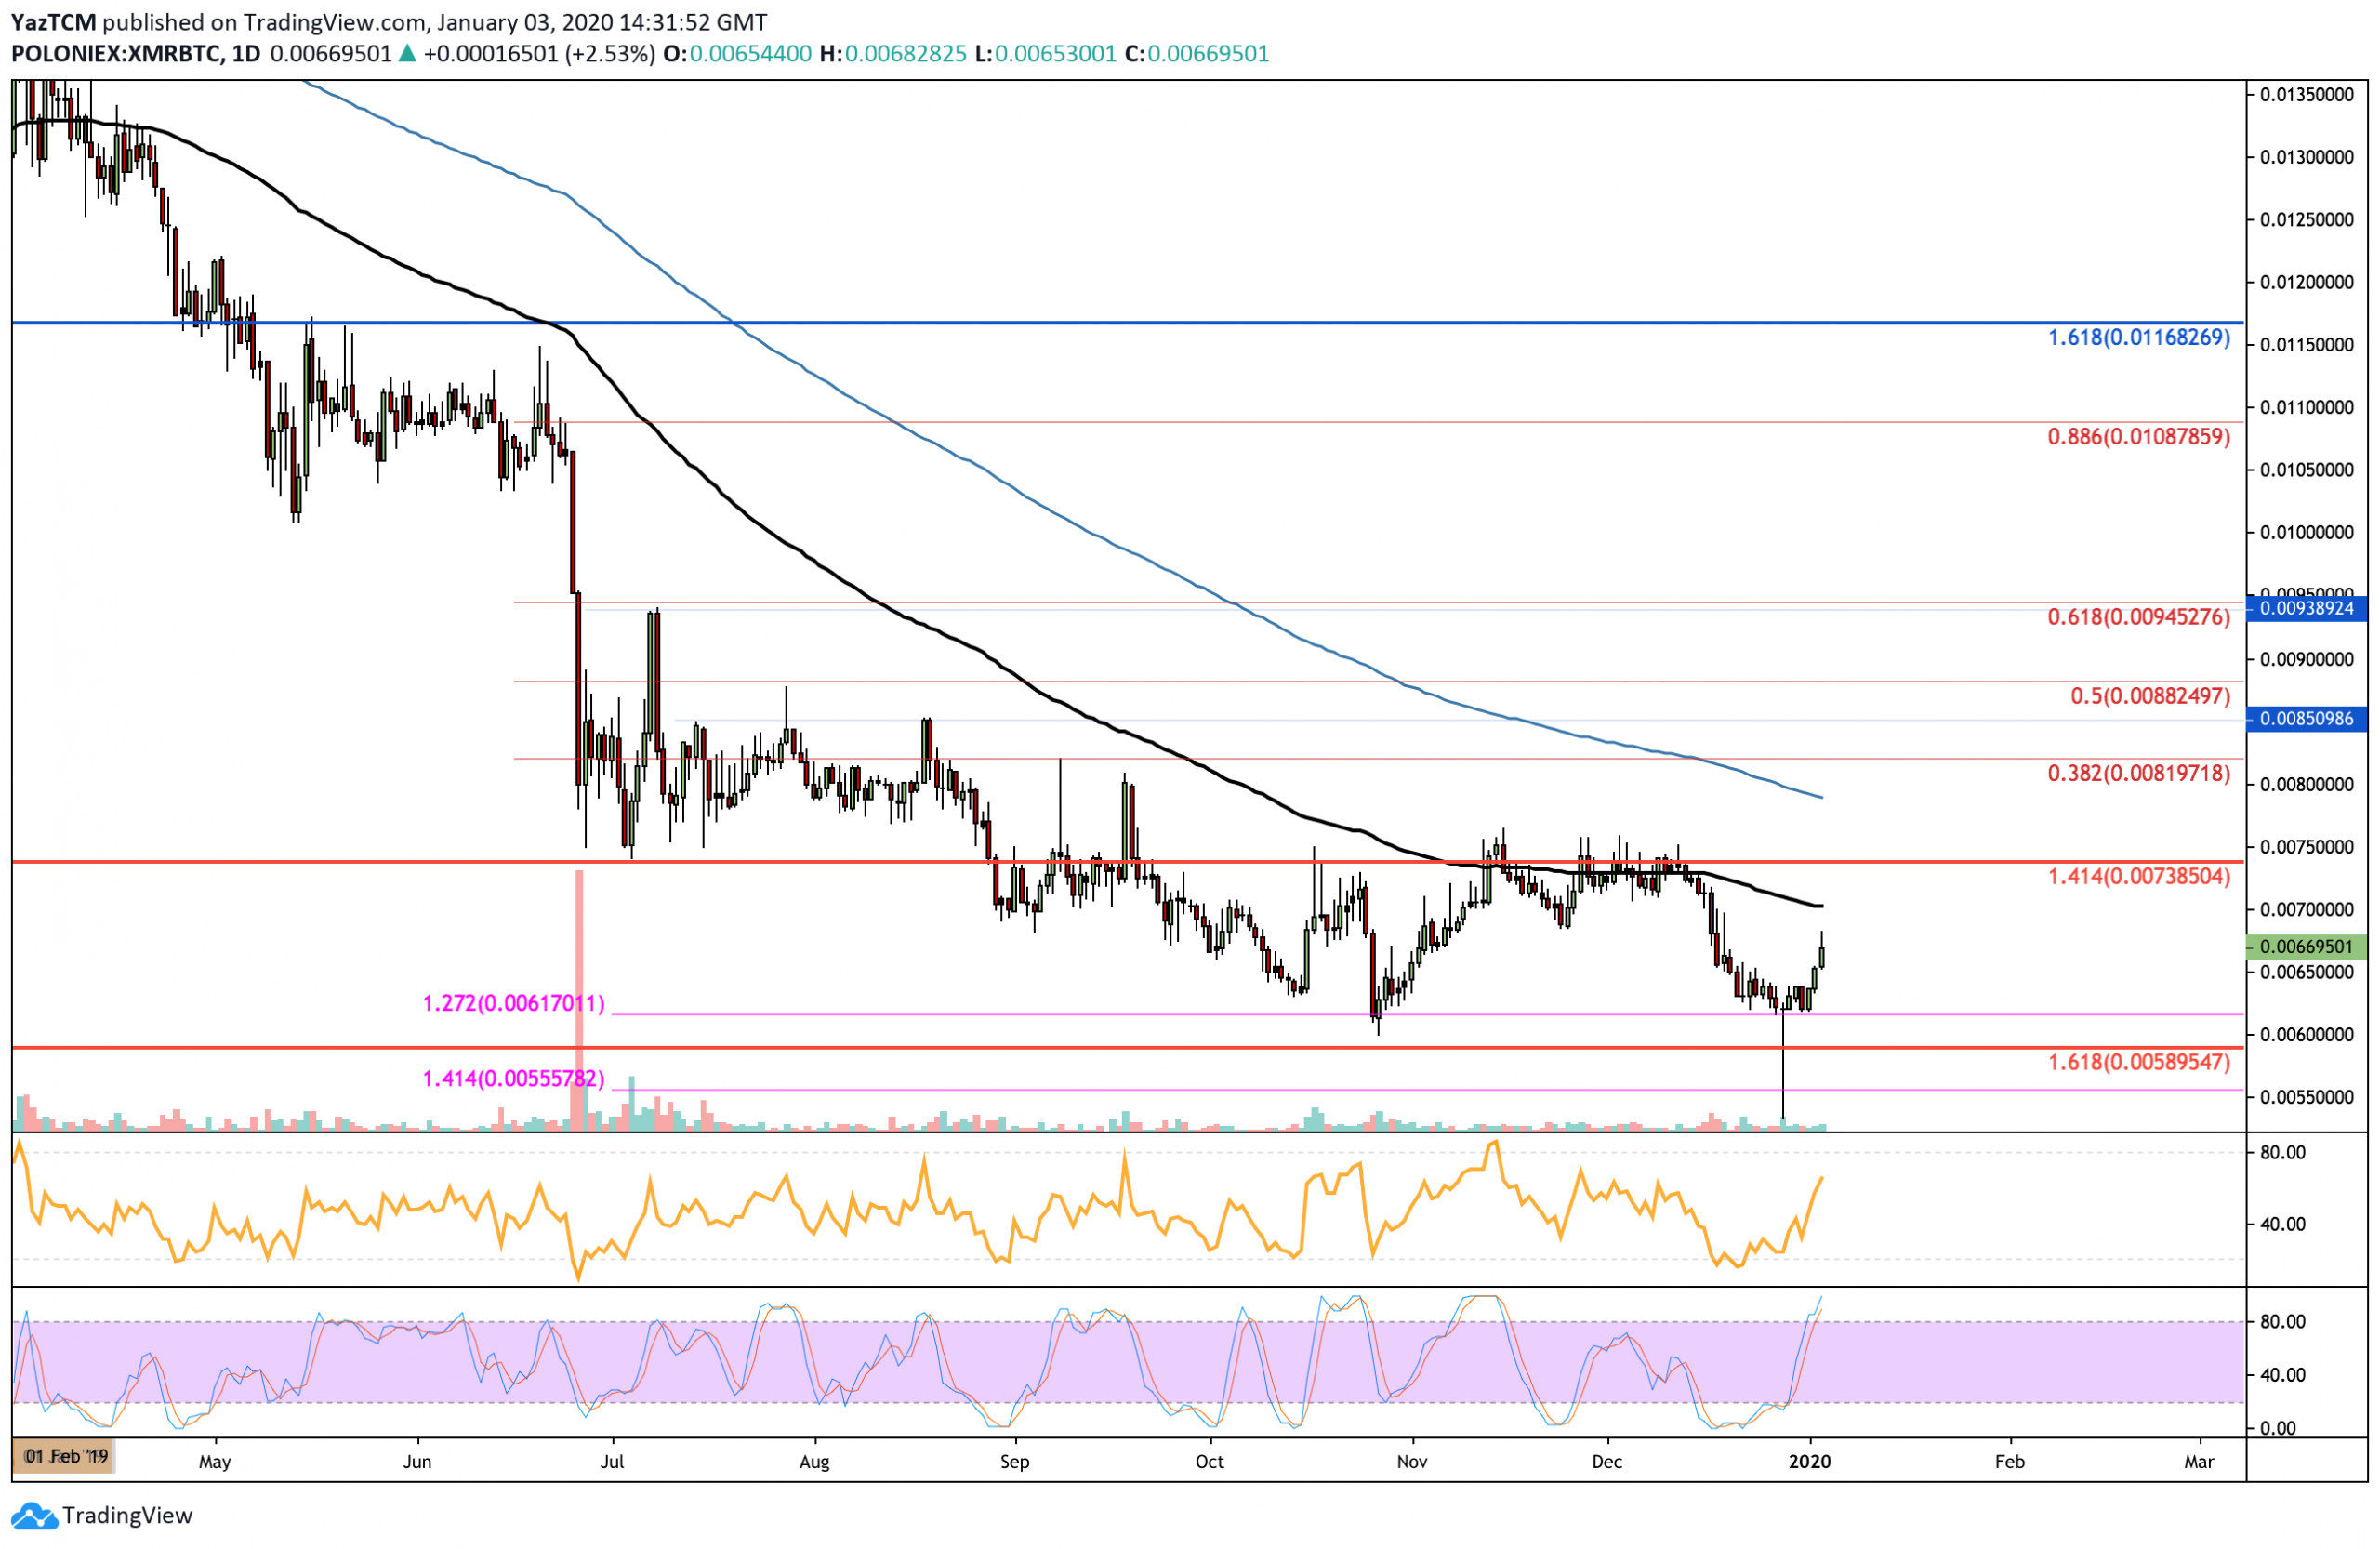
Against BTC, Monero has traded sideways since September 2019 as it remains trapped within a large range between 0.0075 BTC and 0.00617 BTC. This range must be broken before we can dictate the next direction that Monero would head toward.
Looking ahead, an initial resistance is located directly at 0.007 BTC (100-days EMA) and 0.0075 BTC. Above this, resistance lies at 0.008 BTC (200-days EMA), 0.00819 BTC (bearish .382 Fib retracement), and 0.0085 BTC. Alternatively, if the sellers regroup and push Monero lower, support can be found at 0.0065 BTC and 0.0061 BTC. Beneath this, additional support is found at 0.0058 BTC and 0.0055 BTC.

