XRP continues to hold strong as it trades sideways along with the %excerpt%.21 level.Against BTC, it managed to climb back above the 2600 SAT level but the bulls look pretty weak.The RSI remains above the 50 level which shows that the momentum remains in the hands of the bulls at this moment in time.Key Support & Resistance LevelsXRP/USDSupport: %excerpt%.21, %excerpt%.20, %excerpt%.1850 Resistance: %excerpt%.22, %excerpt%.2283, %excerpt%.2345, %excerpt%.25.XRP/BTC:Support: 2600 SAT, 2350 SAT, 2455 SAT.Resistance: 2710 SAT, 2800 SAT, 2900 SAT.XRP/USD – XRP Claws Itself Back Above %excerpt%.21 – Can We Head Back To %excerpt%.234?On the daily chart above, XRP dropped below the resistance at the 100-days EMA but managed to find support at the %excerpt%.200 level that allowed the market to bounce higher. XRP now is trading above %excerpt%.21 as it sets its sights to
Topics:
Yaz Sheikh considers the following as important: Ripple (XRP) Price, XRP Analysis
This could be interesting, too:
Jordan Lyanchev writes Ripple’s (XRP) Surge to Triggers Over Million in Short Liquidations
Jordan Lyanchev writes Trump Confirms Work on Strategic Crypto Reserve: XRP, ADA, SOL Included
Mandy Williams writes Ripple Releases Institutional DeFi Roadmap for XRP Ledger in 2025
Jordan Lyanchev writes ChatGPT and DeepSeek Analyze Ripple’s (XRP) Price Potential for 2025
- XRP continues to hold strong as it trades sideways along with the $0.21 level.
- Against BTC, it managed to climb back above the 2600 SAT level but the bulls look pretty weak.
- The RSI remains above the 50 level which shows that the momentum remains in the hands of the bulls at this moment in time.
Key Support & Resistance Levels
XRP/USD
Support: $0.21, $0.20, $0.1850
Resistance: $0.22, $0.2283, $0.2345, $0.25.
XRP/BTC:
Support: 2600 SAT, 2350 SAT, 2455 SAT.
Resistance: 2710 SAT, 2800 SAT, 2900 SAT.
XRP/USD – XRP Claws Itself Back Above $0.21 – Can We Head Back To $0.234?
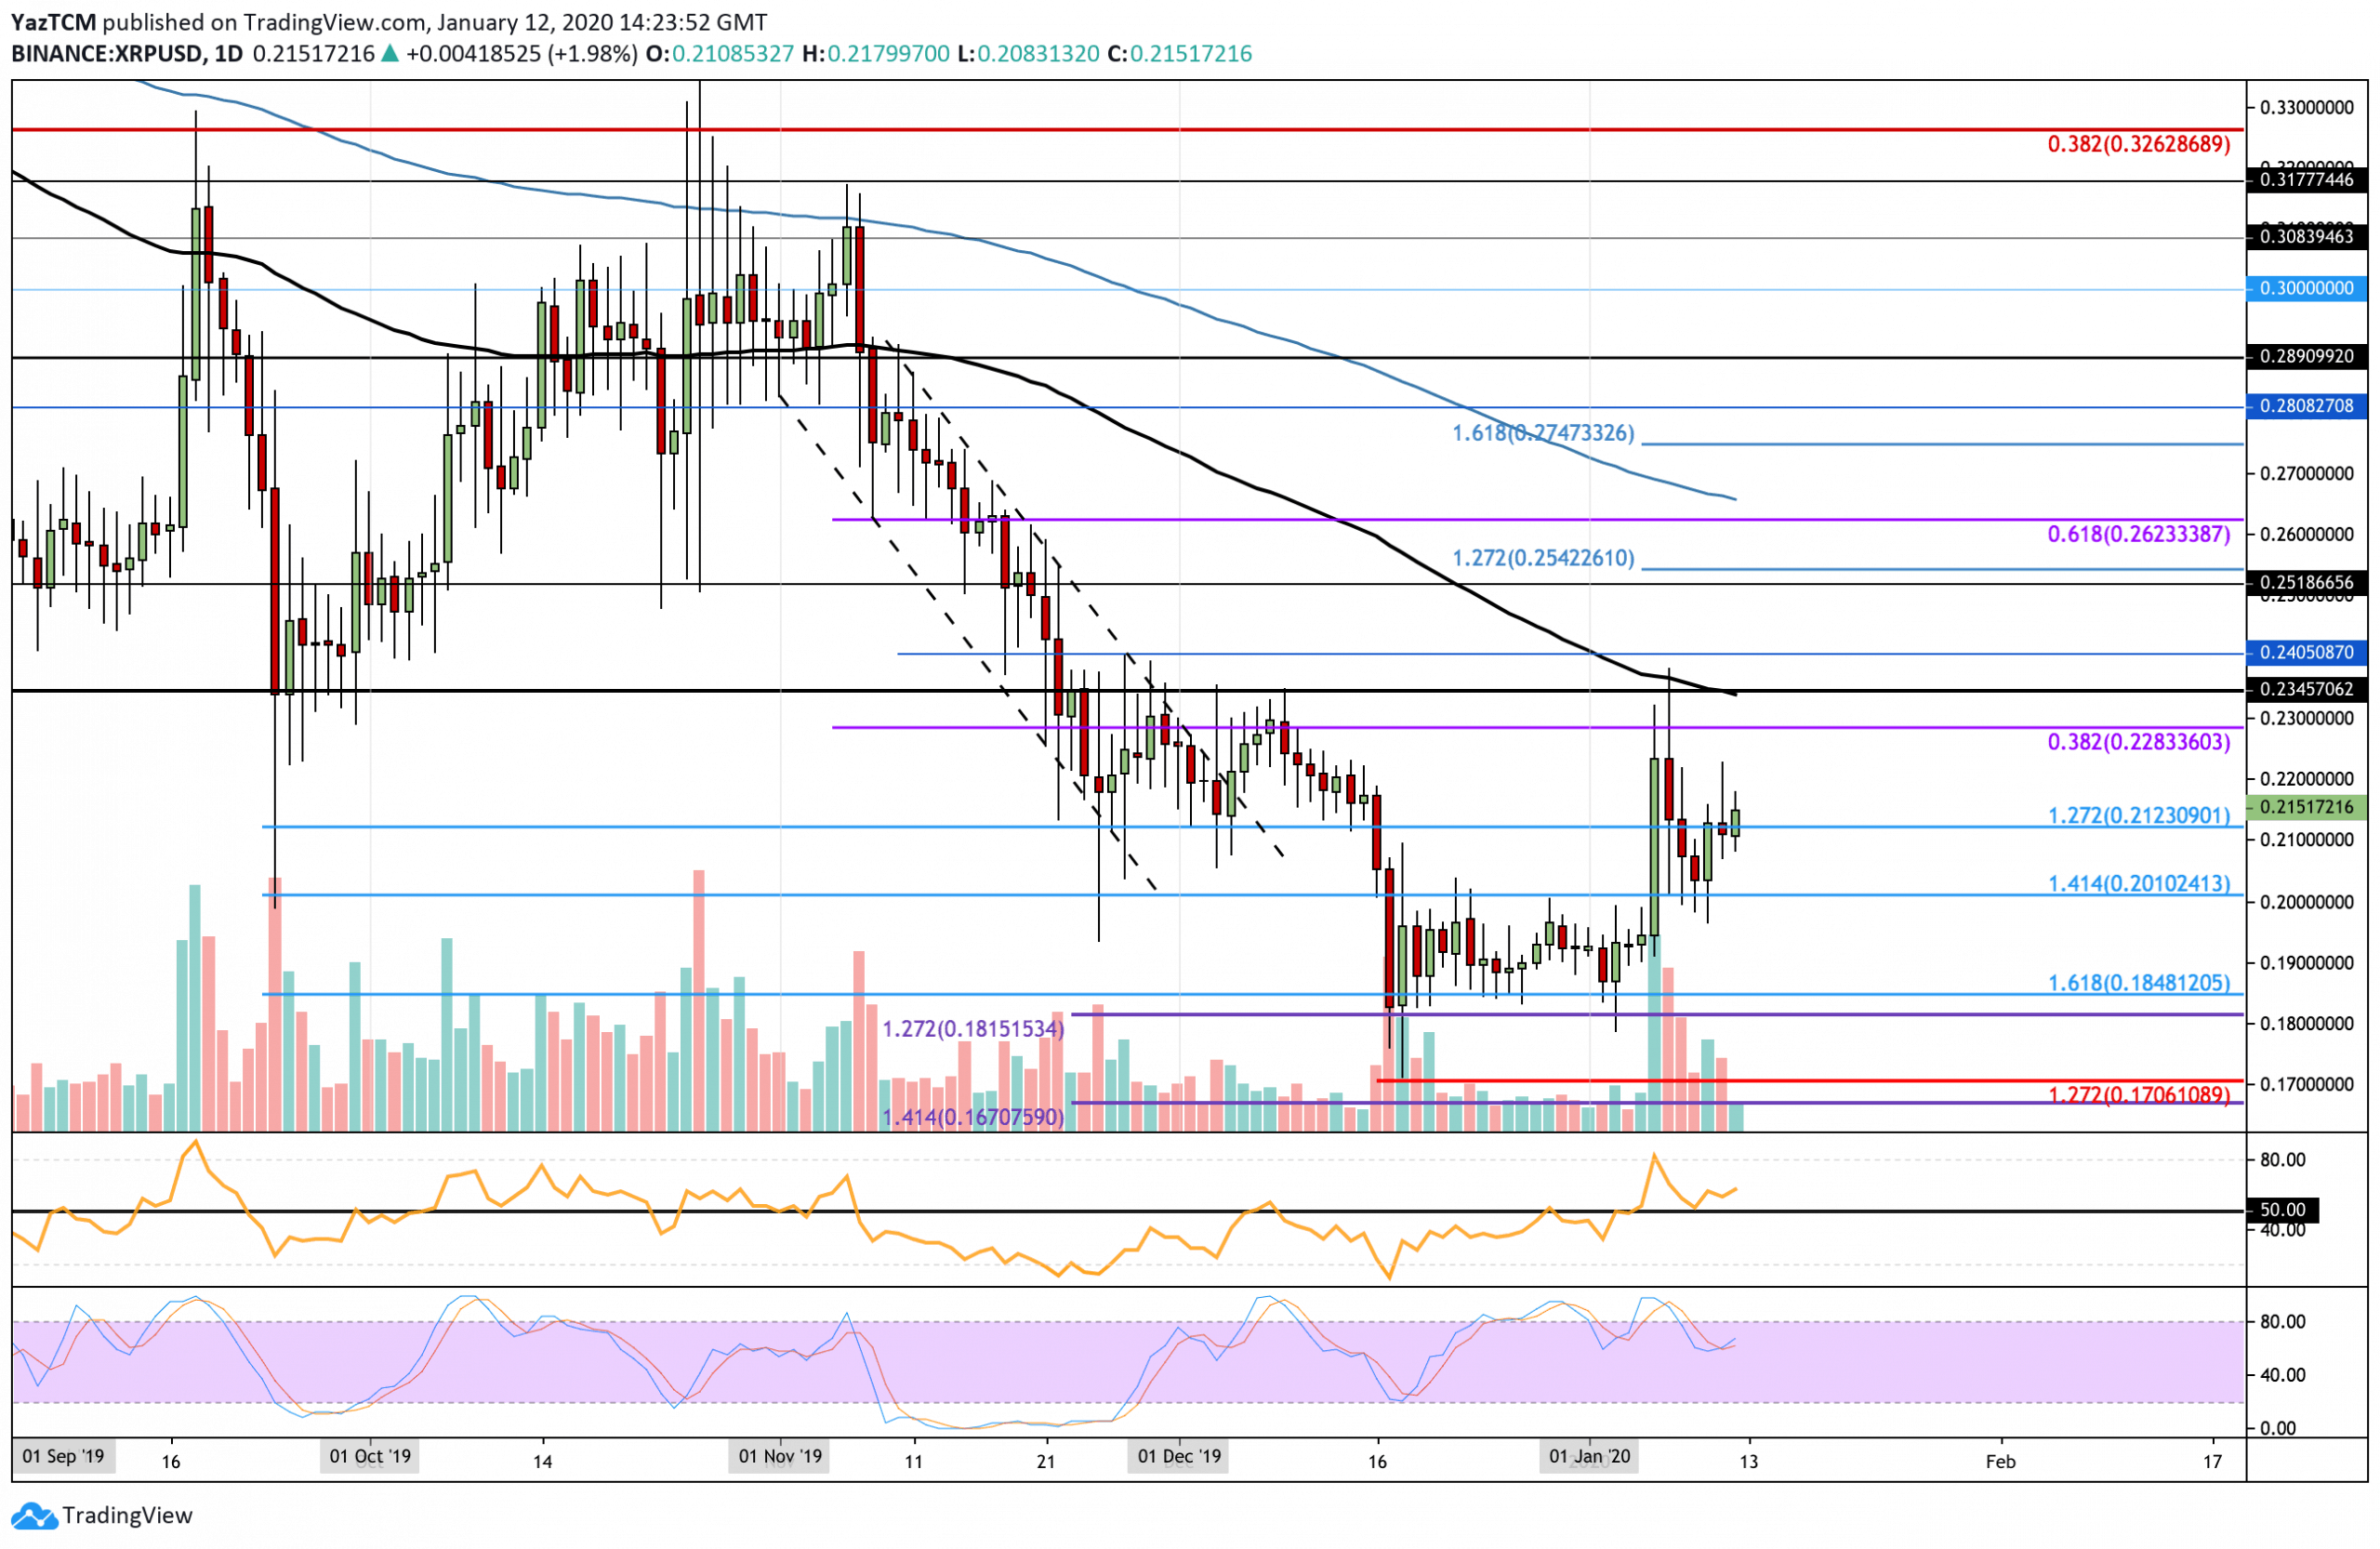
On the daily chart above, XRP dropped below the resistance at the 100-days EMA but managed to find support at the $0.200 level that allowed the market to bounce higher. XRP now is trading above $0.21 as it sets its sights to re-tackle the resistance higher at $0.228.
XRP is still on the bullish footing, however, it must break above the resistance at the 100-days EMA and $0.2345 to confirm a longer-term bullish trading condition. If XRP was to drop back beneath $0.20 it would turn neutral with a further drop beneath $0.182 turning it bearish.
XRP Short Term Price Prediction
If the bulls continue to rise from the $0.21 level, an initial resistance is located at $0.22 and $0.228 (bearish .382 Fibonacci Retracement level). Immediately above this lies very strong resistance at $0.234 where lies the 100-days EMA. If the buyers break above the 100-days EMA, higher resistance lies at $0.24 and $0.25. On the other hand, if the sellers push the market lower, support is located at $0.21, $0.20, and $0.19.
The RSI has rebounded at the 50 level which shows that the buyers are still not ready to give up on their control over the market momentum. So long as the RSI remains above 50, there is a strong chance for XRP to contest the 100-days EMA.
XRP/BTC: XRP Rebounds From 2530 SAT and Climbs Back Above 2600 SAT
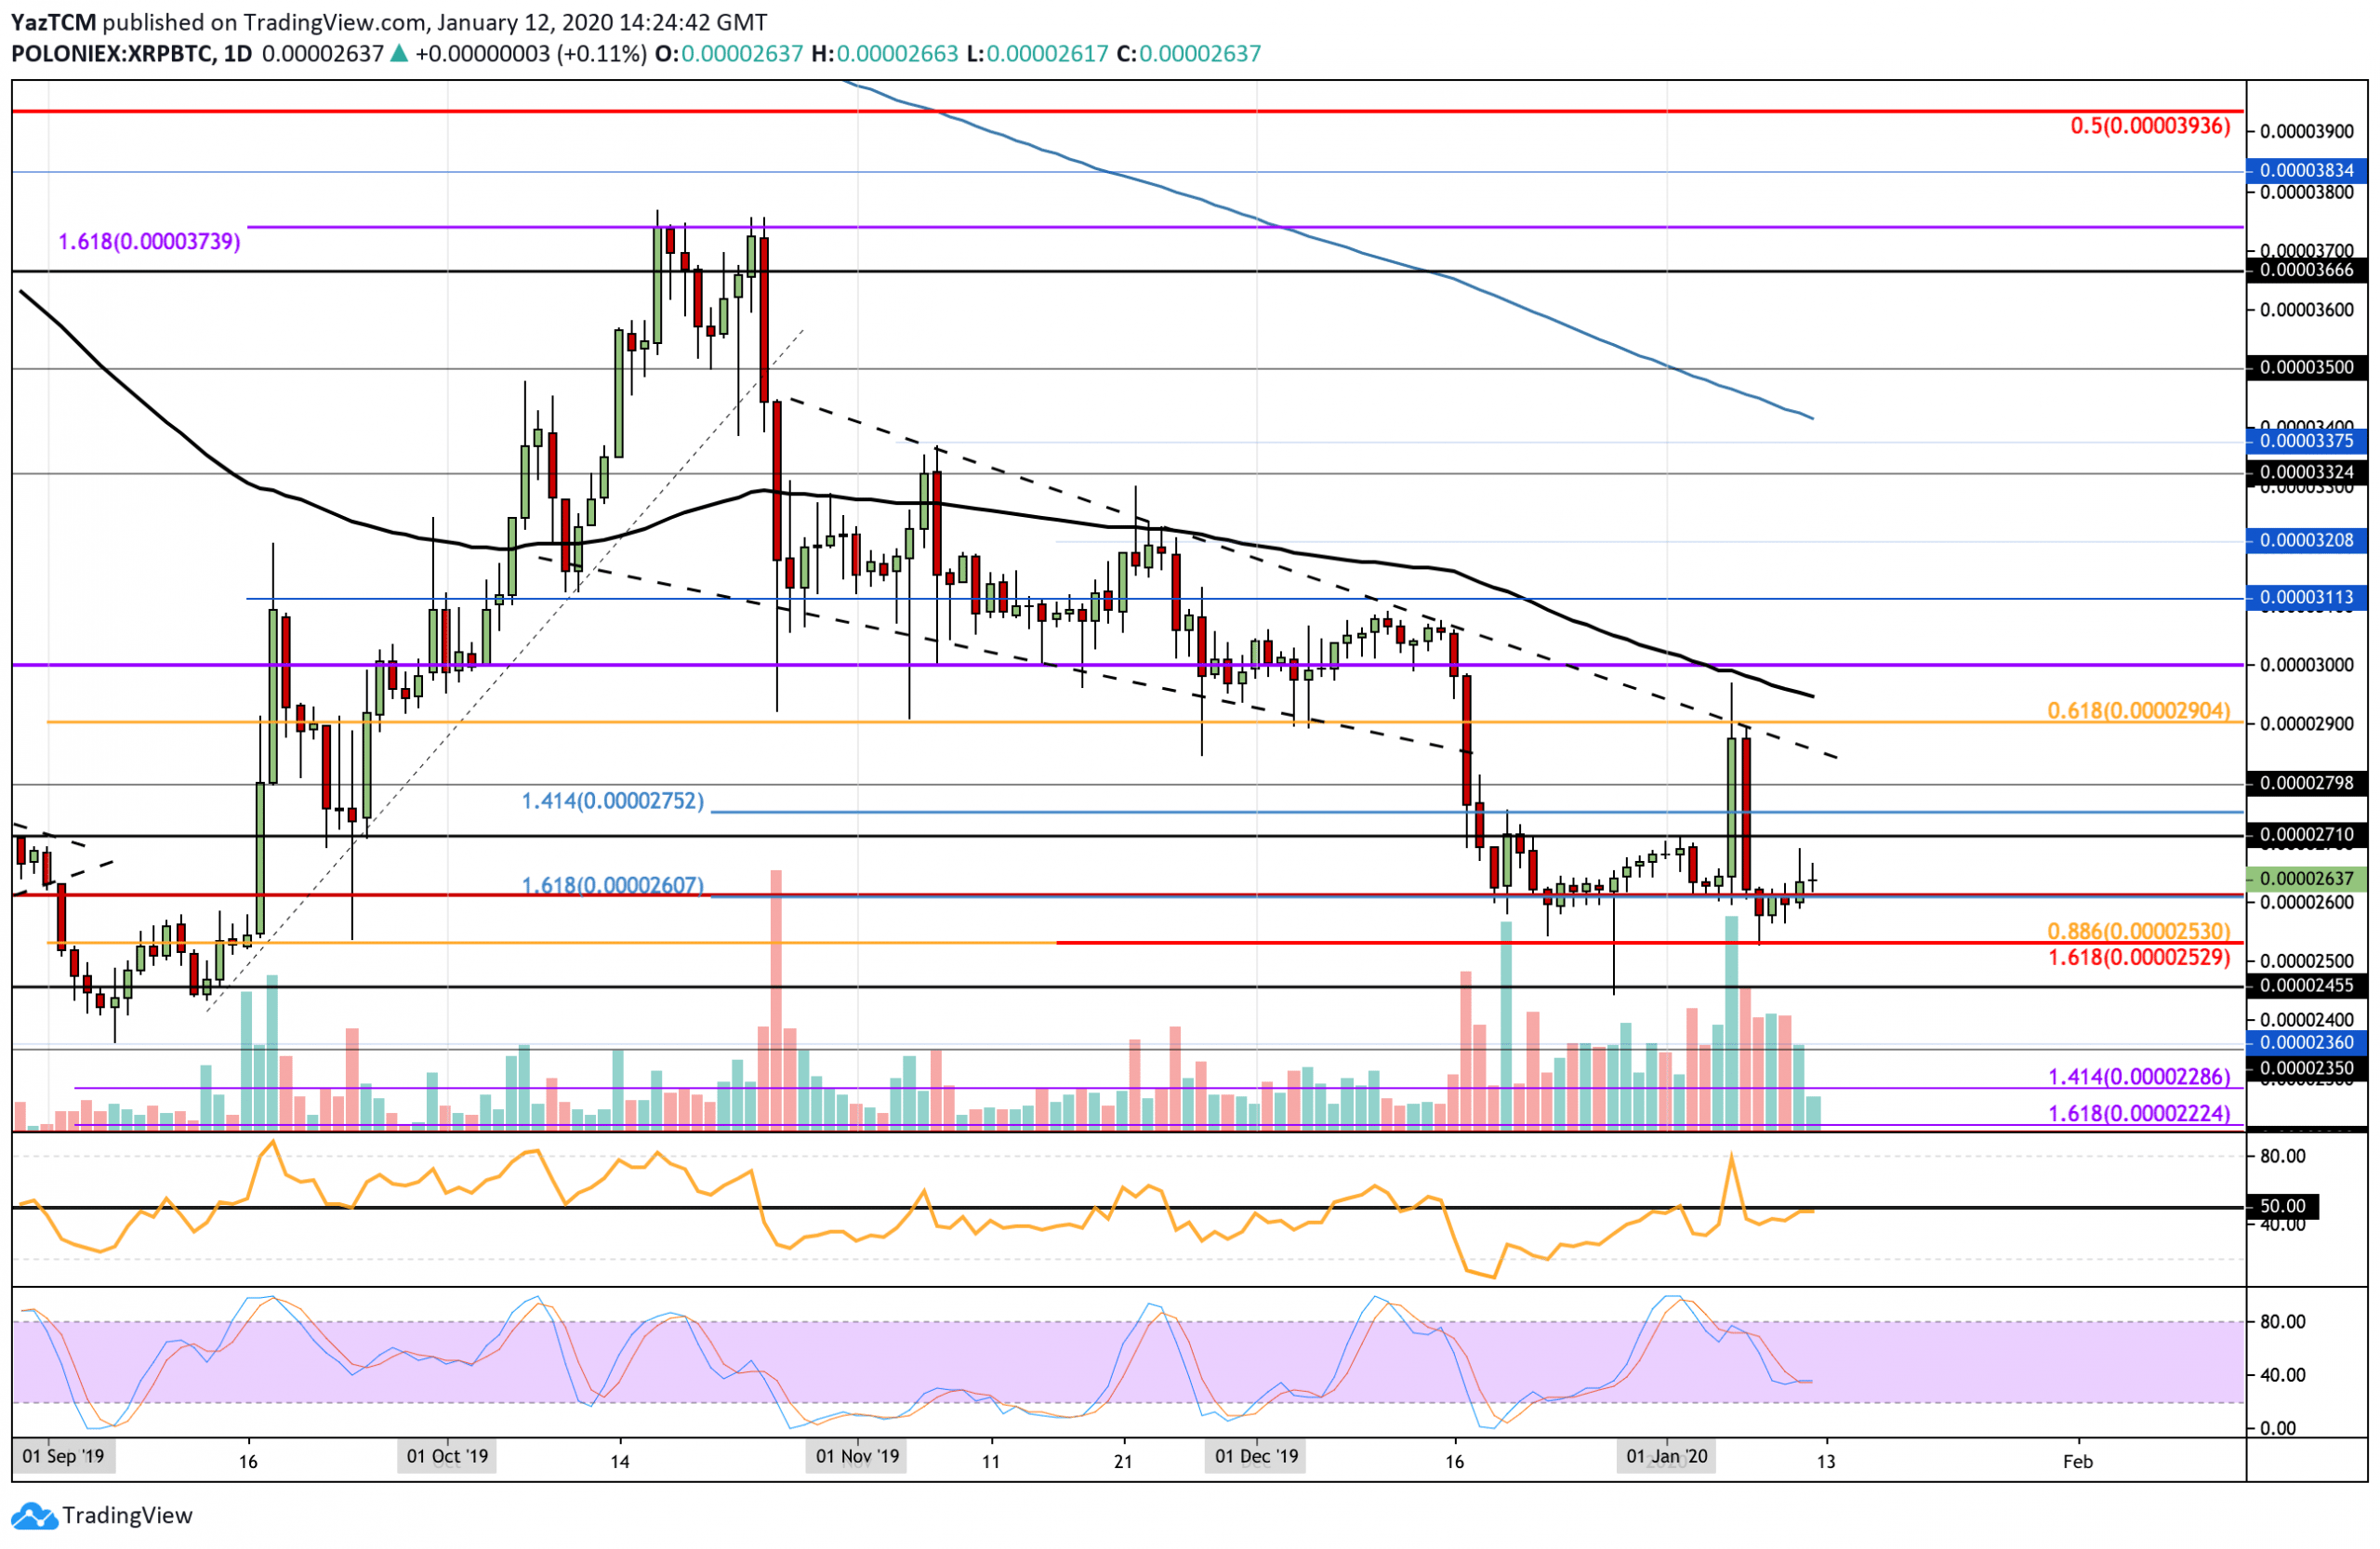
Against Bitcoin, XRP managed to rebound at the support found at 2350 SAT (.886 Fib Retracement) and started to climb higher to break back above 2600 SAT. However, the market still looks pretty weak and there could be a sudden drop beneath 2600 SAT at any moment if the bulls do not charge up.
XRP is currently in a neutral market at the moment, however, if it was to fall beneath 2530 SAT it would turn instantly bearish. To turn bullish, XRP must rise higher above the 2900 SAT level and penetrate 3000 SAT.
XRP Short Term Price Prediction
If the bulls can continue to climb higher from the support at 2600 SAT, an initial resistance is located at 2710 SAT. Above this, resistance lies at 2750 SAT, 2800 SAT, and 2900 SAT. Beyond 2900 SAT, resistance is expected at 2950 SAT (100-days EMA) and 3000 SAT. Alternatively, if the sellers step in and push XRP beneath 2600 SAT, immediate support is found at 2350 SAT. Beneath this, additional support is located at 2455 SAT and 2400 SAT.
The RSI is trading slightly below the 50 level which shows that the sellers are still in charge of the market momentum, however, there is major indecision between both bulls and bears. For XRP to head toward the 2710 SAT level, the RSI must rise and break above 50 to show that the bulls are in control over the market momentum.