BitcoinBitcoin set a new ATH today at ,688 (Coinbase) after seeing a 23% price hike over the past week. The coin penetrated beyond ,000 last Friday and continued higher over the weekend. On Wednesday, Bitcoin continued to surge beyond ,000 and continued over the following days to set the new ATH today.With the recent bullish momentum in the market, Bitcoin could beyond the coveted ,000 over the next week.Looking ahead, the first level of resistance lies at ,000. This is followed by ,500 and ,000. Beyond ,000 added resistance is found at ,600, ,000, and ,900 (long term 1.618 Fib Extension).On the other side, the first level of support lies at ,732. This is followed by ,000, ,163, ,000, and ,000 (.382 Fib).BTC/USD Daily Chart. Source:
Topics:
Yaz Sheikh considers the following as important: Binance Coin (BNB) Price, Bitcoin (BTC) Price, BNBBTC, bnbusd, BTCEUR, BTCGBP, btcusd, btcusdt, DOTBTC, DOTUSD, ETH Analysis, ETHBTC, Ethereum (ETH) Price, ethusd, Market Updates, polkadot, Price Analysis, Ripple (XRP) Price, XRP Analysis, xrpbtc, xrpusd
This could be interesting, too:
Chayanika Deka writes XRP, SOL, and ADA Inclusion in US Crypto Reserve Pushes Traders on Edge
Chayanika Deka writes Why Arthur Hayes Is Bullish on Bitcoin Under Trump’s Economic Strategy
Mandy Williams writes Why the Bitcoin Market Is Stuck—and the Key Metric That Could Change It: CryptoQuant CEO
Wayne Jones writes Metaplanet Acquires 156 BTC, Bringing Total Holdings to 2,391
Bitcoin
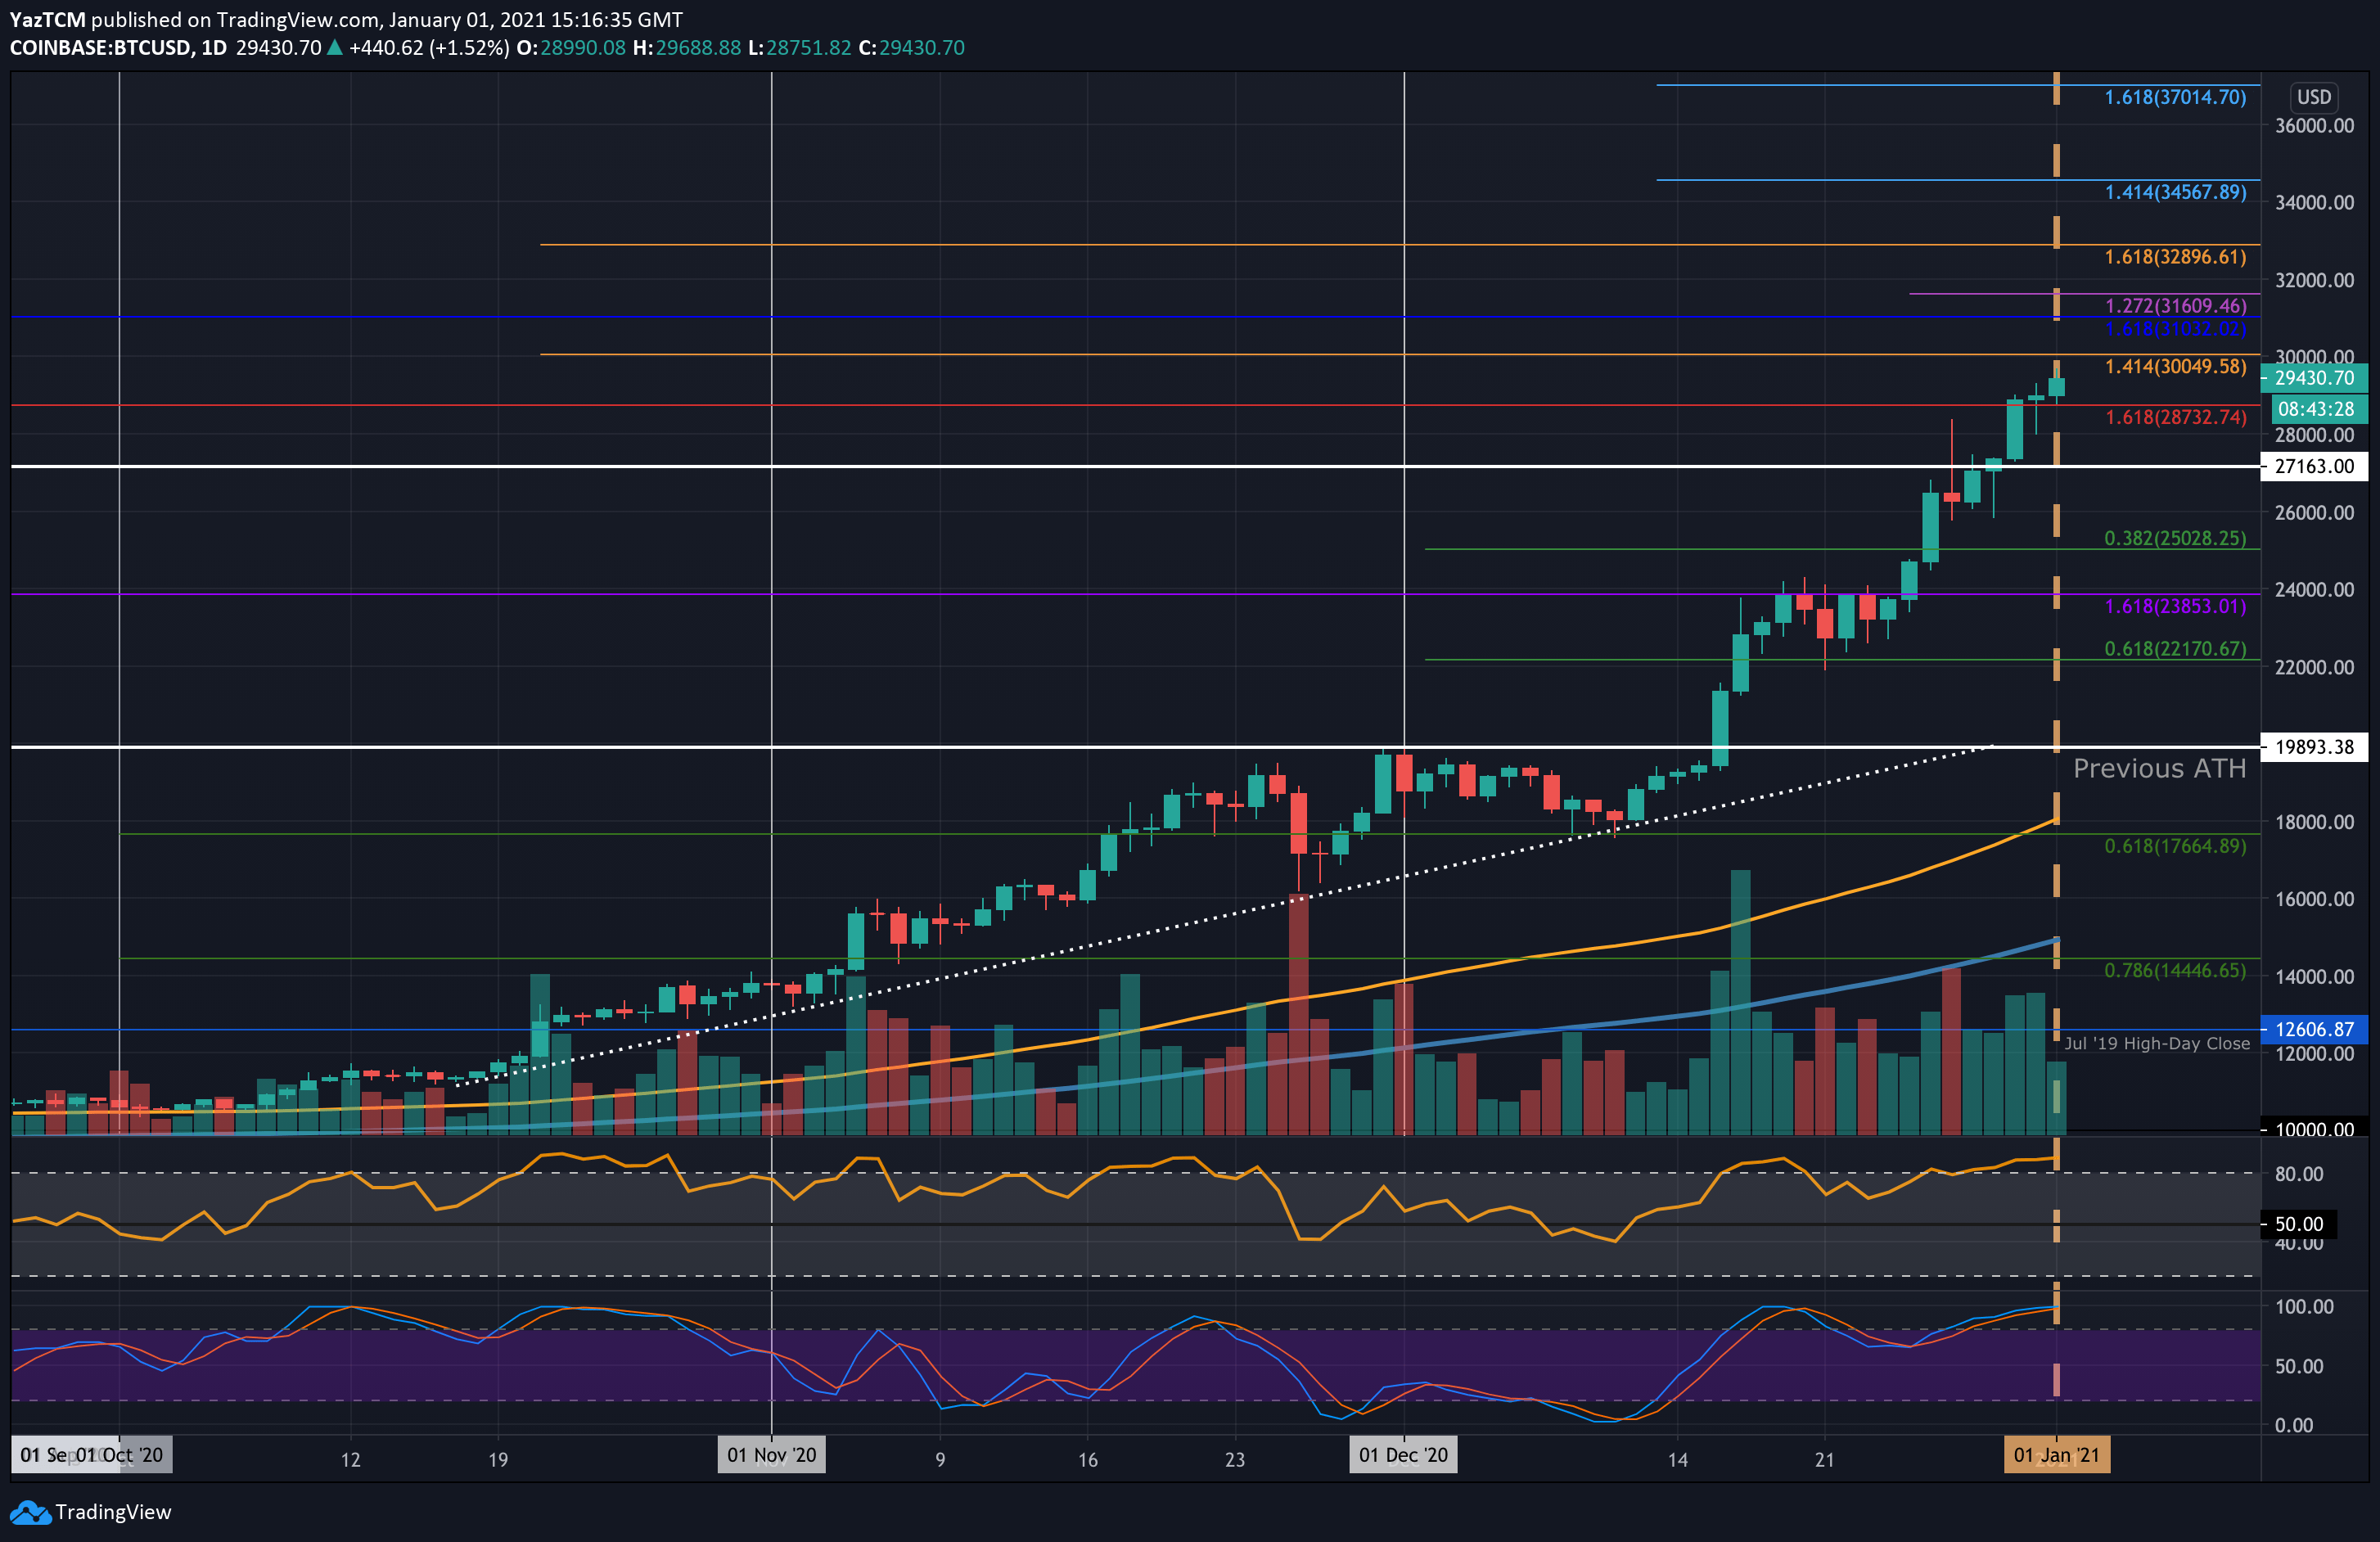
Bitcoin set a new ATH today at $29,688 (Coinbase) after seeing a 23% price hike over the past week. The coin penetrated beyond $24,000 last Friday and continued higher over the weekend. On Wednesday, Bitcoin continued to surge beyond $28,000 and continued over the following days to set the new ATH today.
With the recent bullish momentum in the market, Bitcoin could beyond the coveted $30,000 over the next week.
Looking ahead, the first level of resistance lies at $30,000. This is followed by $30,500 and $31,000. Beyond $31,000 added resistance is found at $31,600, $32,000, and $32,900 (long term 1.618 Fib Extension).
On the other side, the first level of support lies at $28,732. This is followed by $28,000, $27,163, $26,000, and $25,000 (.382 Fib).
Ethereum
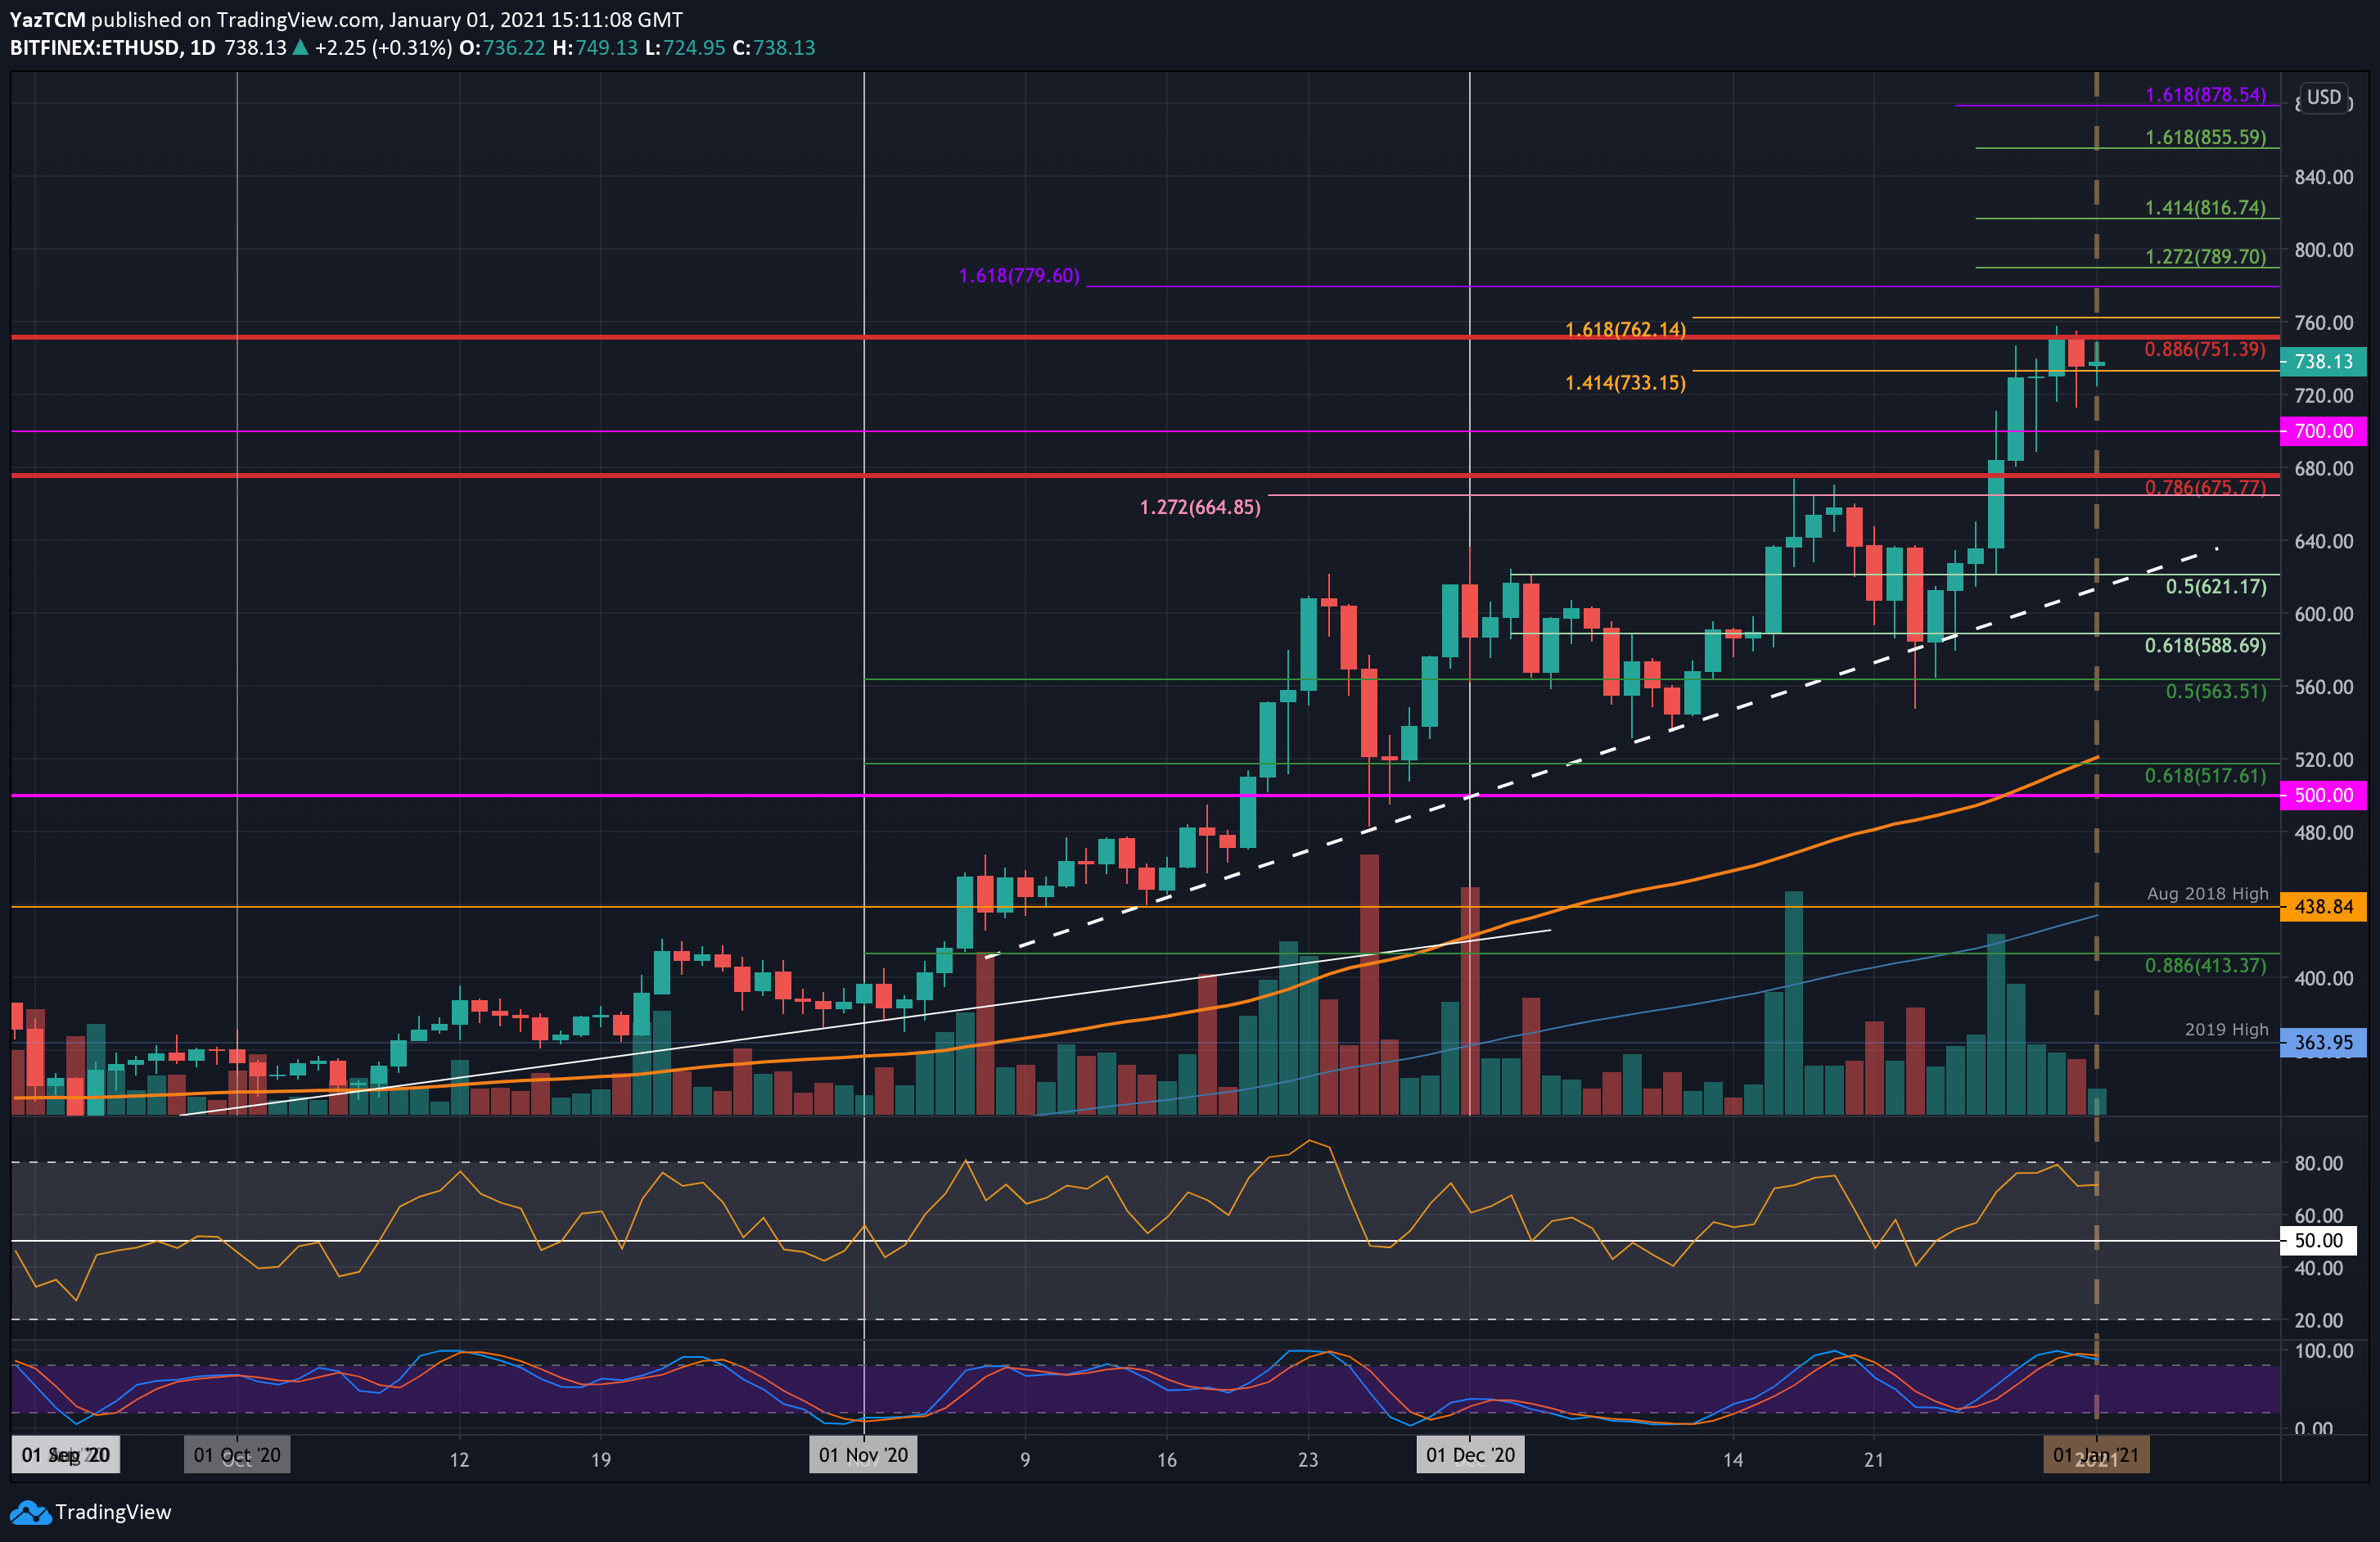
Ethereum saw its own 19% price surge this week as the coin trades near $740. The coin spiked back above $600 last Friday and continued higher over the weekend to break resistance at $675 (bearish .786 Fib). On Monday, ETH continued beyond $700 as it reached the resistance at $750 (bearish .886 Fib) by Wednesday.
From there, ETH has struggled to break beyond the $750 resistance but is doing well to hold the support at $730.
Moving forward, if the buyers push higher, the first level of resistance lies at $750. This is followed by $780, $790 (1.272 FIb Extension), $800, and $816 (1.414 Fib extension). Added resistance is expected at $840, $855, and $880.
On the other side, the first level of support beneath $730 lies at $720. This is followed by $700, $675, $665, and $621 (.618 Fib Retracement).
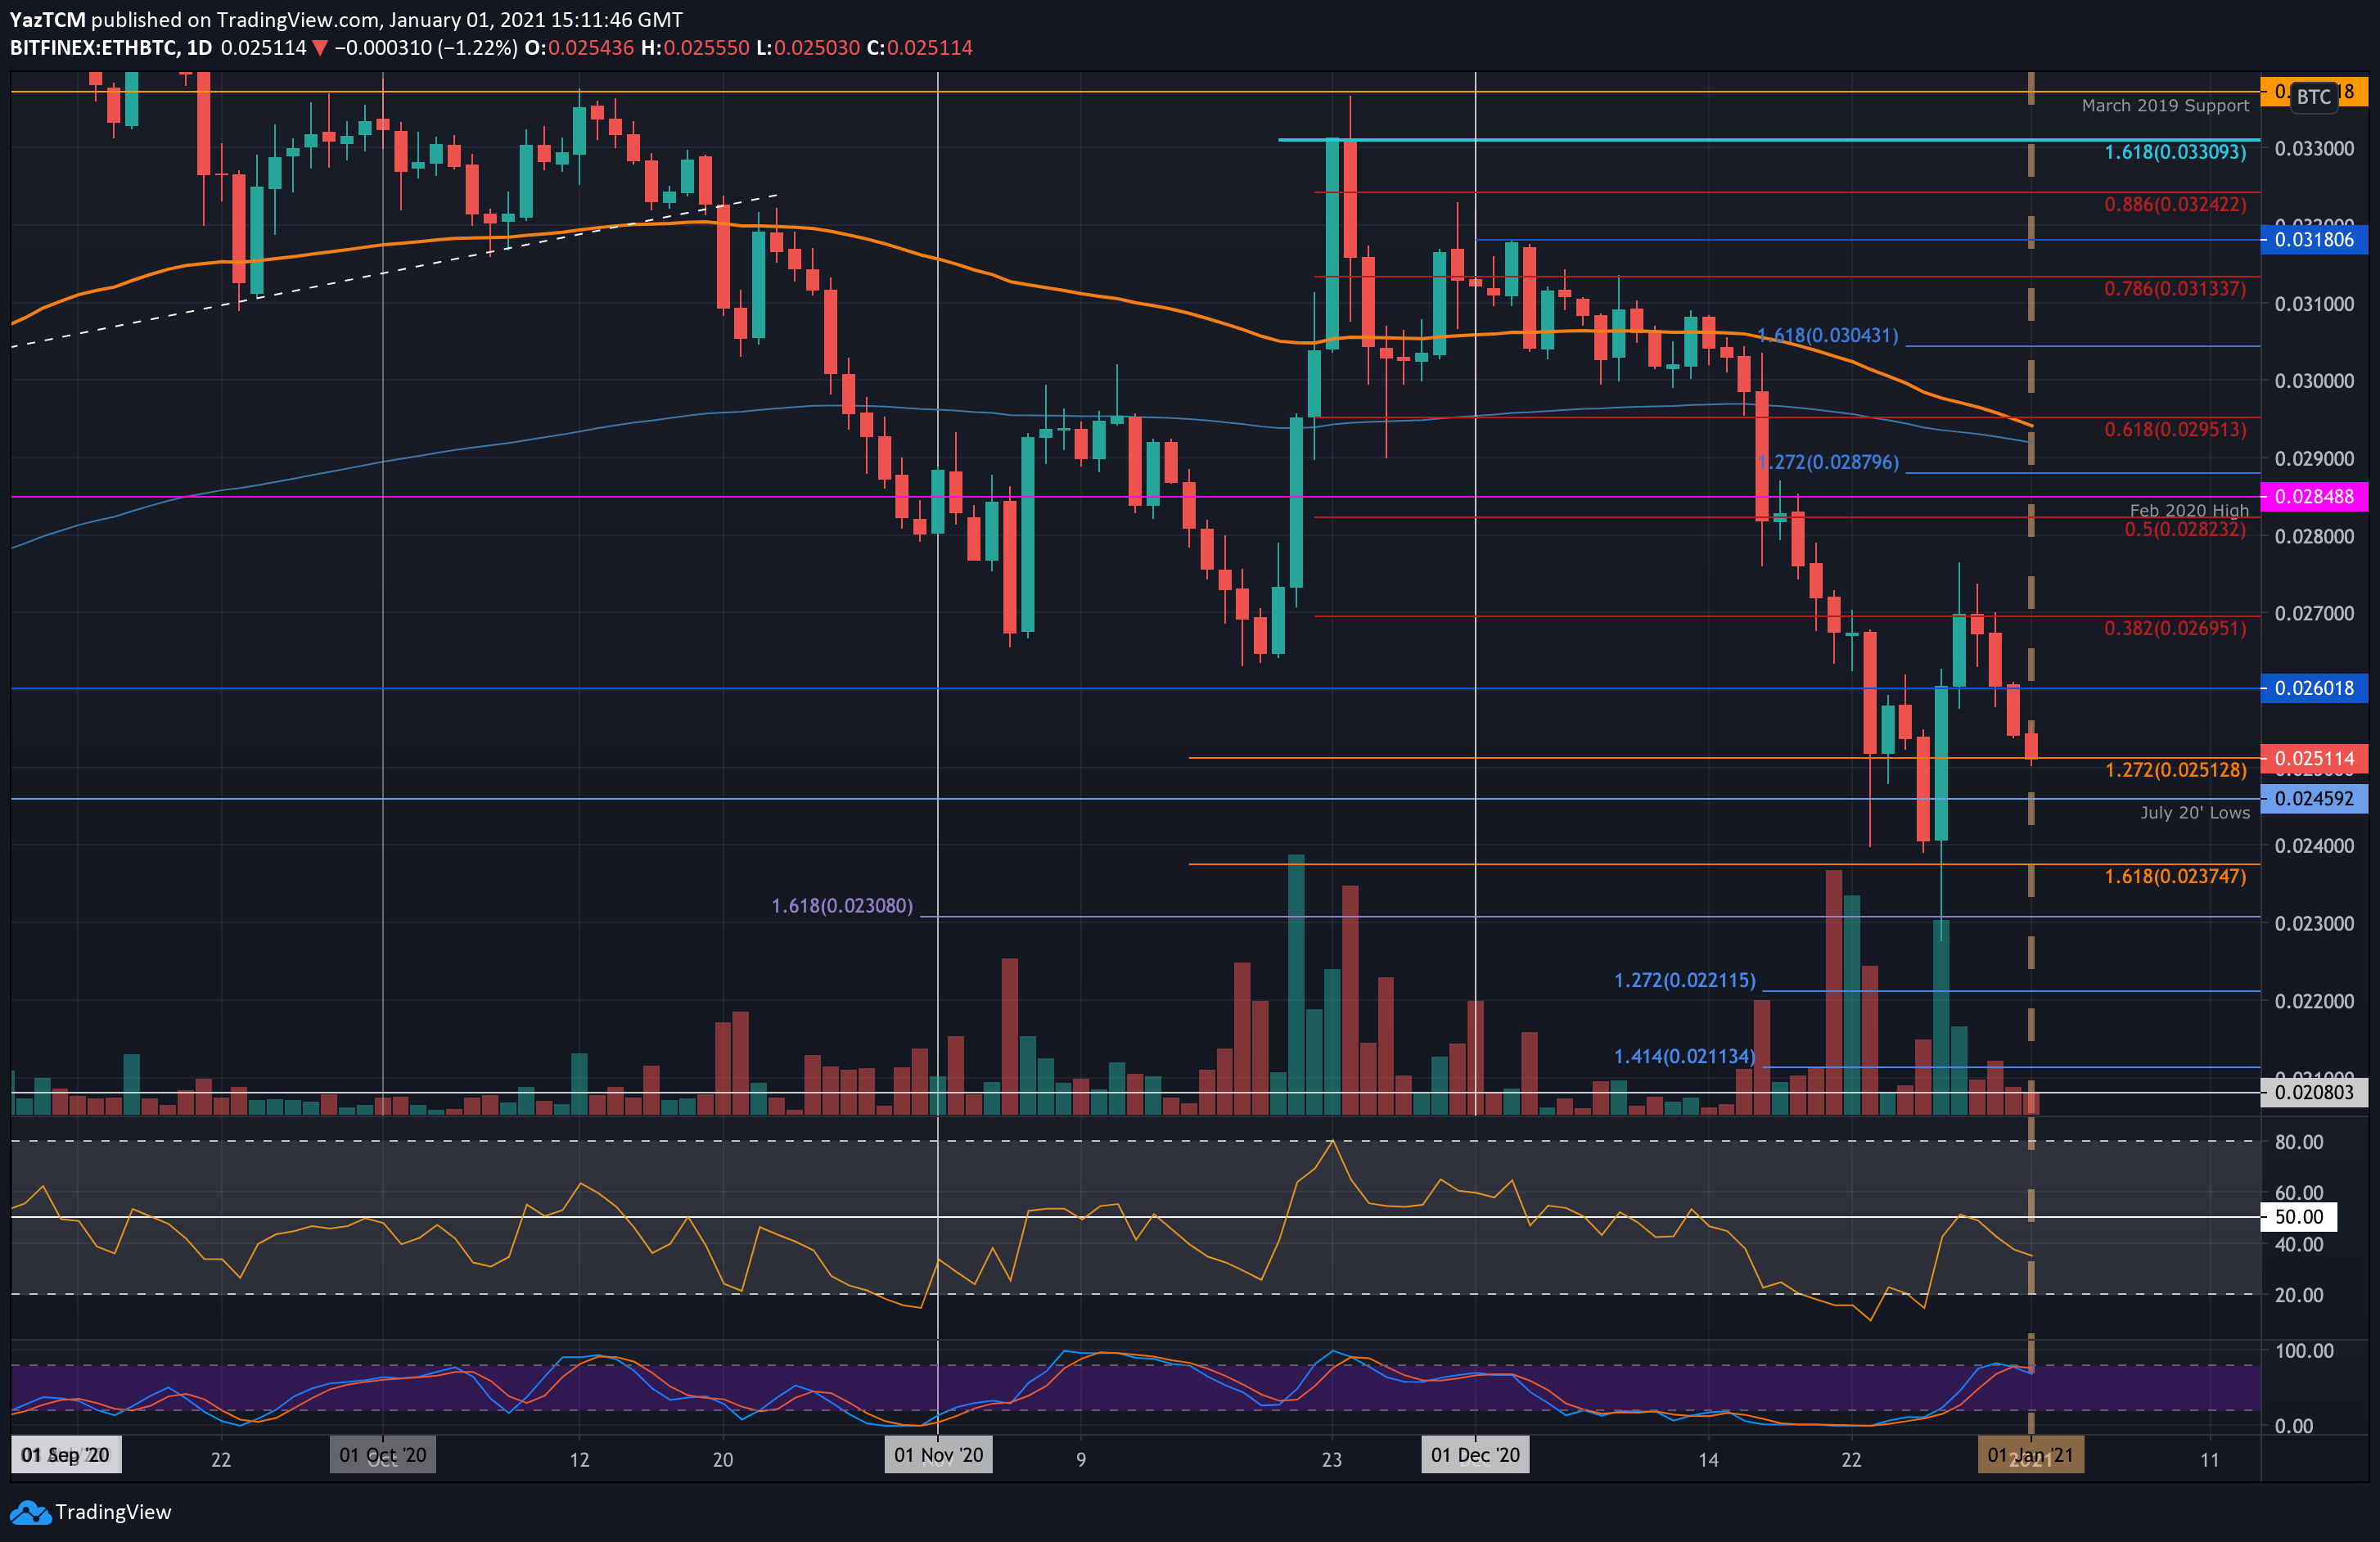
Against Bitcoin, Ethereum rebounded from the support at 0.024 BTC last Friday. It continued to push higher over the weekend and met the resistance at 0.027 BTC (bearish .382 Fib Retracement) on Monday.
ETH was unable to break above the 0.027 BTC resistance throughout the week and eventually rolled over and headed lower. It fell beneath 0.026 BTC yesterday to meet the current support at 0.025 BTC (downside 1.272 Fib Extension) today.
Looking ahead, if the bears push back beneath 0.025 BTC, the first level of support is expected at 0.0245 BTC (July 2020 Lows). This is followed by 0.024 BTC, 0.0237 BTC, and 0.023 BTC.
On the other side, the first level of resistance lies at 0.026 BTC. This is followed by 0.027 BTC (bearish .382 Fib), 0.028 BTC, 0.0285 BTC (Feb 2020 Highs).
Ripple
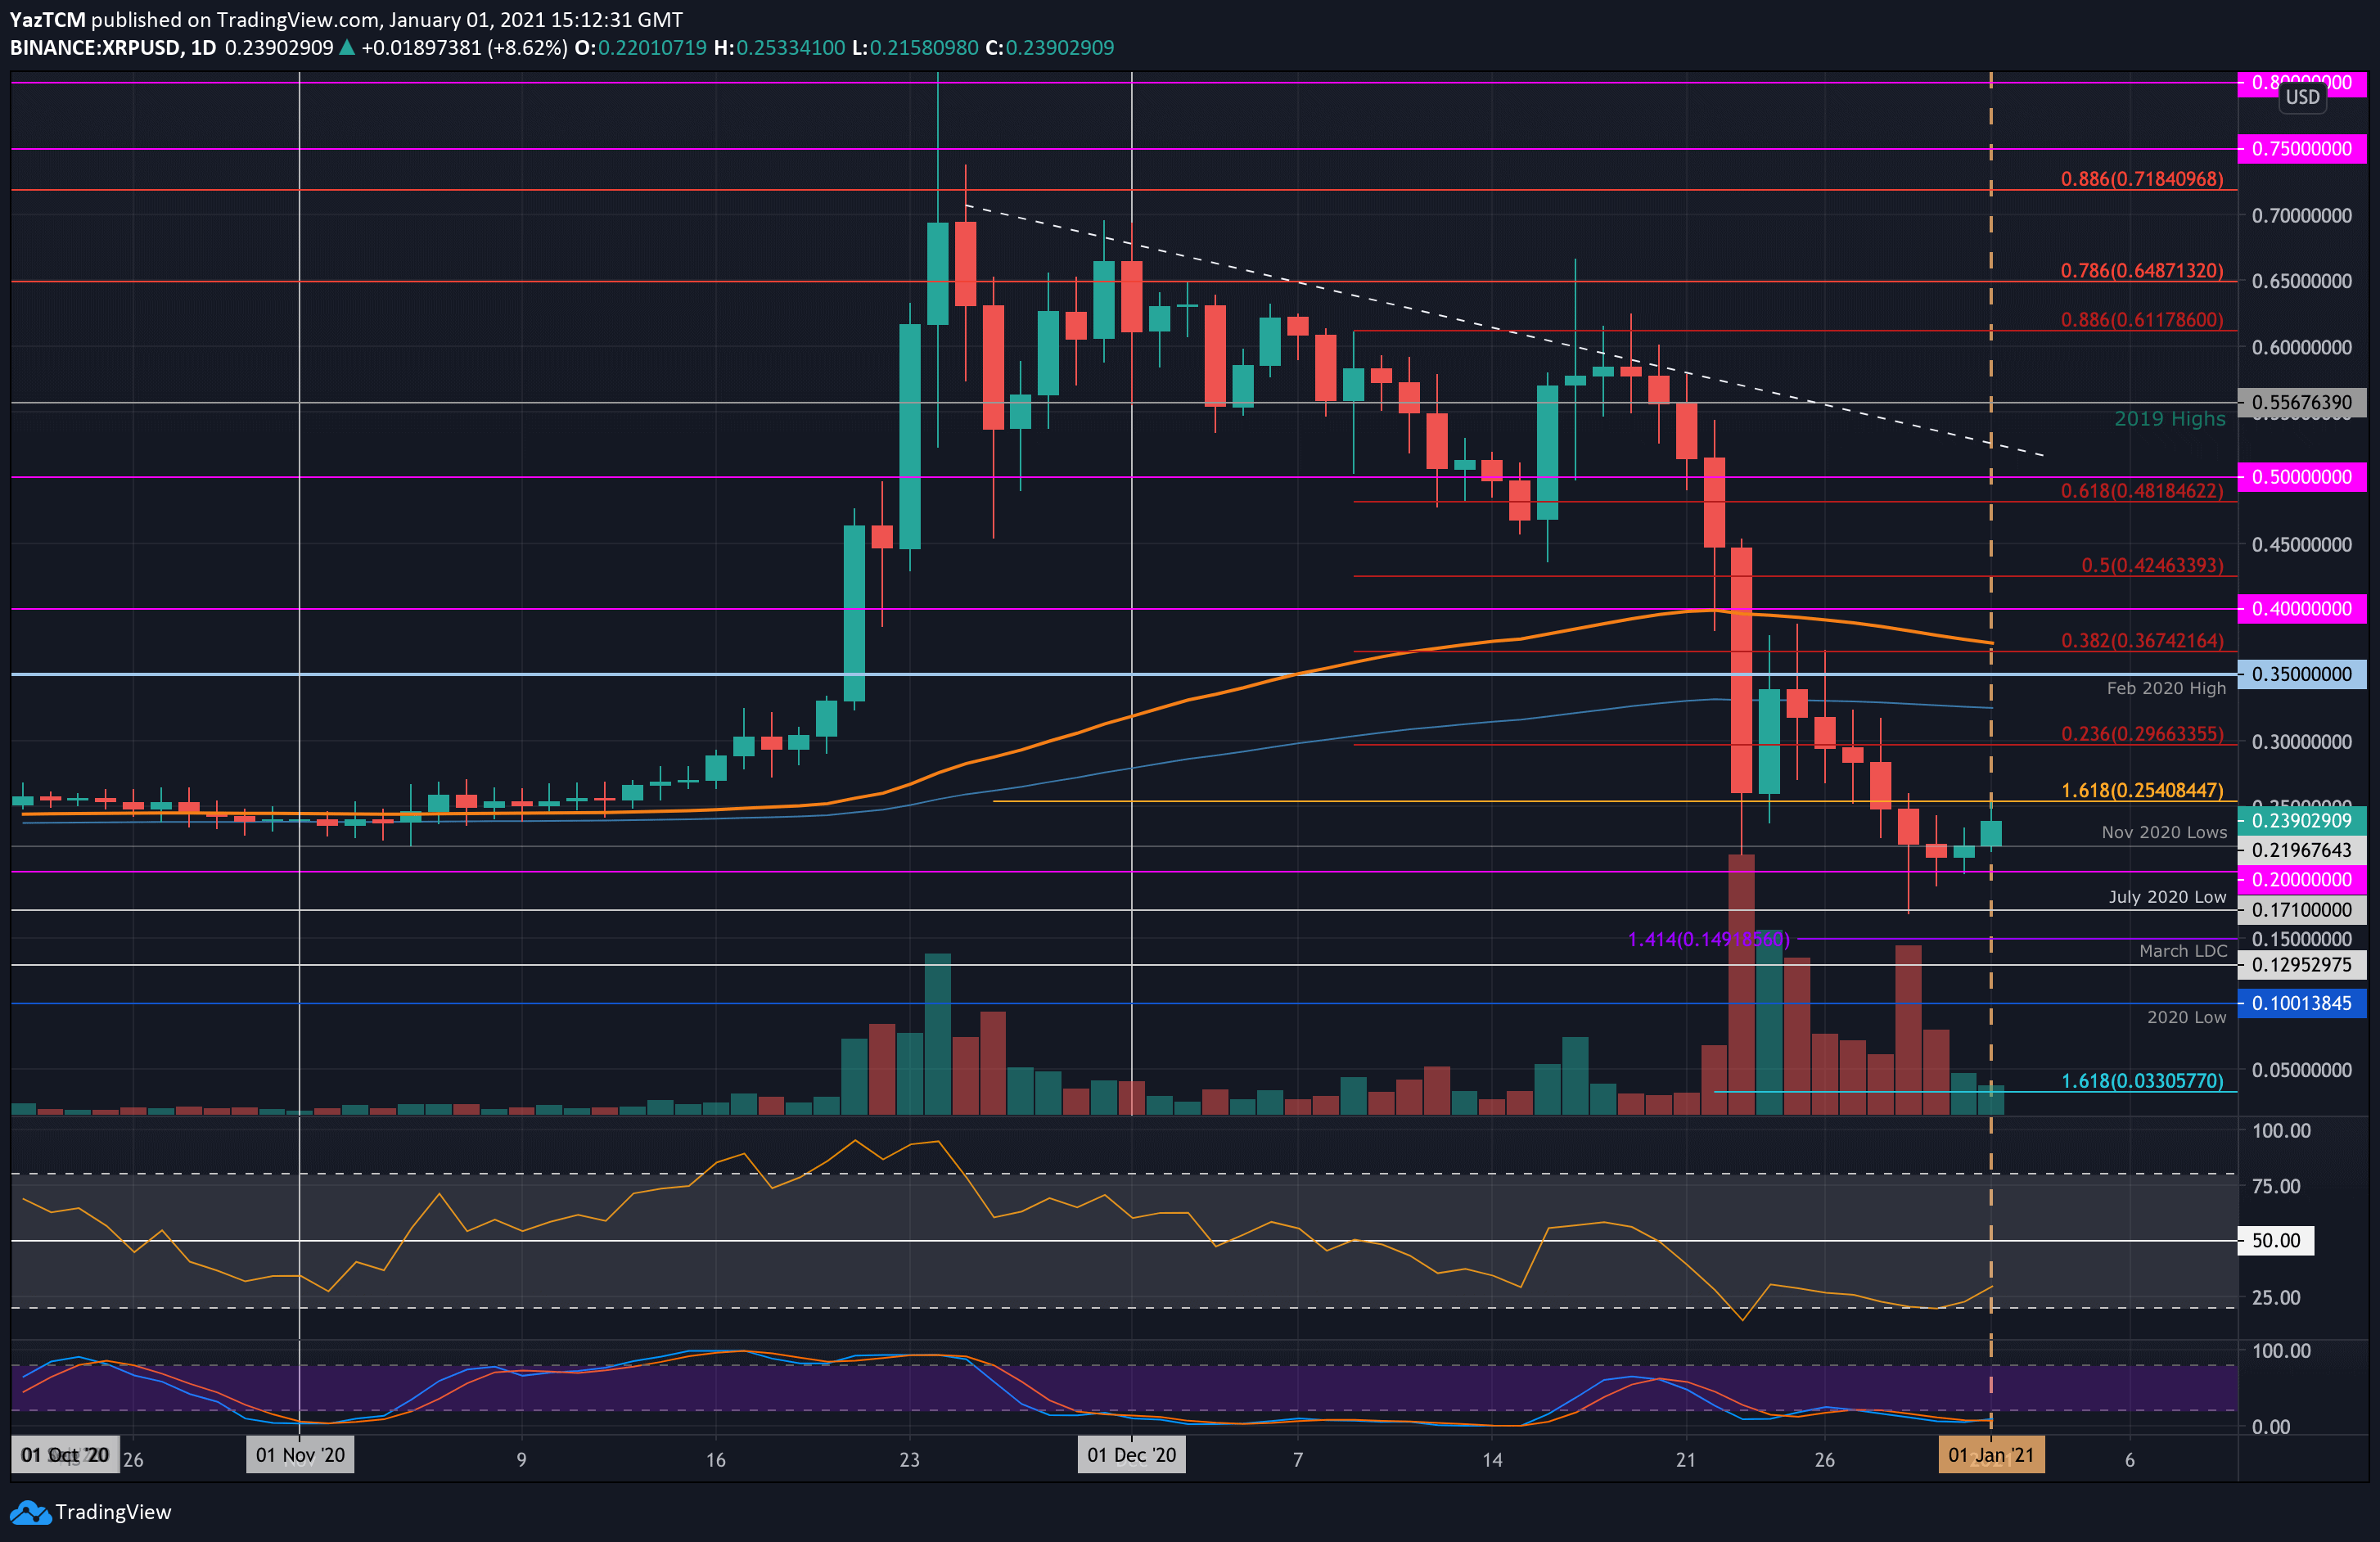
XRP suffered another precipitous 30% price plummet this week as it trades at $0.0239. It pushed beneath this level over the previous two days and had even spiked as low as $0.171 on Tuesday, where it found support at July 2020 low.
Luckily, the buyers regrouped from this low and started to attempt to recover for XRP as it pushed back above the November 2020 lows at $0.219 today to approach $0.24.
Moving forward, if the buyers continue to drive higher, the first level of resistance lies at $0.254. This is followed by $0.3 (bearish .236 Fib), $0.325 (200-days EMA), and $0.35 (Feb 2020 Highs).
Alternatively, the first level of support lies at $0.219 (Nov 2020 Low). This is followed by $0.2, $0.171 (July 2020 low), and $0.15.
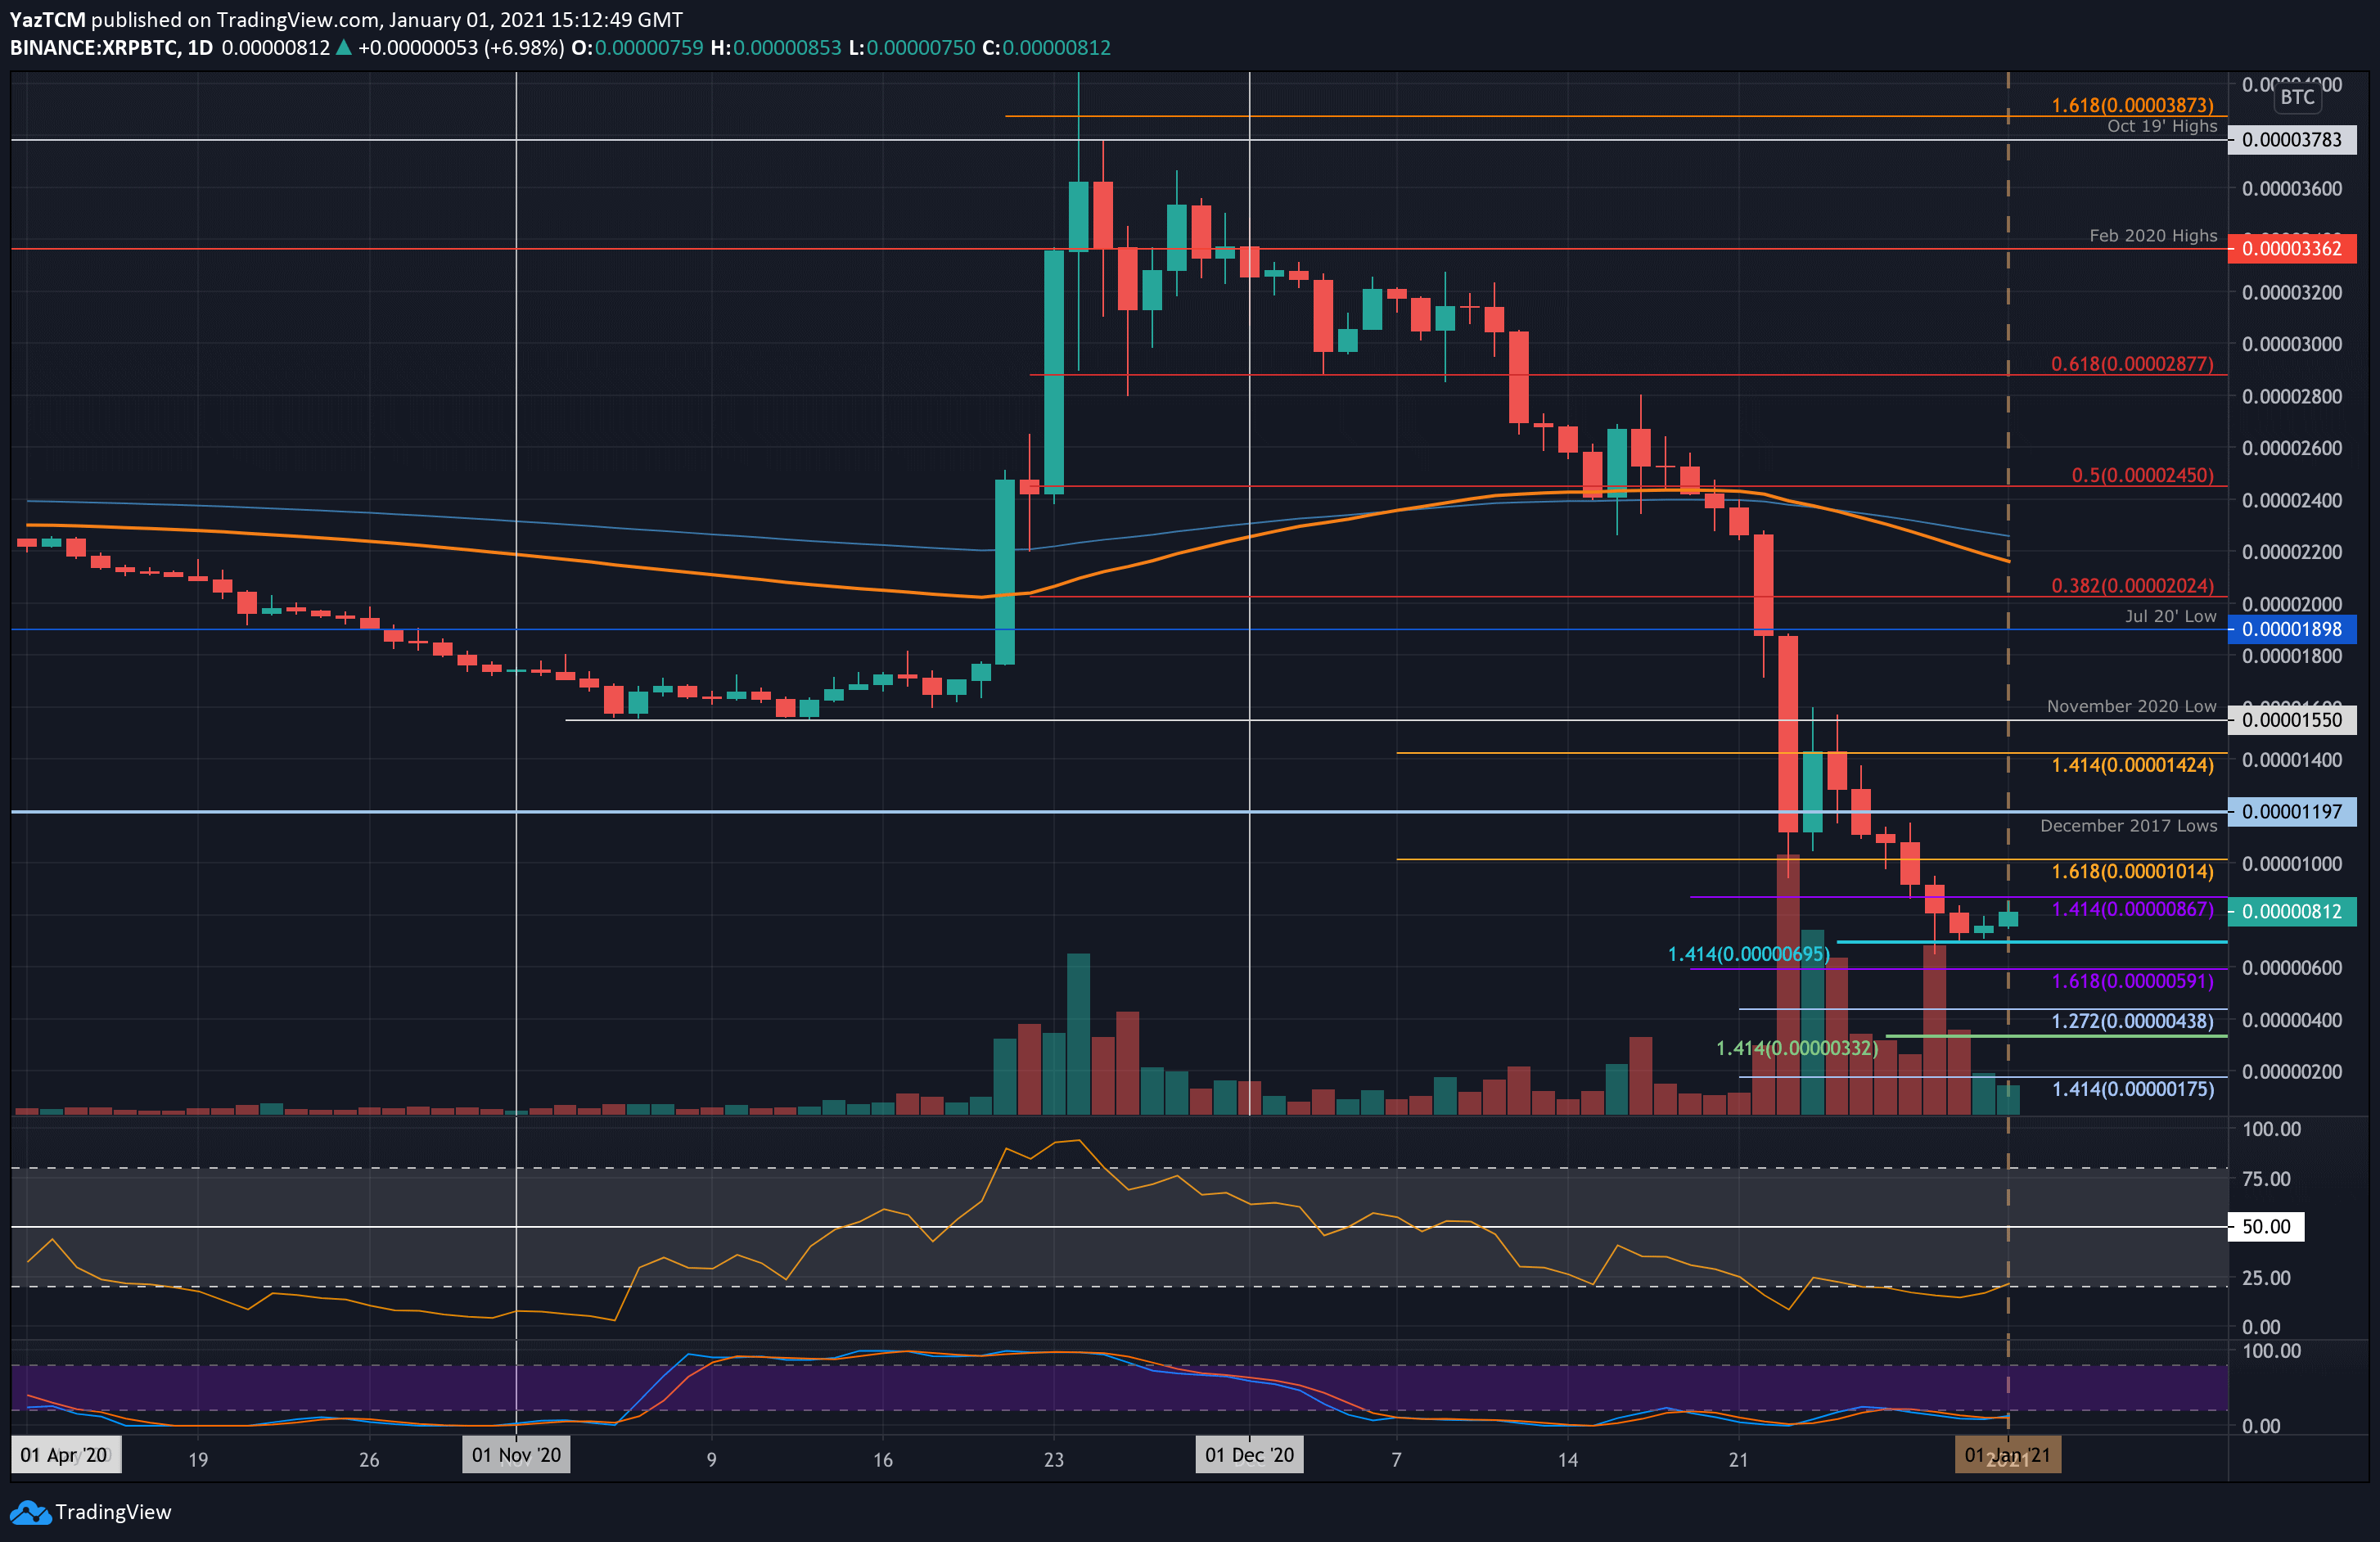
XRP also struggled against Bitcoin as it dropped from 1400 SAT to reach as low as 695 SAT (downside 1.414 Fib Extension) yesterday. Luckily, the coin rebounded from here yesterday and is starting to push higher as it trades at 812 SAT.
Moving forward, if the buyers can continue to drive higher, the first level of strong support is located at 1000 SAT. This is followed by 1200 SAT (December 2017 Lows), 1425 SAT, and 1550 SAT (November 2020 low).
On the other side, the first level of support is expected at 750 SAT. This is followed by 695 SAT, 590 SAT, and 440 SAT.
Binance Coin
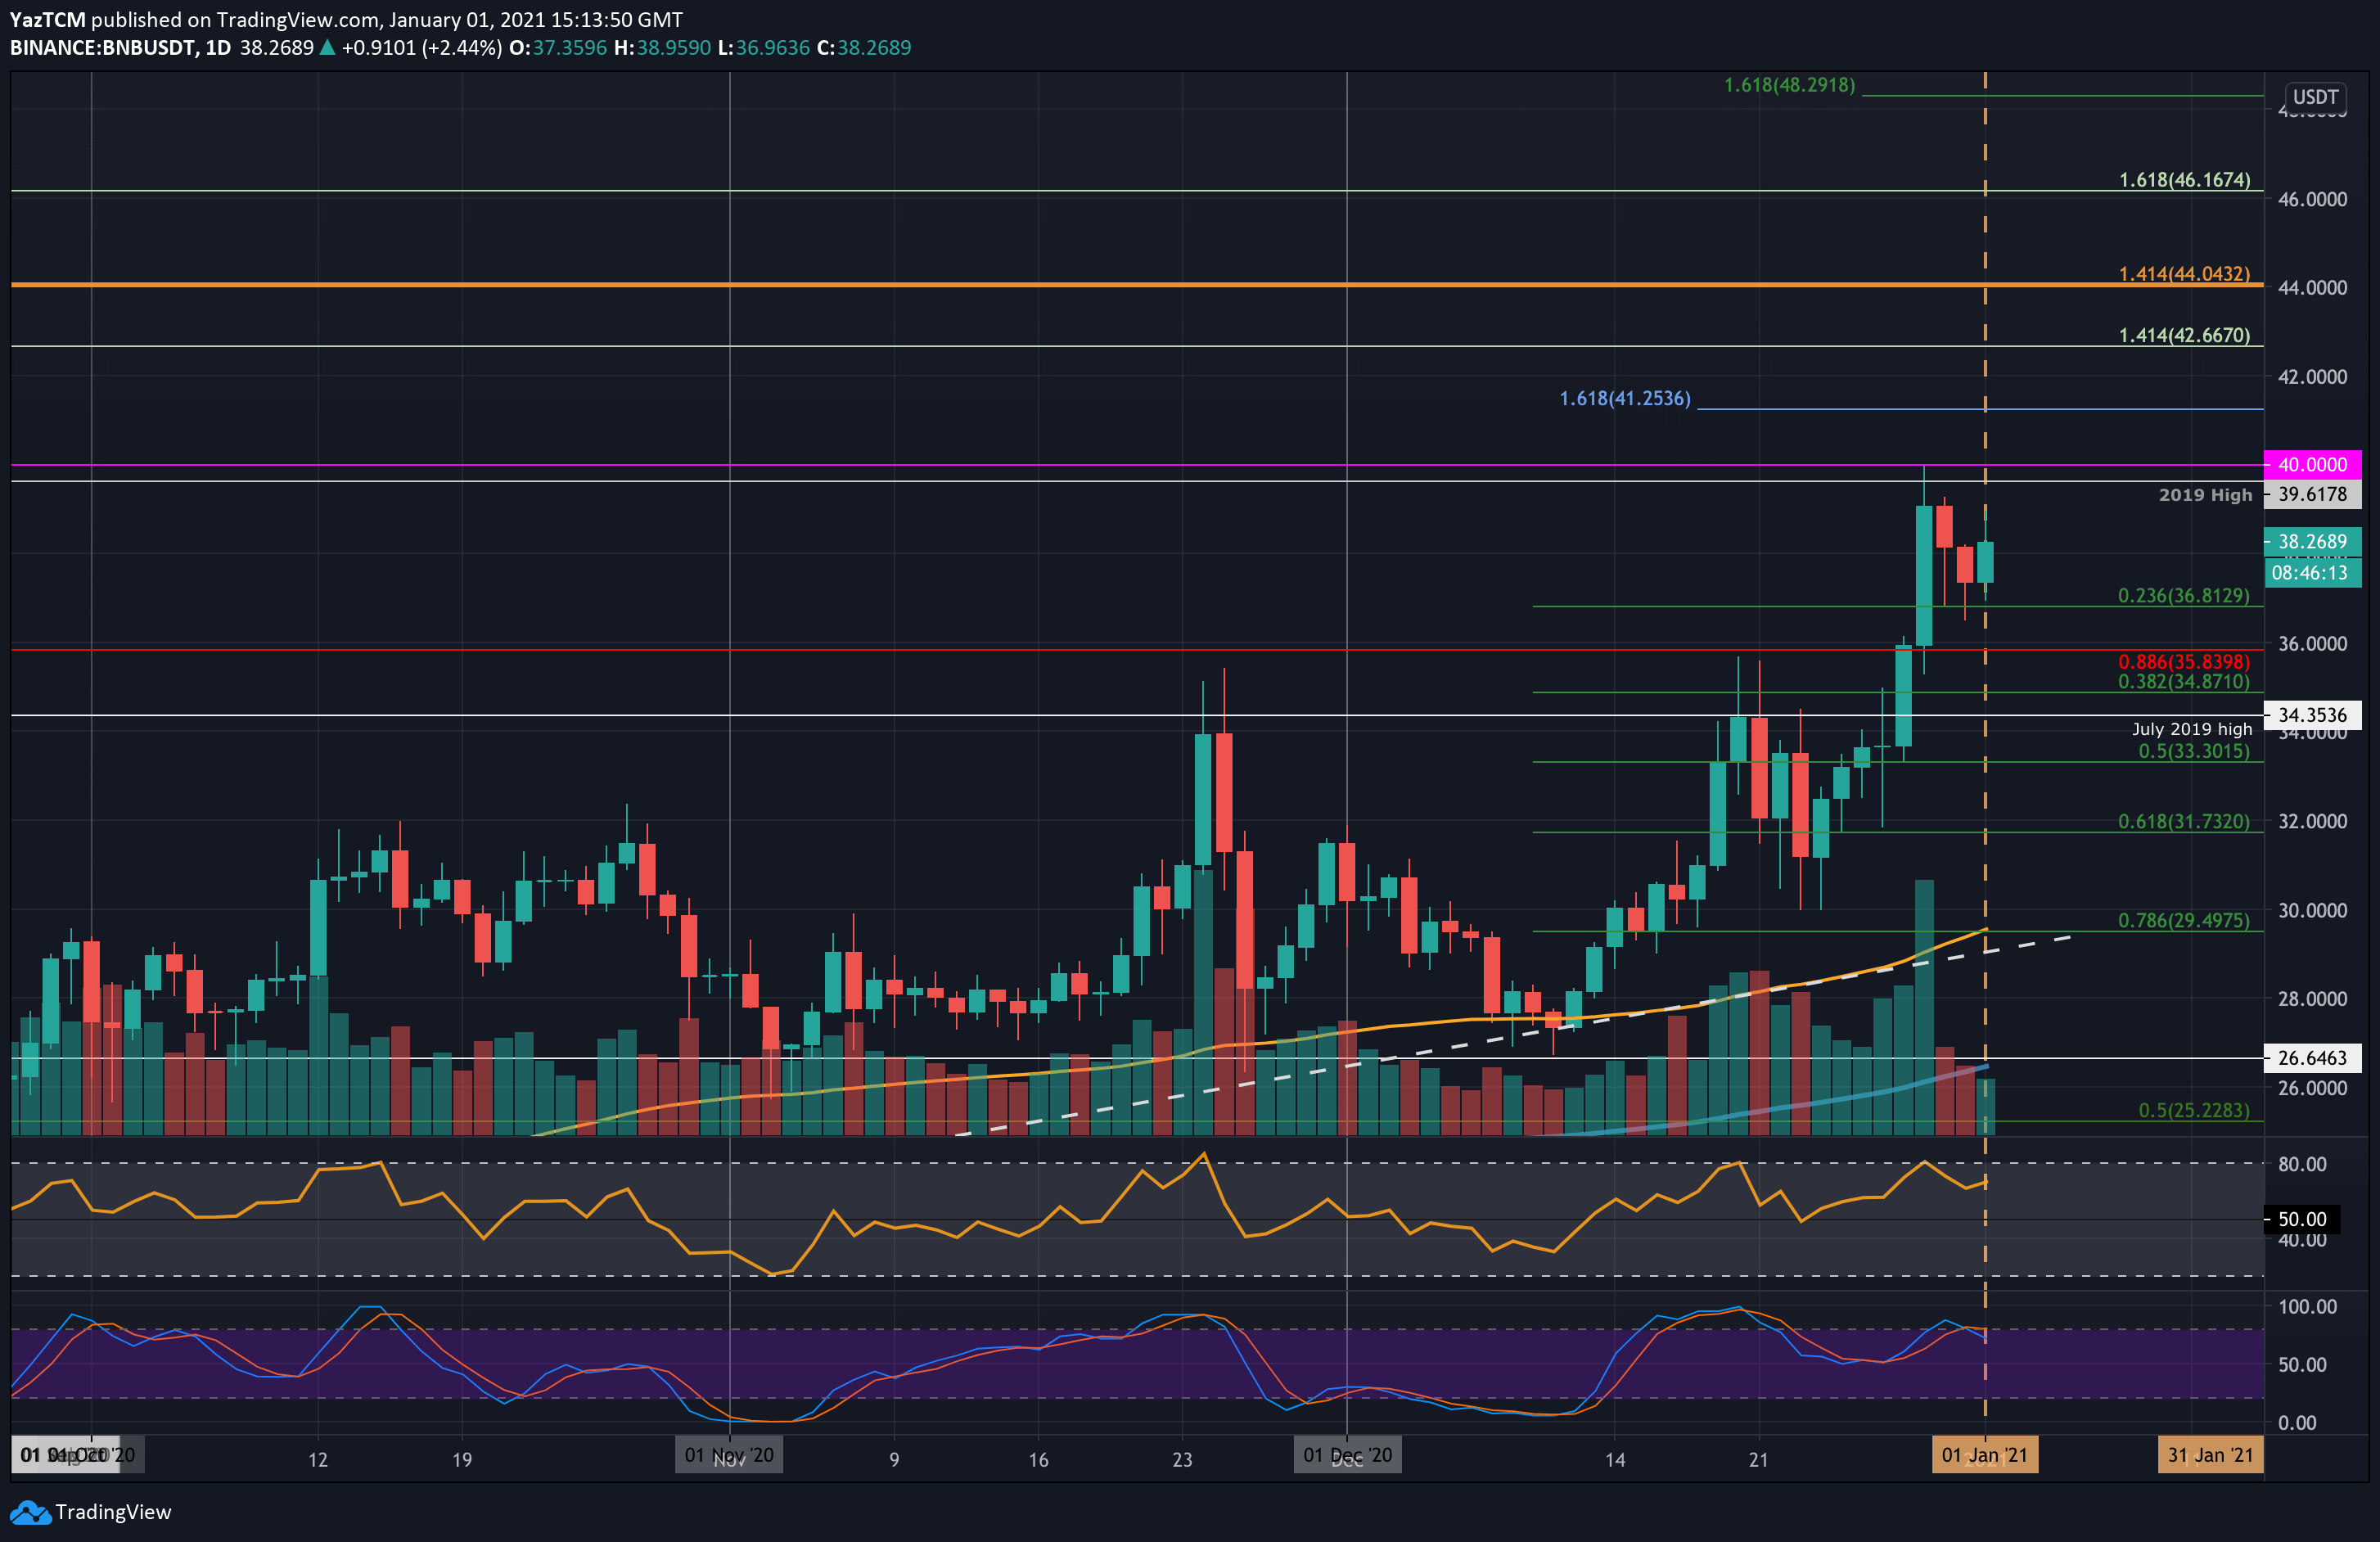
Binance Coin saw a good 15% price hike this week as the coin now trades at $38.26. The coin was trading at $32 last Friday as it started to push higher. On Monday, it reached the resistance at $35.83 (bearish .886 Fib Retracement).
This resistance was penetrated on Tuesday as BNB surged higher above the 2019 high at $39.61 to set a new ATH at $40. Unfortunately, the buyers could not continue further above $40, which resulted in BNB dropping into the $36.81 support (.236 Fib) yesterday. It has since bounced higher to trade at $38.26.
Looking ahead, if the bulls push higher, the first two levels of resistance are expected at $39.61 and $40. Beyond $40, resistance is located at $41.25, $42.66, and $44. This is followed by $45, $46.16, and $48.30.
On the other side, the first level of support lies at $36.81 (.236 Fib). This is followed by $35.83, $34.87, $34.45 (.July 2019 High), and $33.30 (.5 Fib).
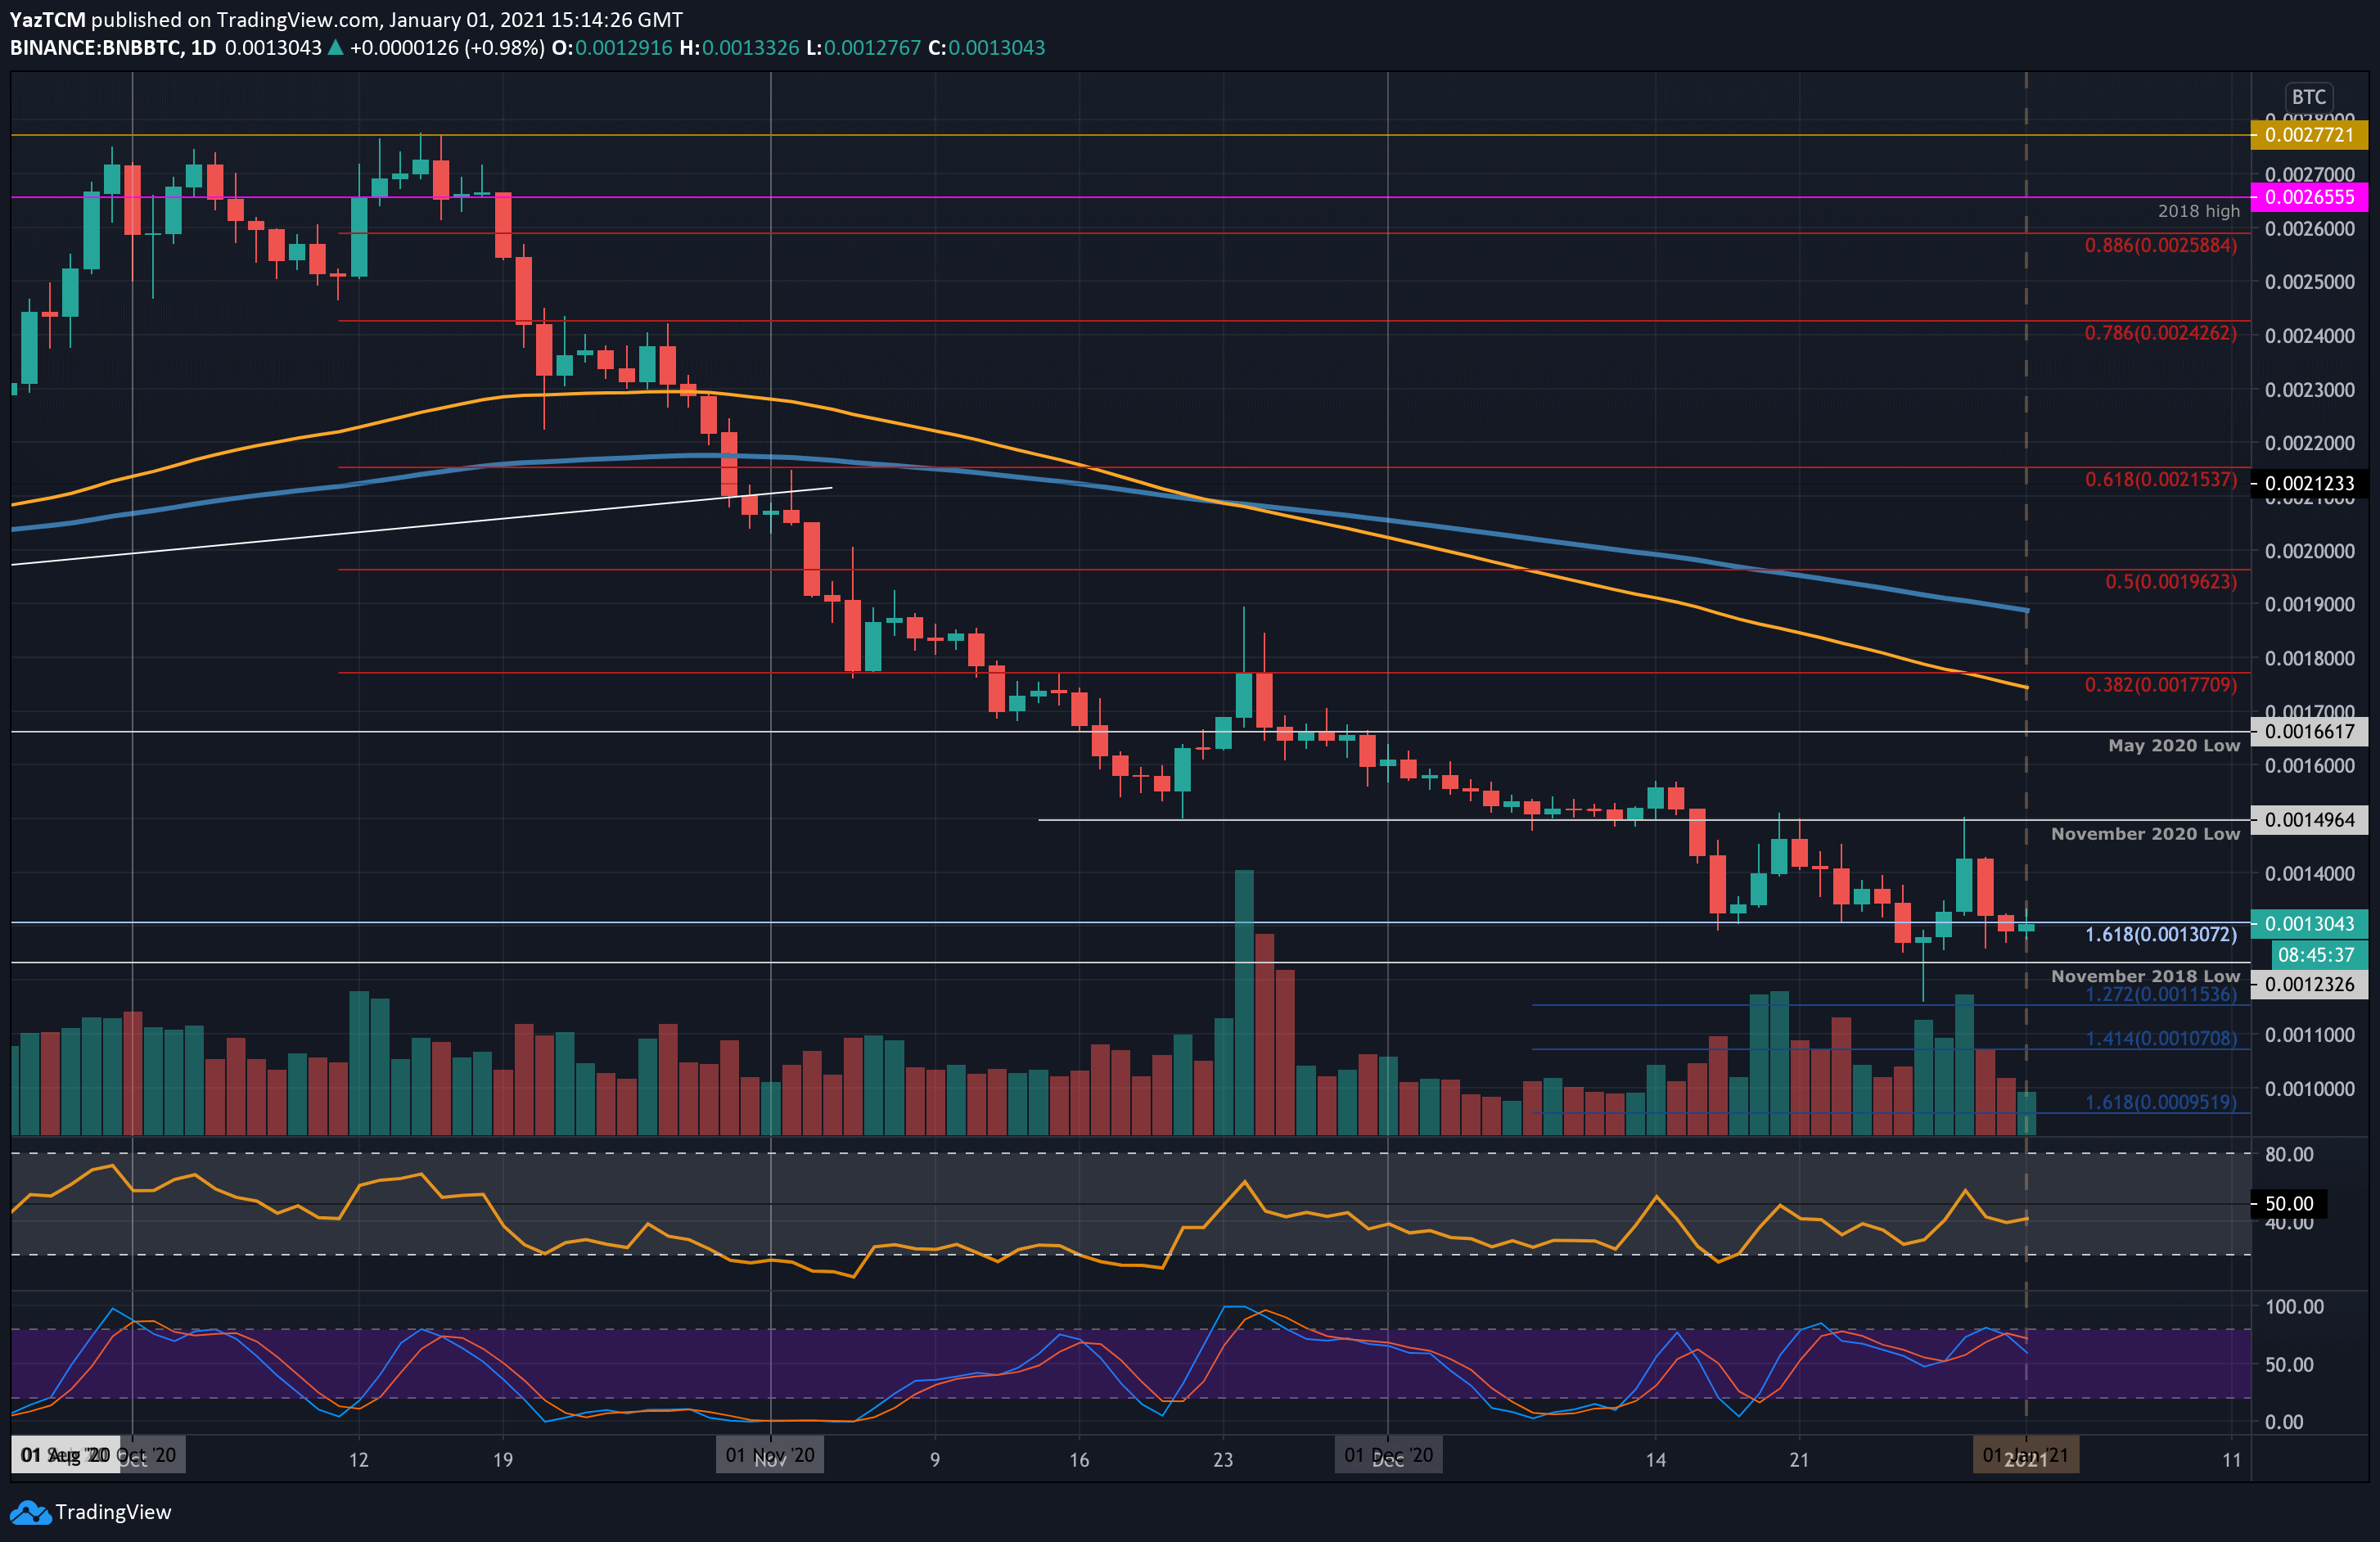
Against Bitcoin, BNB pretty much moved sideways this week. The coin spiked as low as 0.00115 BTC on Monday, but the buyers quickly regrouped to bring it back above 0.012 BTC. By Wednesday, BNB had climbed back into the November 2020 lows at 0.00149 BTC.
Unfortunately, the buyers could not overcome this resistance as BNB headed lower to trade at 0.0013 BTC today.
Moving forward, if the buyers push higher again, the first level of resistance lies at 0.0014 BTC. This is followed by 0.00149 BTC (November 2020 low), 0.0016 BTC, and 0.00166 BTC (May 2020 Low).
On the other side, beneath 0.0013 BTC, support lies at 0.00123 BTC (Nov 2018 low), 0.00115 BTC (downside 1.272 Fib Extension), 0.0011 BTC, and 0.00107 BTC.
Polkadot
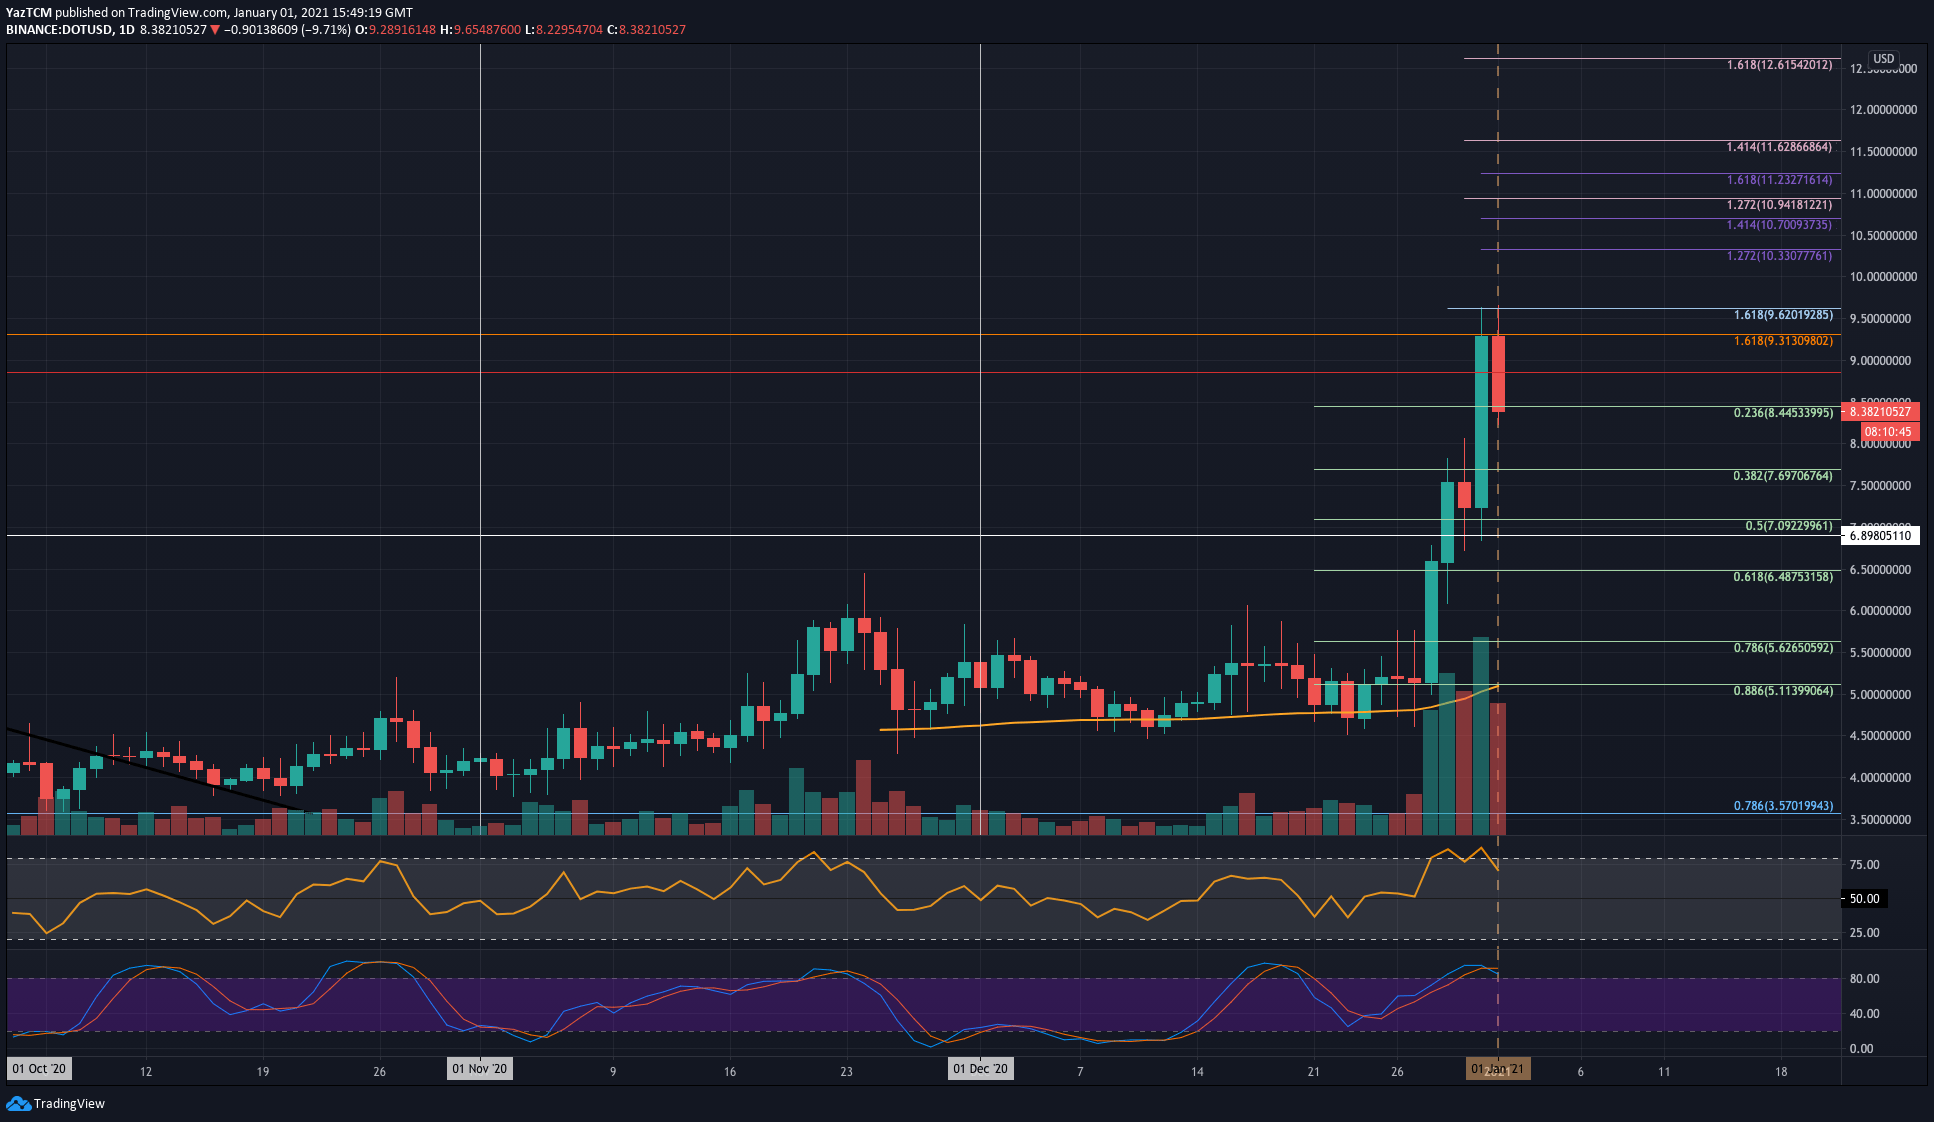
DOT saw an epic 68.5% price surge this week as the coin trades at $8.38 today. It was trading around $5.00 last Friday and continued to trade at this level until it started to surge on Monday to reach $6.50.
The buyers did not stop there. They continued to break beyond $8.50 and managed to reach as high as $9.62 yesterday. More specifically, they could not close a daily candle above $9.31, which resulted in DOT rolling over to break beneath the $8.44 support today.
Looking ahead, if the bulls can regroup and push higher again, the first level of resistance lies aT $9.00. This is followed by resistance at $9.31, $9.62, and $10.00. Added resistance lies at $10.33 (1.272 Fib Extension), $10.70 (1.414 Fib Extension), and $11.23.
On the other side, the first level of support lies at $8.00. This is followed by $7.70 (.382 Fib), $7.10 (.5 Fib), and $6.90. Added support lies at $6.50 (.618 Fib).
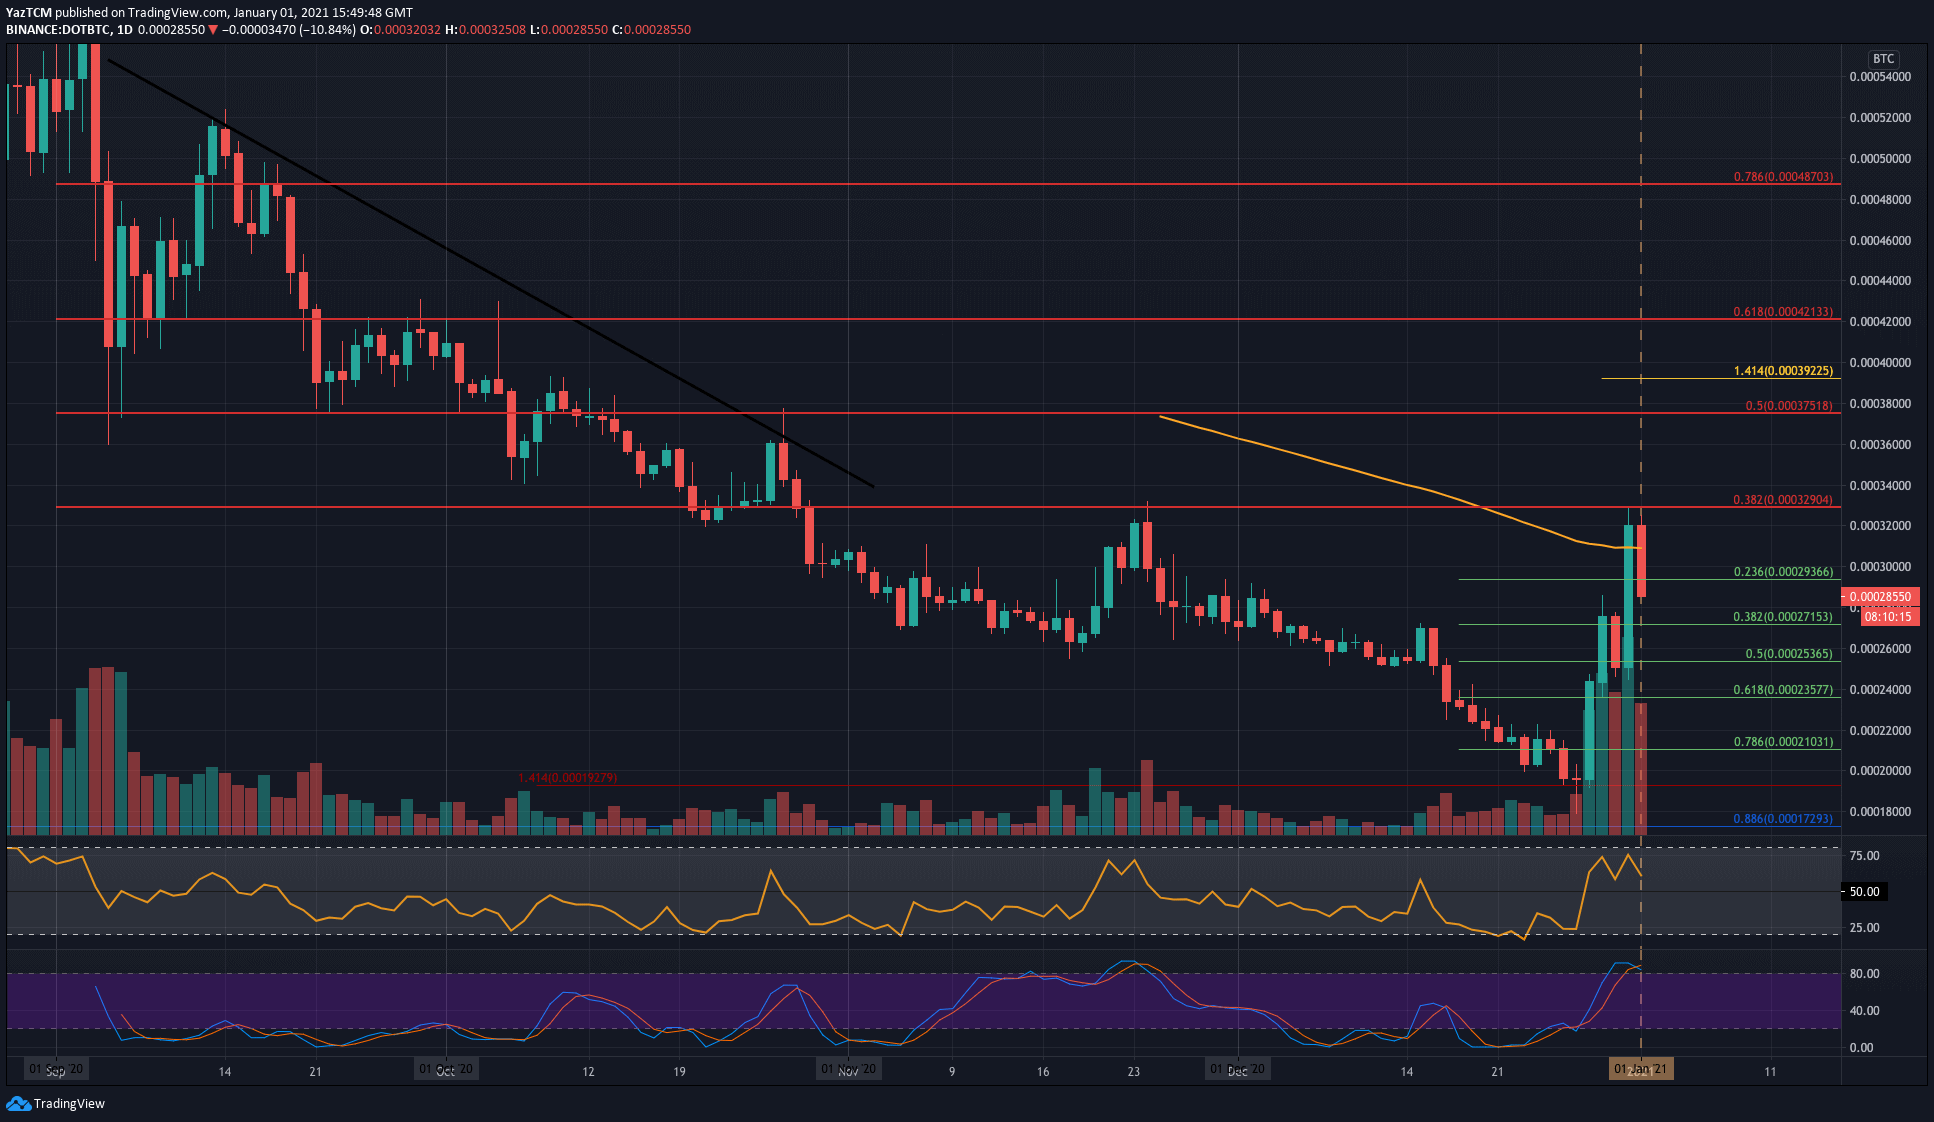
Against Bitcoin, DOT was trading beneath 0.0002 BTC over the weekend. It started to push higher as the week started as it managed to reach as high as 0.000329 BTC (bearish .382 Fib Retracement) yesterday.
DOT has since dropped lower to break back beneath 0.0003 BTC and trade at 0.000285 BTC.
Looking ahead, if the sellers continue to drive DOT lower, the first level of support lies at 0.000271 BTC (.382 Fib). This is followed by 0.000253 BTC, 0.000235 BTC (.618 Fib), and 0.00022 BTC.
On the other side, resistance first lies at 0.0003 BTC. This is followed by 0.000329 BTC (bearish .382 Fib), 0.00034 BTC, and 0.00036 BTC. Added resistance is found at 0.000375 BTC (bearish .5 Fib Retracement).