BitcoinAfter a substantial 44% price surge this week, Bitcoin continued to set new ATH prices today at ,000. The cryptocurrency started the year off underneath the ,000 level after a strong performance in December 2020.From there, it broke ,000 last Saturday as it continued to push higher. On Monday, there was a brief spike lower toward ,000, but this was quickly bought up as traders closed that daily candle above ,000.Throughout the rest of the week, BTC continued to set new ATHs each day until reaching the resistance today at ,000. More specifically, the resistance lies at ,835 – provided by a 1.414 Fib Extension level.Looking ahead, if the bulls continue above ,000, resistance lies at ,445 (1.272 Fib Extension – yellow), ,000, ,340 (1.618 Fib Extension –
Topics:
Yaz Sheikh considers the following as important: Bitcoin (BTC) Price, BTC Analysis, BTCEUR, BTCGBP, btcusd, btcusdt, Chainlink (LINK) Price, ETH Analysis, ETHBTC, Ethereum (ETH) Price, ethusd, LINKBTC, LINKUSD, Market Updates, Price Analysis, Ripple (XRP) Price, Stellar (XLM) Price, XLMBTC, XLMUSD, XRP Analysis, xrpbtc, xrpusd
This could be interesting, too:
Chayanika Deka writes XRP, SOL, and ADA Inclusion in US Crypto Reserve Pushes Traders on Edge
Chayanika Deka writes Why Arthur Hayes Is Bullish on Bitcoin Under Trump’s Economic Strategy
Mandy Williams writes Why the Bitcoin Market Is Stuck—and the Key Metric That Could Change It: CryptoQuant CEO
Wayne Jones writes Metaplanet Acquires 156 BTC, Bringing Total Holdings to 2,391
Bitcoin
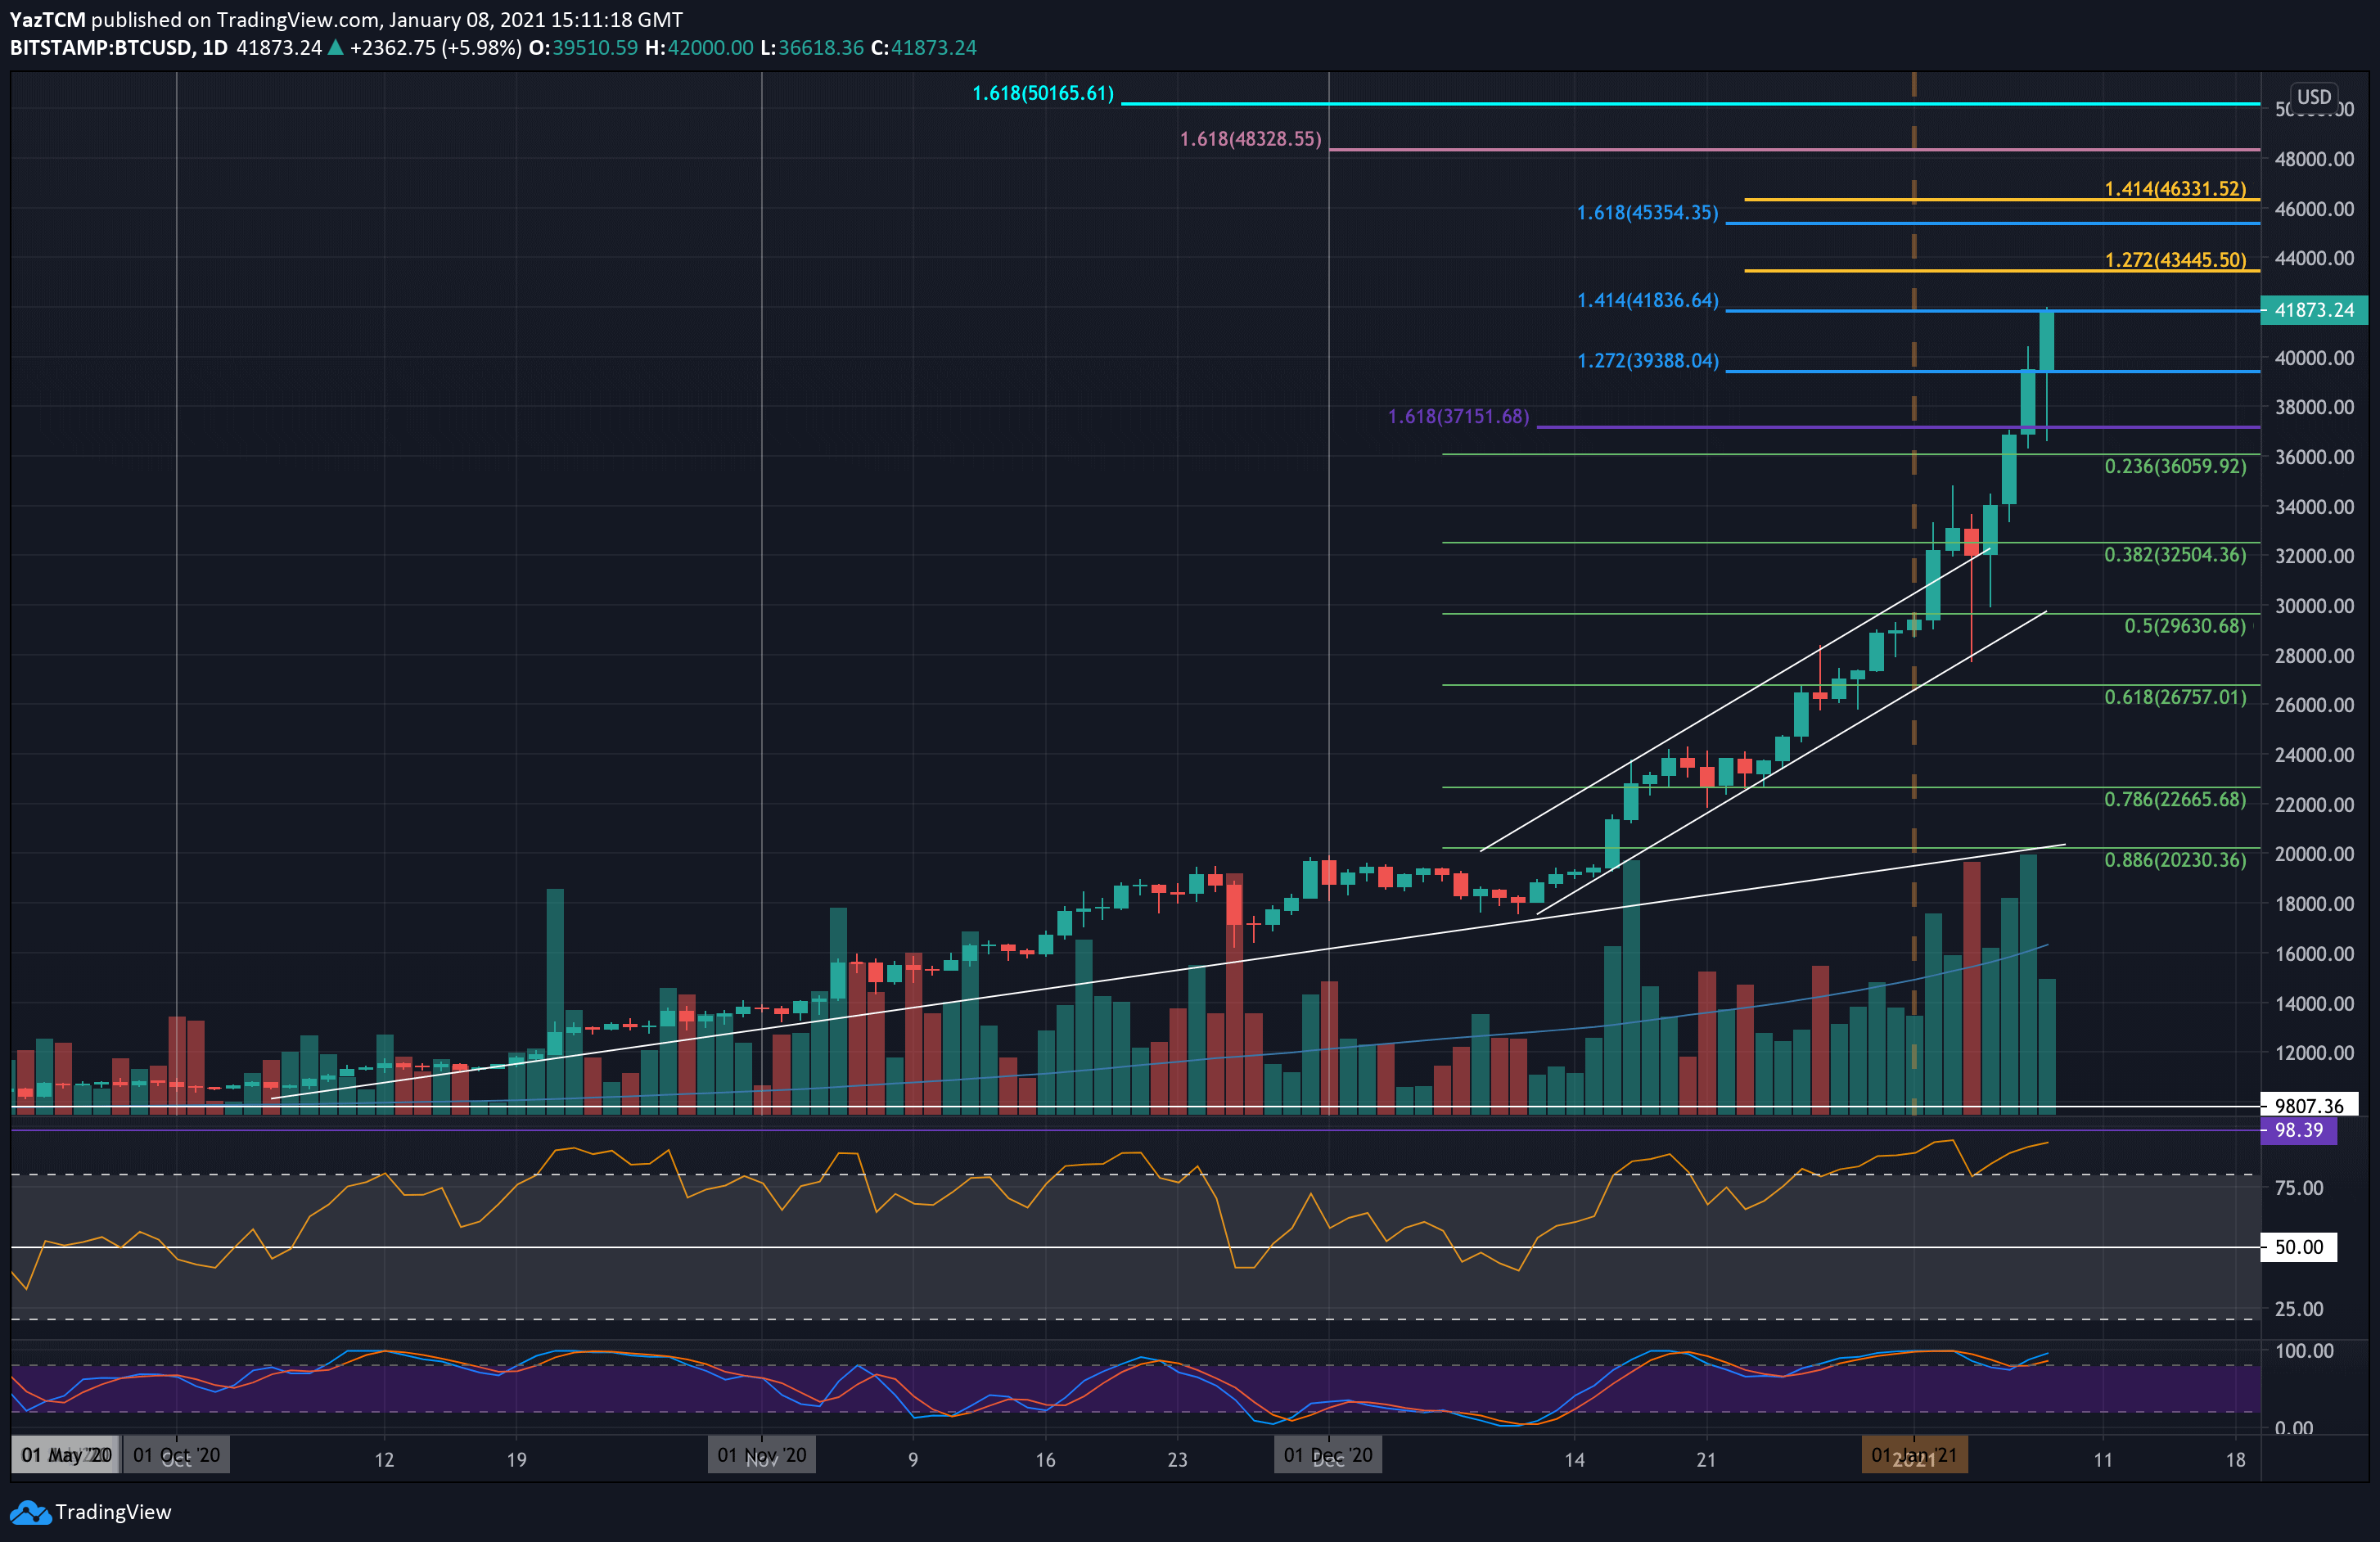
After a substantial 44% price surge this week, Bitcoin continued to set new ATH prices today at $42,000. The cryptocurrency started the year off underneath the $30,000 level after a strong performance in December 2020.
From there, it broke $30,000 last Saturday as it continued to push higher. On Monday, there was a brief spike lower toward $28,000, but this was quickly bought up as traders closed that daily candle above $32,000.
Throughout the rest of the week, BTC continued to set new ATHs each day until reaching the resistance today at $42,000. More specifically, the resistance lies at $41,835 – provided by a 1.414 Fib Extension level.
Looking ahead, if the bulls continue above $42,000, resistance lies at $43,445 (1.272 Fib Extension – yellow), $45,000, $45,340 (1.618 Fib Extension – blue), $46,330 (1.414 Fib Extension – yellow), and $48,000.
Beyond $48,000, additional resistance lies at $48,330, $49,000, and $50,000.
On the other side, the first level of support lies at $40,000. This is followed by support at $38,000, $37,150, $36,000 (.236 Fib), and $34,000. Added support is found at $32,500 (.382 Fib), $30,000, and $29,630 (.5 Fib).
Ethereum
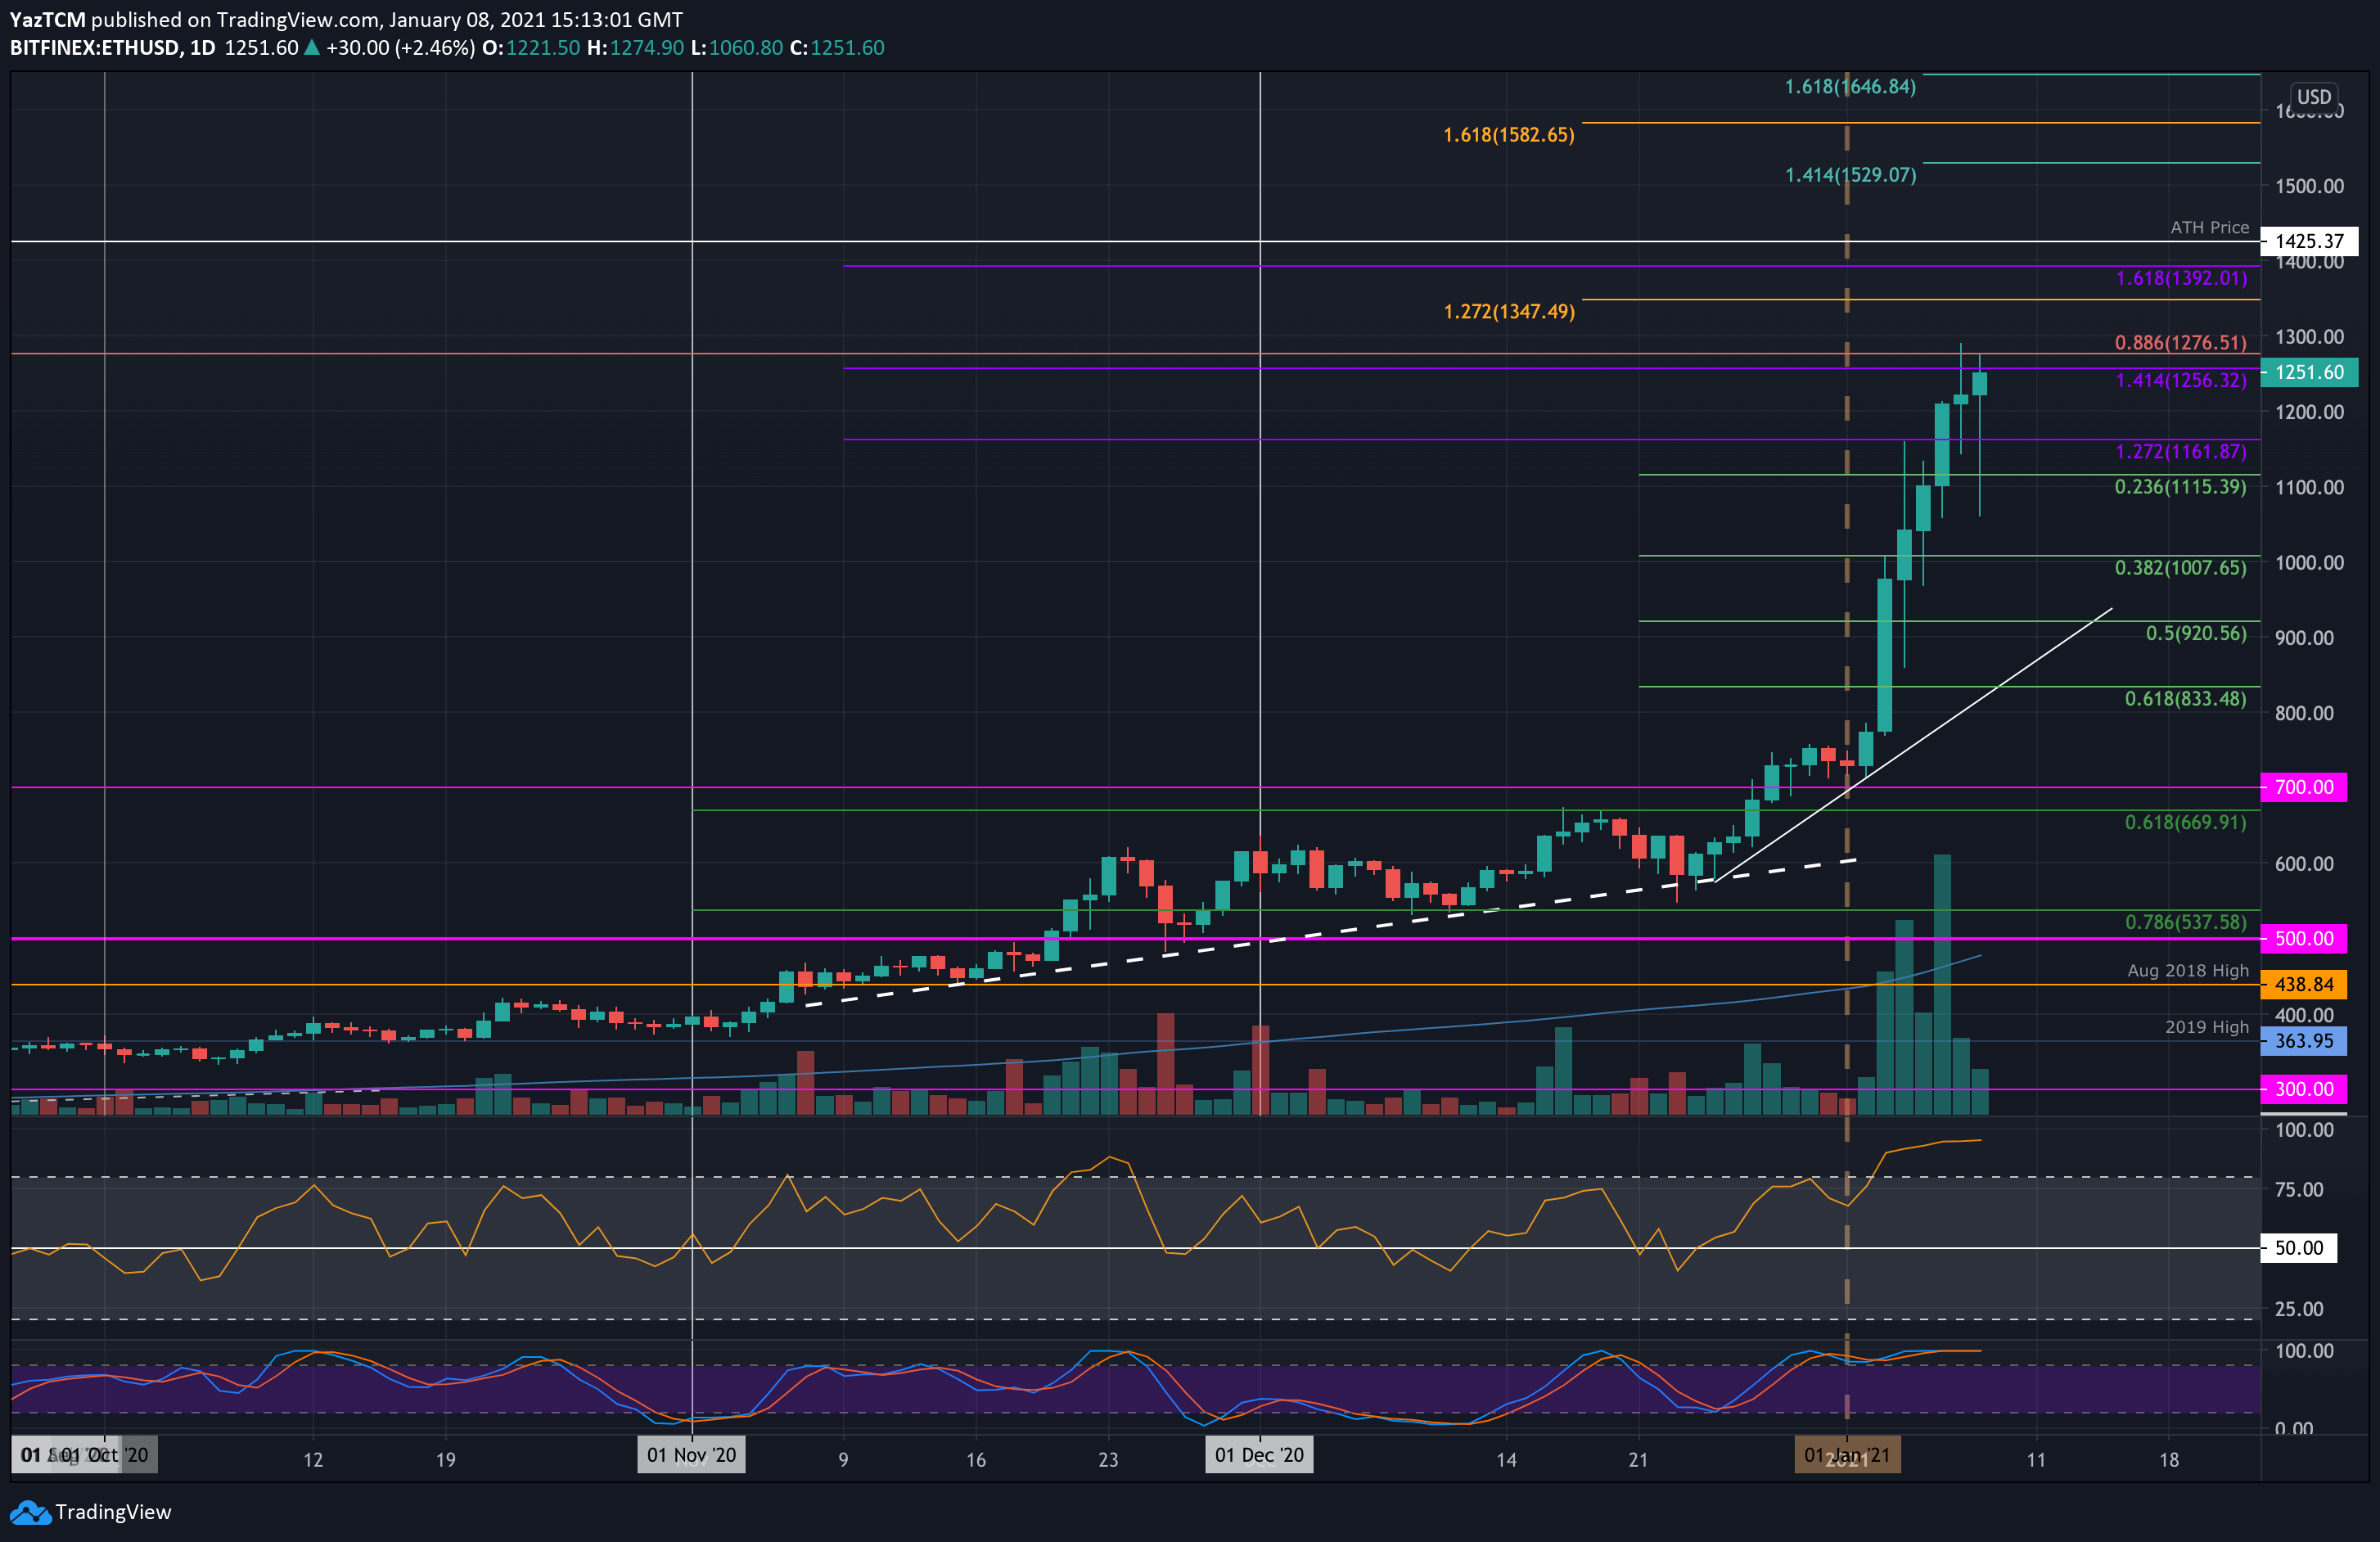
Ethereum saw a strong 67% price surge this week as the cryptocurrency currently trades at the $1250 level. The coin started the week off beneath the $800 level as it started to push higher. It continued to drive upward throughout the entire week until reaching resistance at $1276 yesterday – provided by a bearish .886 Fib Retracement.
Today, ETH is struggling to break resistance at $1255 (1.414 Fib Extension). However, with the bullish momentum within the market, this is more than likely to be penetrated pretty soon.
Looking ahead, the first two levels of resistance lie at $1255 (1.414 Fib Extension) and $1275 (bearish .886 Fib Retracement). Beyond $1300, resistance lies at $1350 (1.272 Fib Extension), $1392 (1.618 Fib Extension – purple), and $1425 (ATH Price).
Above the last ATH, resistance is found at $1530 (short term 1.414 Fib Extension), $1582 (1.618 Fib Extension – yellow), and $1646.
On the other side, support is first found at $1200. This is followed by $1160, $1115 (.236 Fib), $1050, and $1000 (.382 Fib). Added support lies at $920 (.5 Fib), and 833 (.618 Fib).
Against Bitcoin, Ethereum exploded higher this week after it rebounded from the weekly low at 0.024 BTC. On Sunday, it managed to penetrate above the 200-days EMA at 0.029 BTC as it continued higher.
Over the following few days, ETH continued to drive upward but got stuck at the 0.033 BTC resistance, which is the November 2020 High-day closing price. It did spike above this level, reaching near 0.035 BTC, but could never close a daily candle above the 0.033 BTC level.
It has since spiked as low as 0.0289 BTC (.5 Fib) today and is now trading just above 0.03 BTC.
Looking ahead, if the bears continue to push ETH lower, the first level of support lies at 0.0298 BTC (.5 Fib). This is followed by 0.0284 BTC (Feb 2020 highs), 0.028 BTC, 0.0275 BTC (.618 Fib), and 0.027 BTC.
On the other side, the first level of resistance lies at 0.031 BTC. This is followed by 0.0318 BTC (Dec 2020 highs), 0.032 BTC, and 0.033 BTC.

Ripple
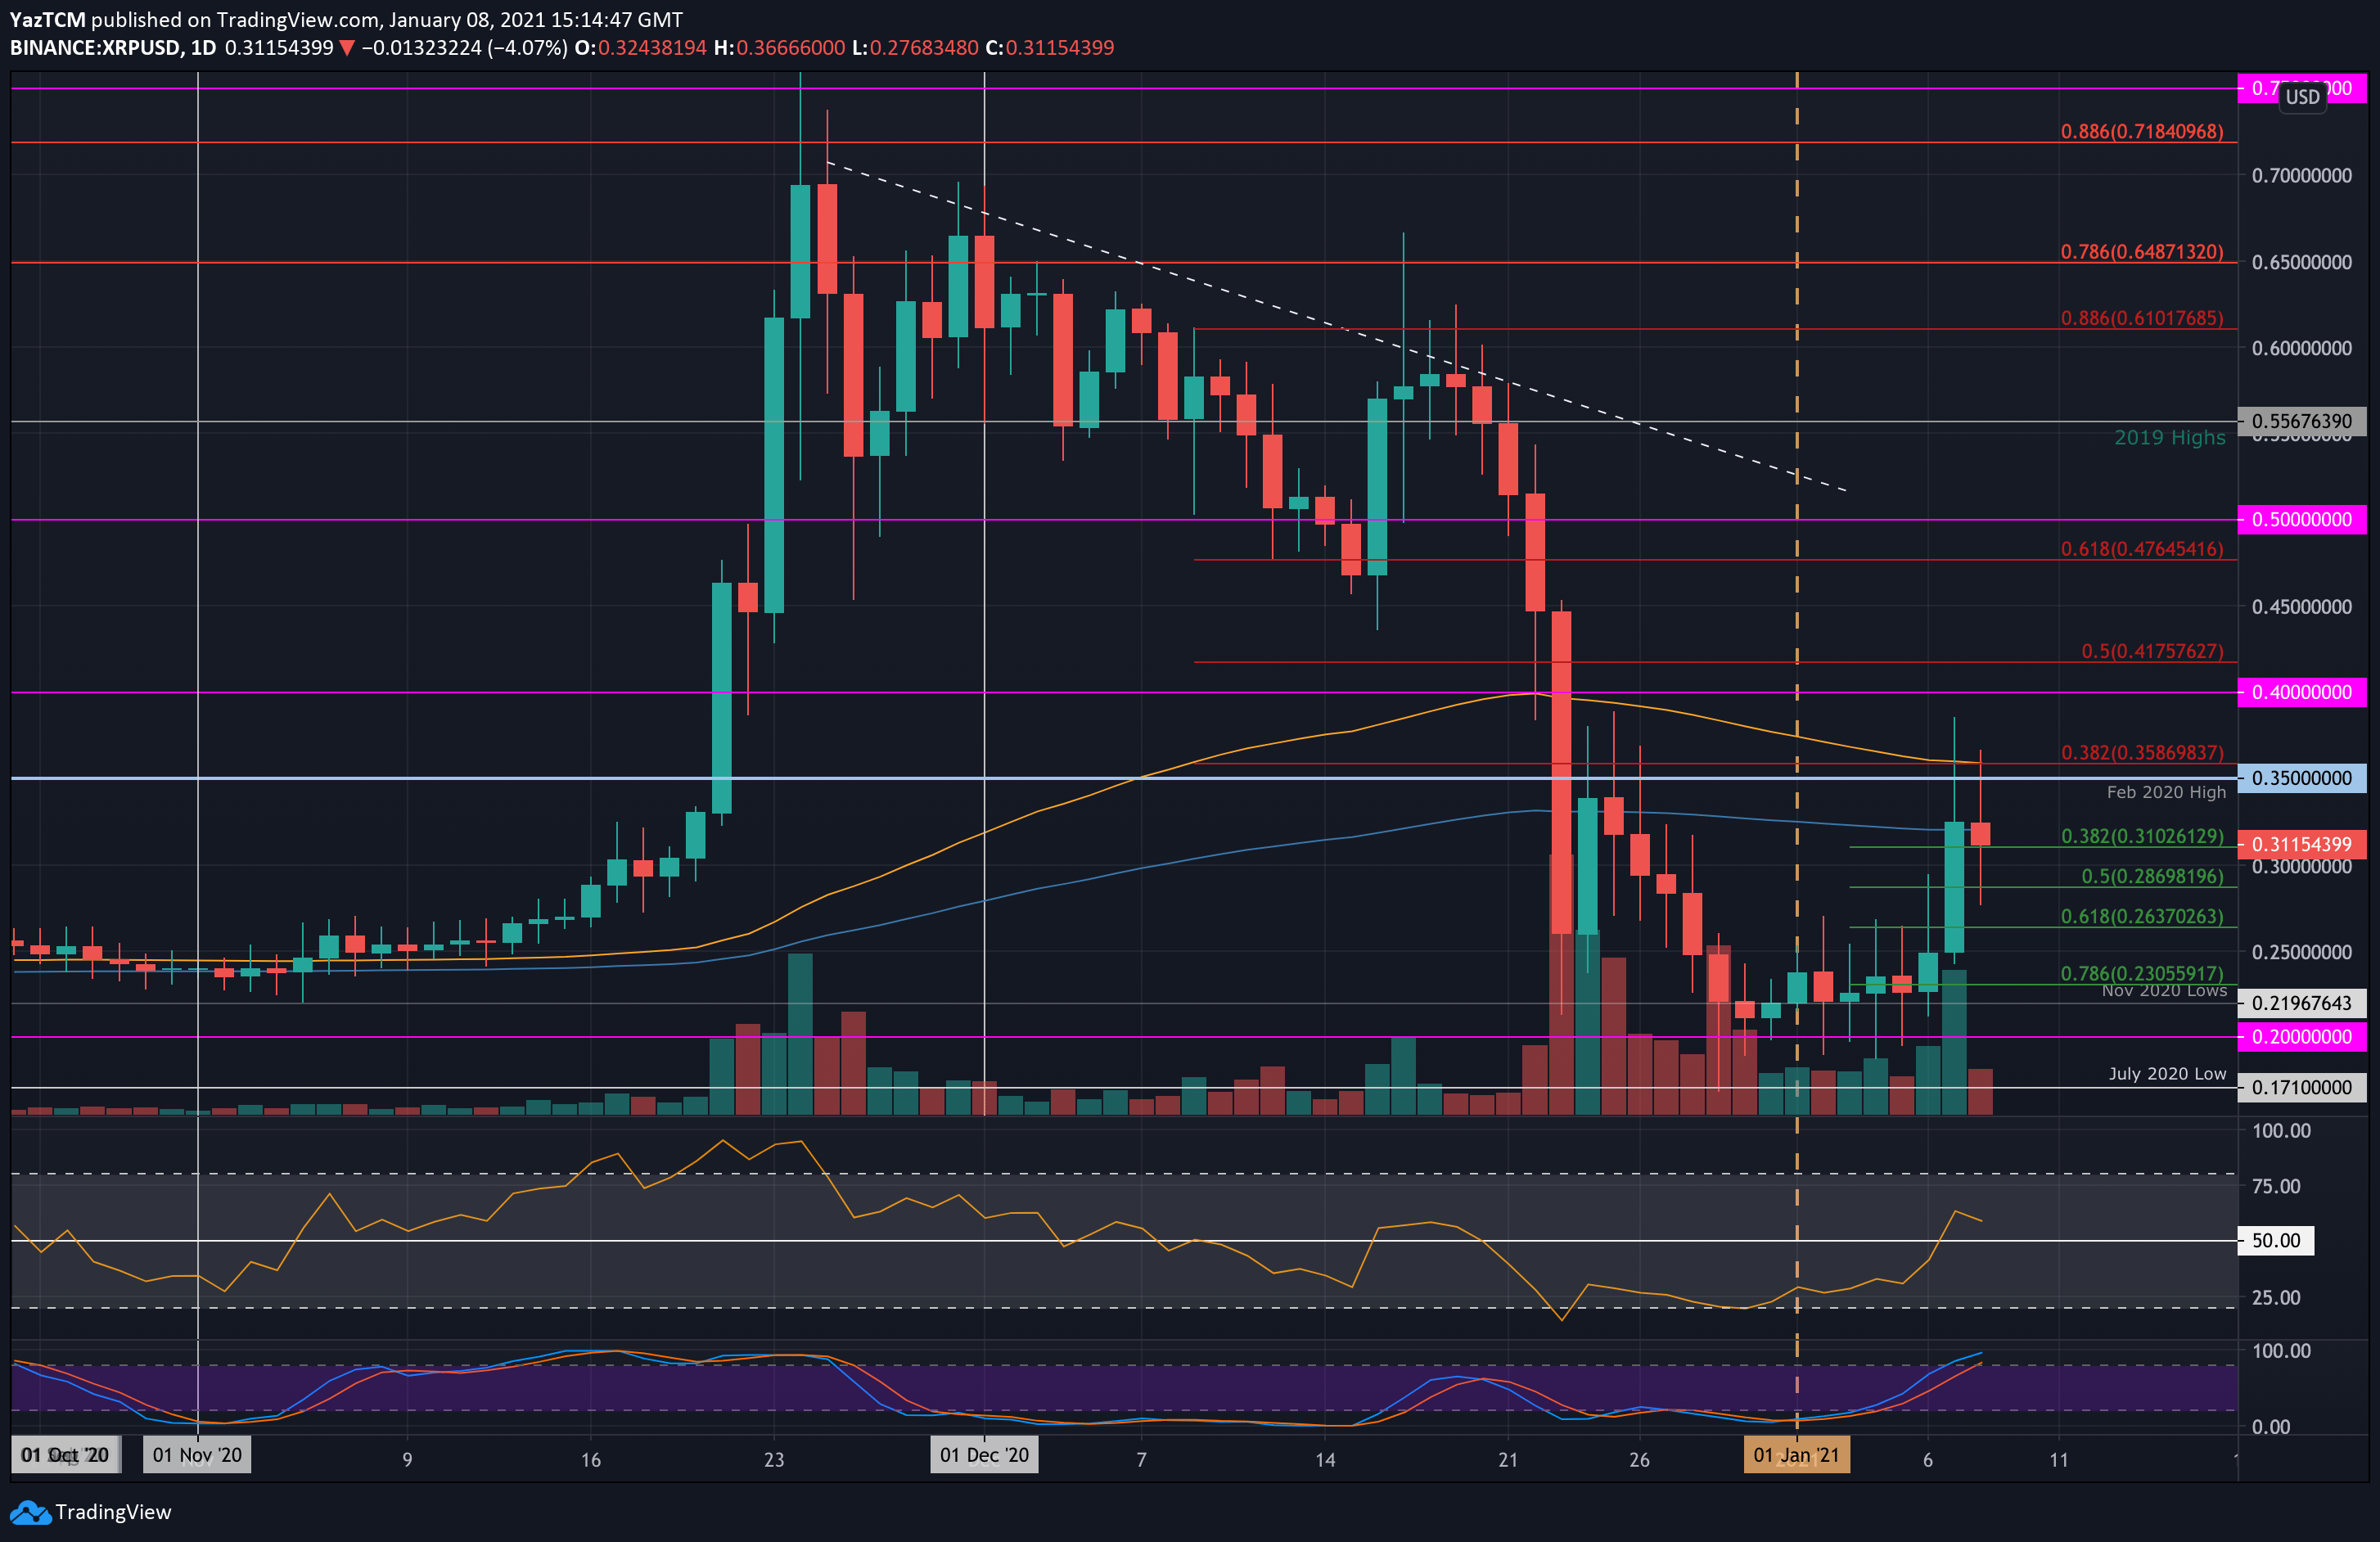
XRP is up by a strong 41.5% this week as it started to attempt a recovery from the disastrous 75% price plummets seen in December. Throughout the first few days of January, XRP was doing well to hold above the November 2020 lows at $0.2.
It started to push higher from here on Wednesday as it closed at $0.25. Yesterday, the bullish surge continued higher, allowing XRP to spike as high as $0.38. It has since dropped back beneath $0.35 to trade at $0.311 (.382 Fib).
Moving forward, if the bulls can hold the support at $0.31, the first level of resistance lies at $0.35 (Feb 2020 highs). This is followed by $0.358 (bearish .382 Fib & 100-day EMA), $0.4, $0.4175 (bearish .5 Fib), and $0.45.
On the other side, if the bears break $0.31 (.382 Fib), added support lies at $0.3, $0.286 (.5 Fib), $0.263 (.618 Fib), and $0.25.
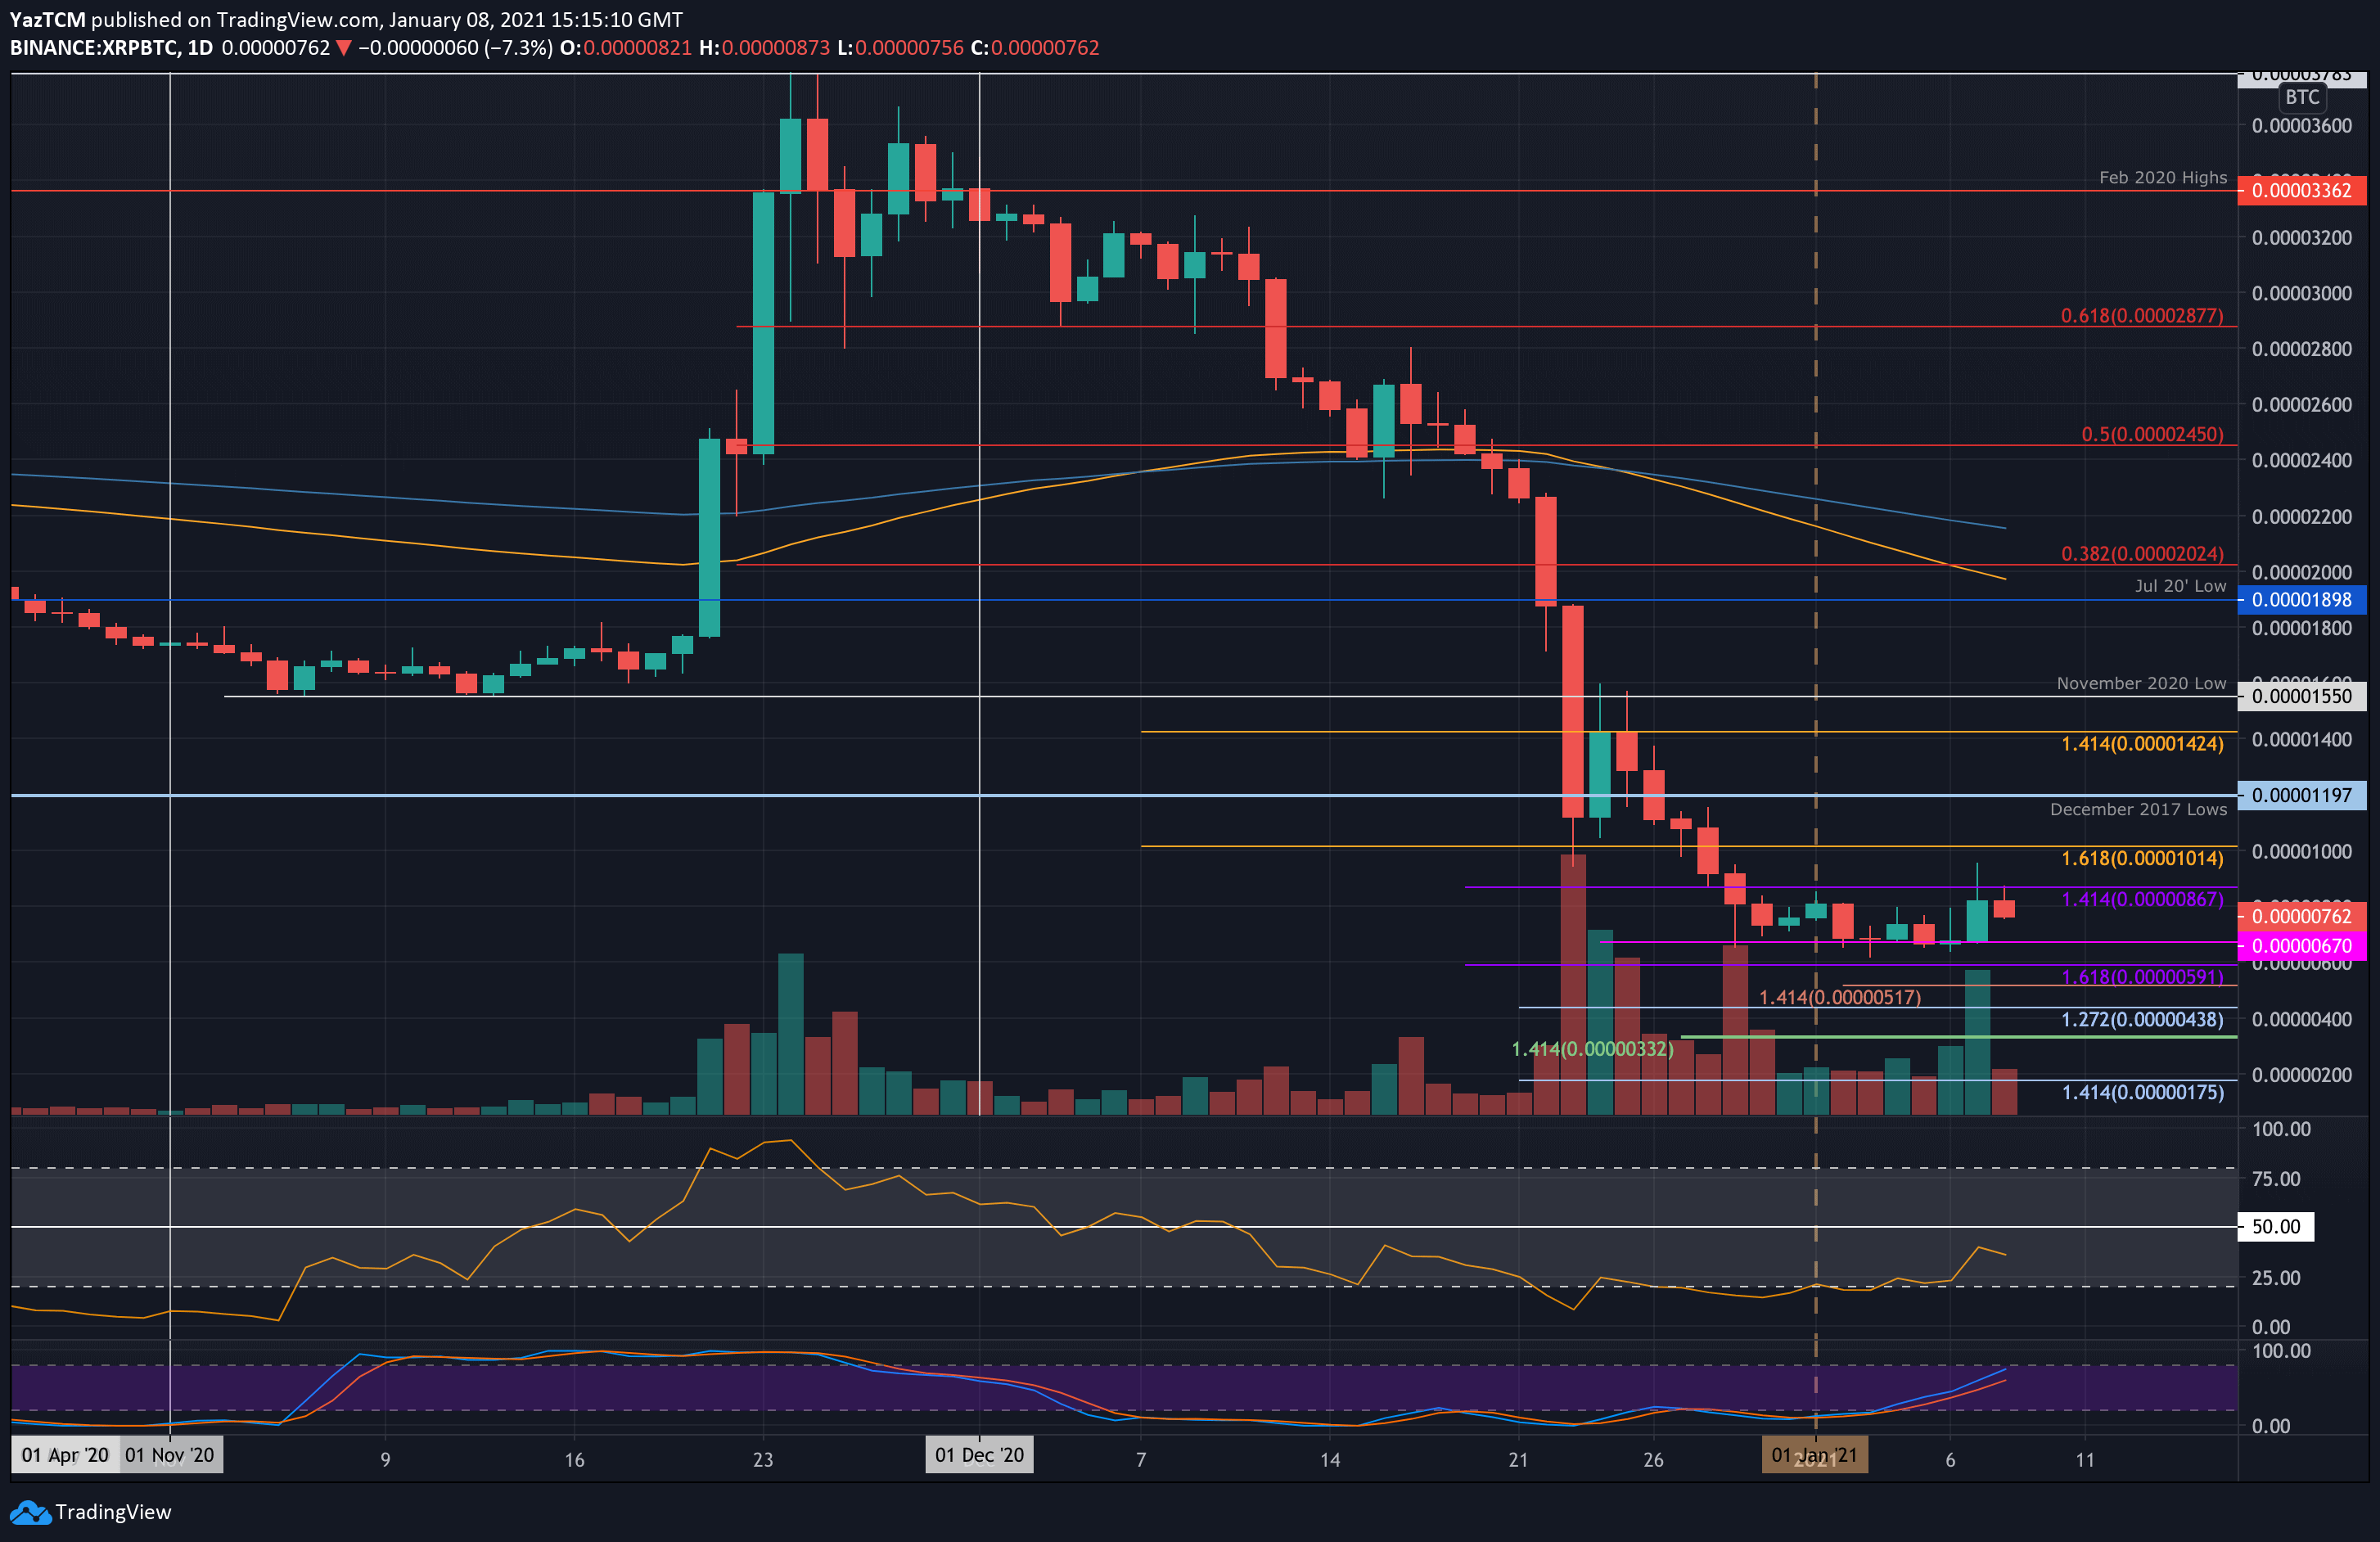
XRP also started to stabilize against Bitcoin this week. It started the year off by dropping lower into 670 SAT, but it established a solid base of support there throughout the week. Yesterday, XR O pushed higher from here and reached near the 900 SAT level. Unfortunately, it could only close marginally above 800 SAT and has since dropped to 762 SAT today.
Moving forward, if the sellers push lower, the first level of support lies at 670 SAT. This is followed by 600 SAT, 590 SAT, 520 SAT, and 440 SAT. Added support lies at 332 SAT.
On the other side, the first level of resistance lies at 900 SAT. This is followed by 1000 SAT, 1200 SAT (Dec 2017 Lows), and 1550 SAT (Nov 2020 Lows).
Stellar Lumens
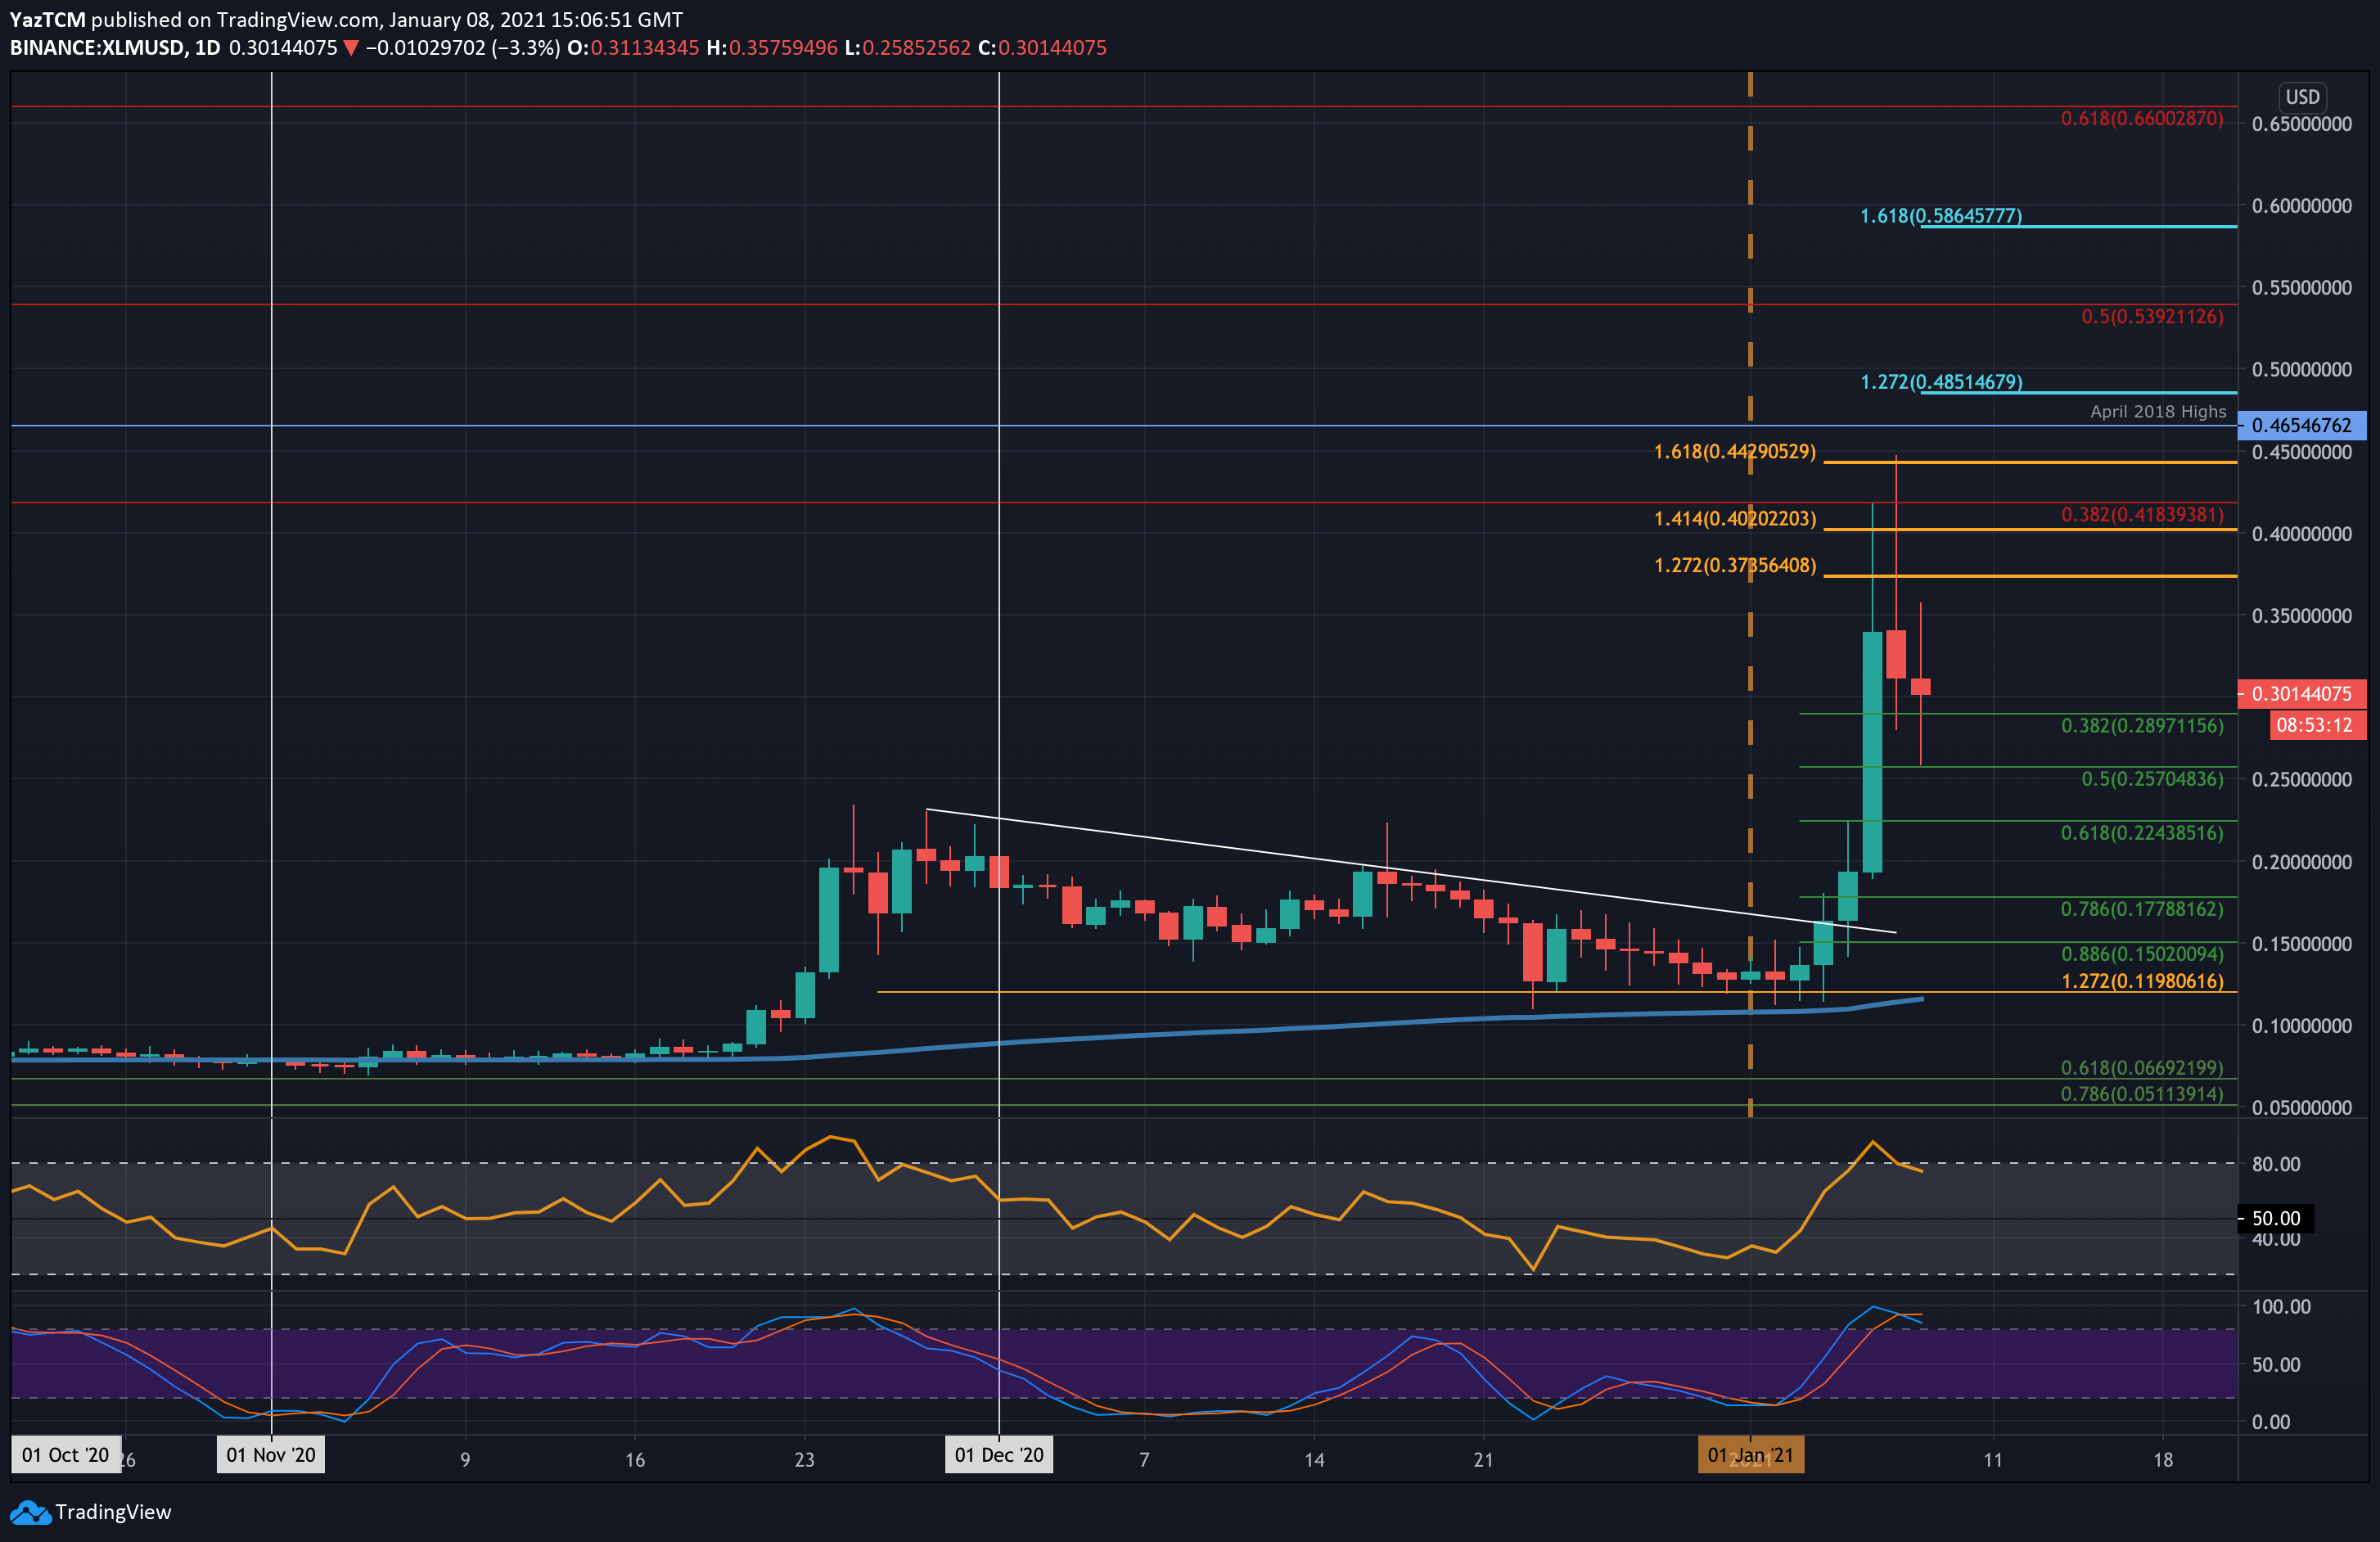
XLM saw an incredible 130% price explosion this week as it currently trades around $0.3. The cryptocurrency was holding support at $0.12 for the first few days of the week but eventually broke above $0.15 on Monday.
On Tuesday, XLM penetrated above a short term trend line and started to rocket higher. It exploded on Wednesday with a 100% price surge, allowing the coin to reach as high as $0.419 (bearish .382 Fib Retracement). Unfortunately, it dropped lower from here to close the daily candle around $0.34.
Yesterday, XLM spiked even higher to reach $0.45 but quickly dropped lower by the end of the day to close the daily candle around $0.31. Today, XLM fell into the support at $0.257 (.5 Fib Retracement) but has since bounced higher from here to trade above $0.3.
Moving forward, if the sellers push beneath $0.3, the first level of support lies at $0.29 (.382 Fib). This is followed by $0.257 (.5 Fib), $0.224 (.618 Fib), $0.2, and $0.177 (.786 Fib).
On the other side, the first level of resistance lies at $0.34. This is followed by $0.373 (1.272 Fib Extension), $0.40 (1.414 Fib Extension), $0.418 (bearish .382 Fib), and $0.442 (1.618 Fib Extension).
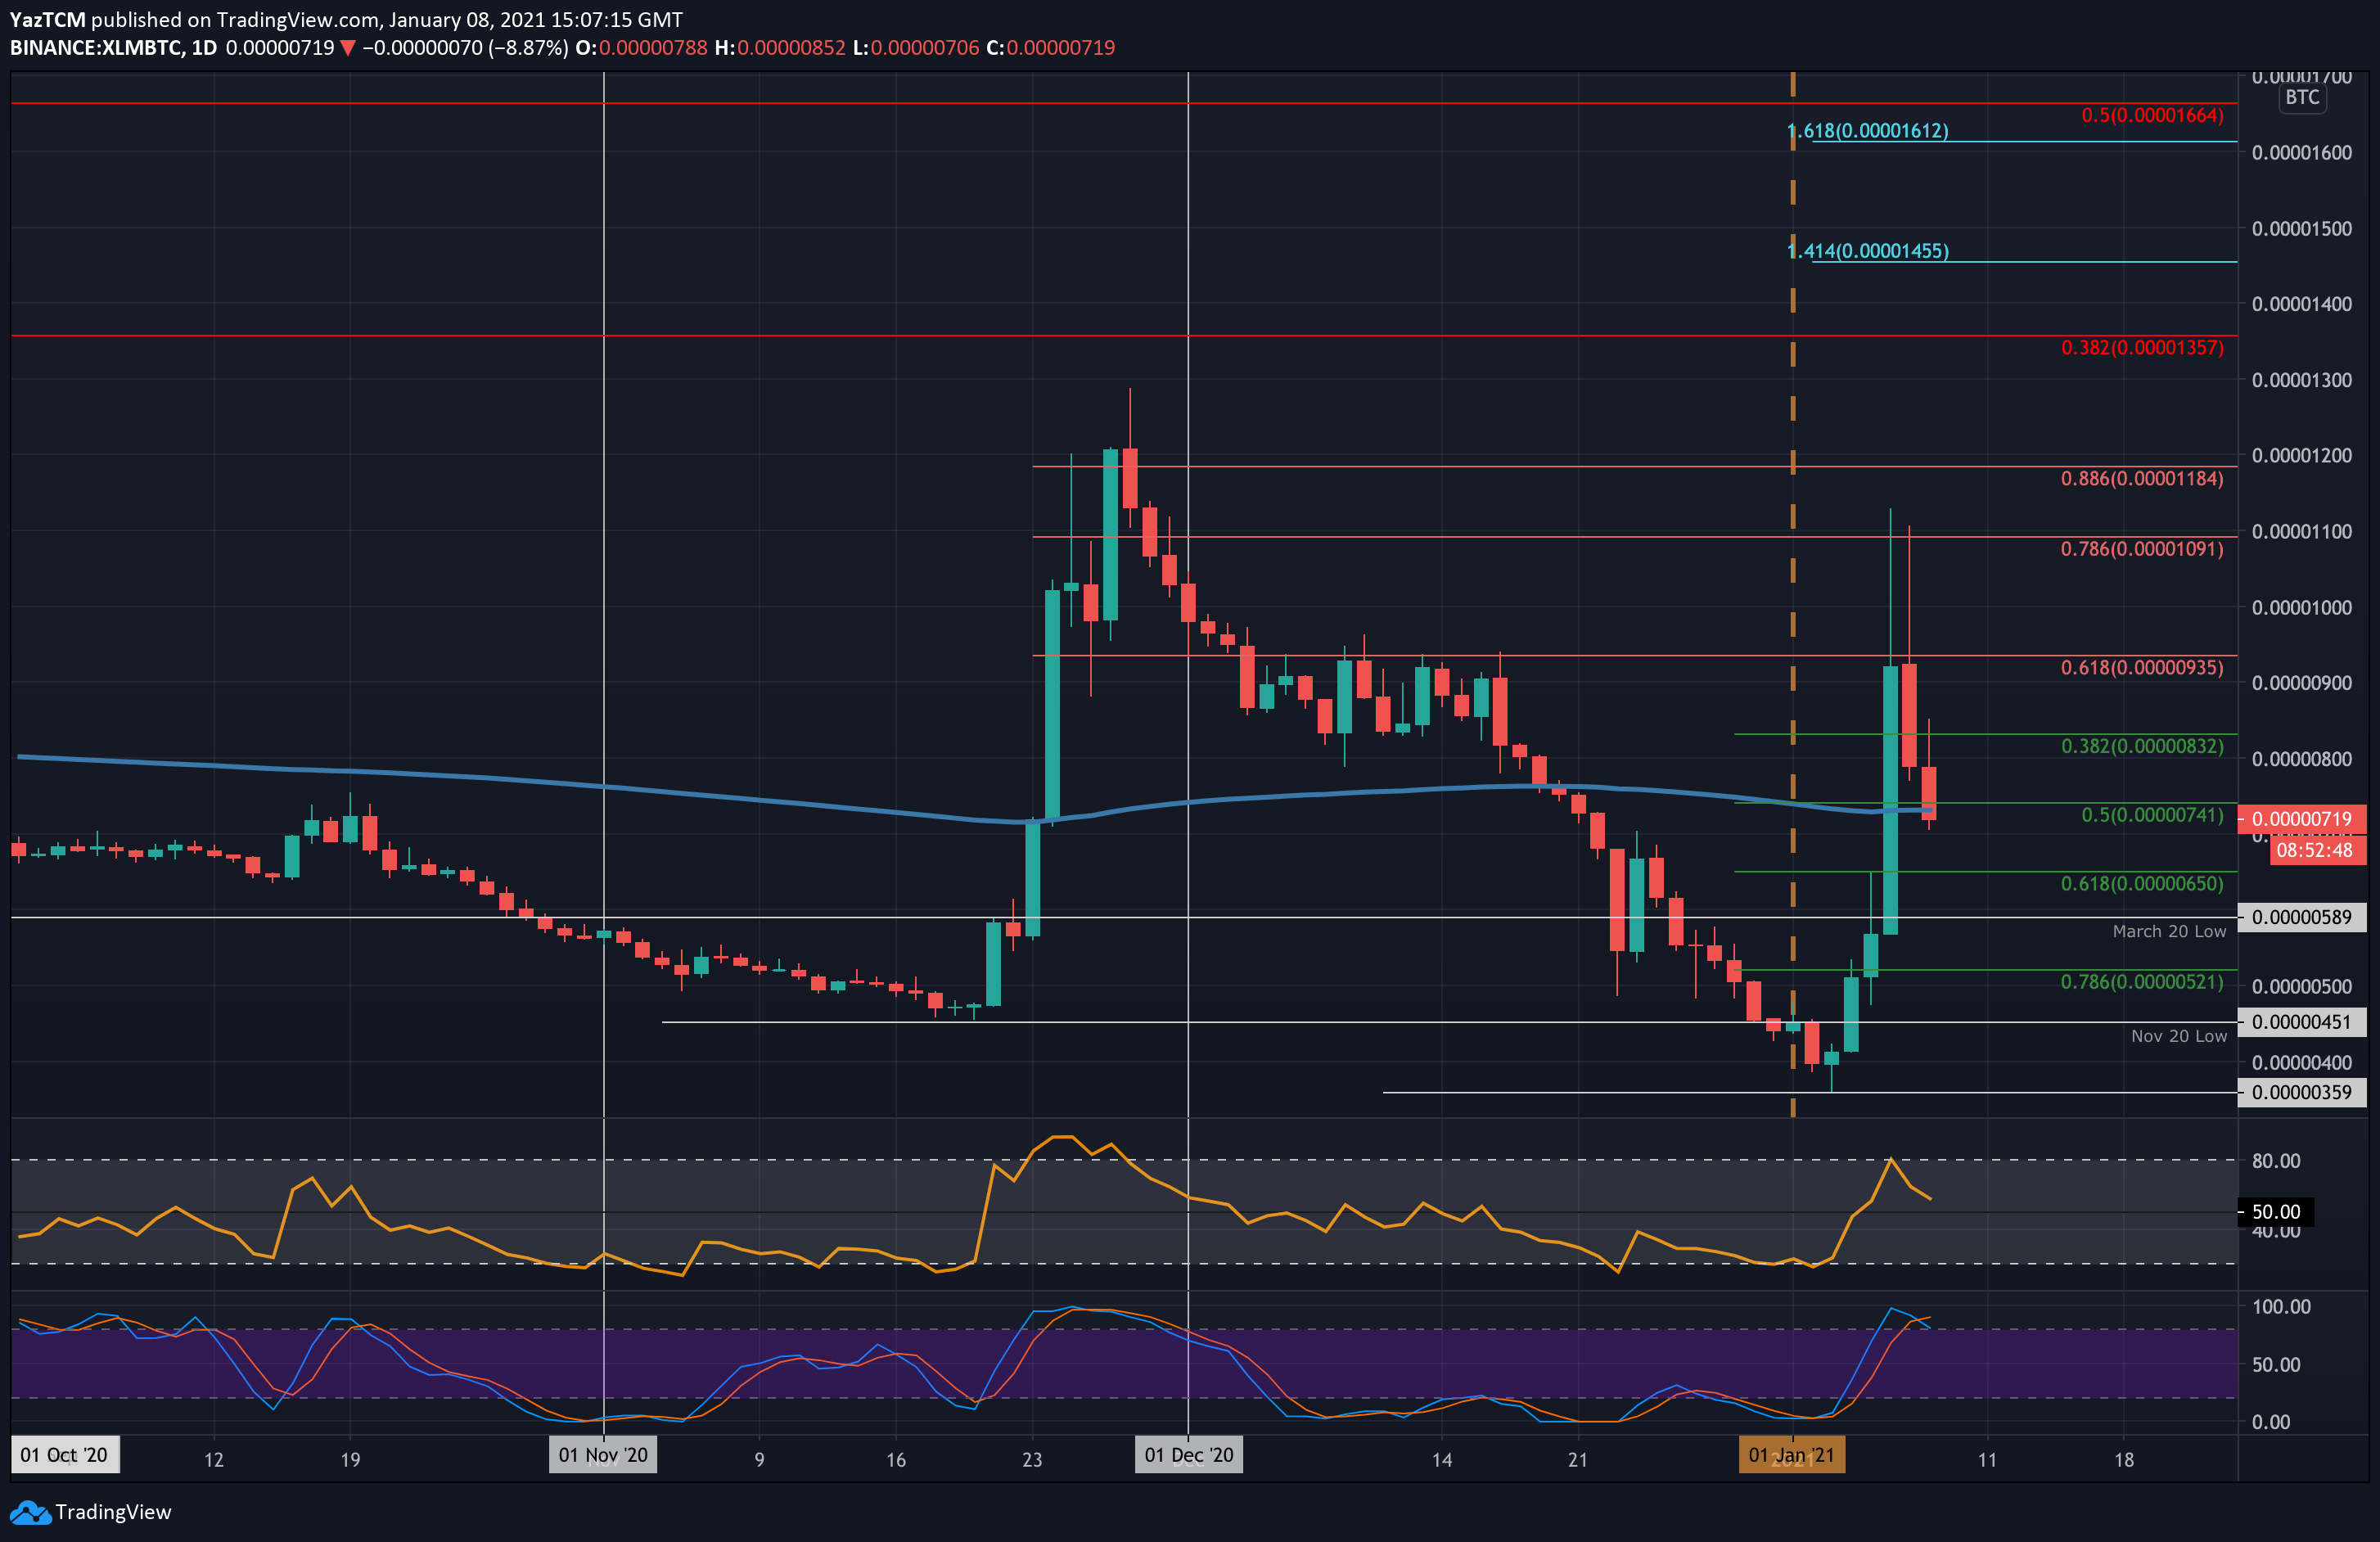
Against BTC, XLM started the year by spiking into multi-year lows at 360 SAT. From there, it quickly bounced higher and surged throughout the week, reaching as high as 1100 SAT on Wednesday.
More specifically, it was unable to close a daily candle above 935 SAT (bearish .618 Fib Retracement) and has since dropped to 720 SAT.
Looking ahead, if the sellers continue beneath 700 SAT, support lies at 650 SAT (.618 Fib), 598 SAT (March 2020 lows), 520 SAT (.786 Fib), 450 SAT (November 2020 Low), and 400 SAT.
On the other side, resistance lies at 800 SAT, 935 SAT (bearish .618 Fib), 1000 SAT, and 1090 SAT (bearish .786 Fib).
Chainlink
LINK saw a solid 38.5% price hike this week as the cryptocurrency trades around $16. It started the week by rebounding from $11 as it began to push. It managed to reach as high as $19.17 (bearish .886 Fib Retracement) yesterday but could not close a daily candle above $17.35 (1.272 Fib Extension).
It has since dropped into the support at $15.80 (.382 Fib) and bounced toward $16.
Looking ahead, if the sellers break $15.80, the first level of support lies at $14.78 (.5 Fib). This is followed by $14.30, $13.75 (.618 Fib), $13, and $12.50.
On the other side, the first level of resistance lies at $17.35. This is followed by $18.24, $19.17 (bearish .886 Fib), and $20. Above $20, resistance lies at $20.77 (ATH), $21.57, and $22.82.
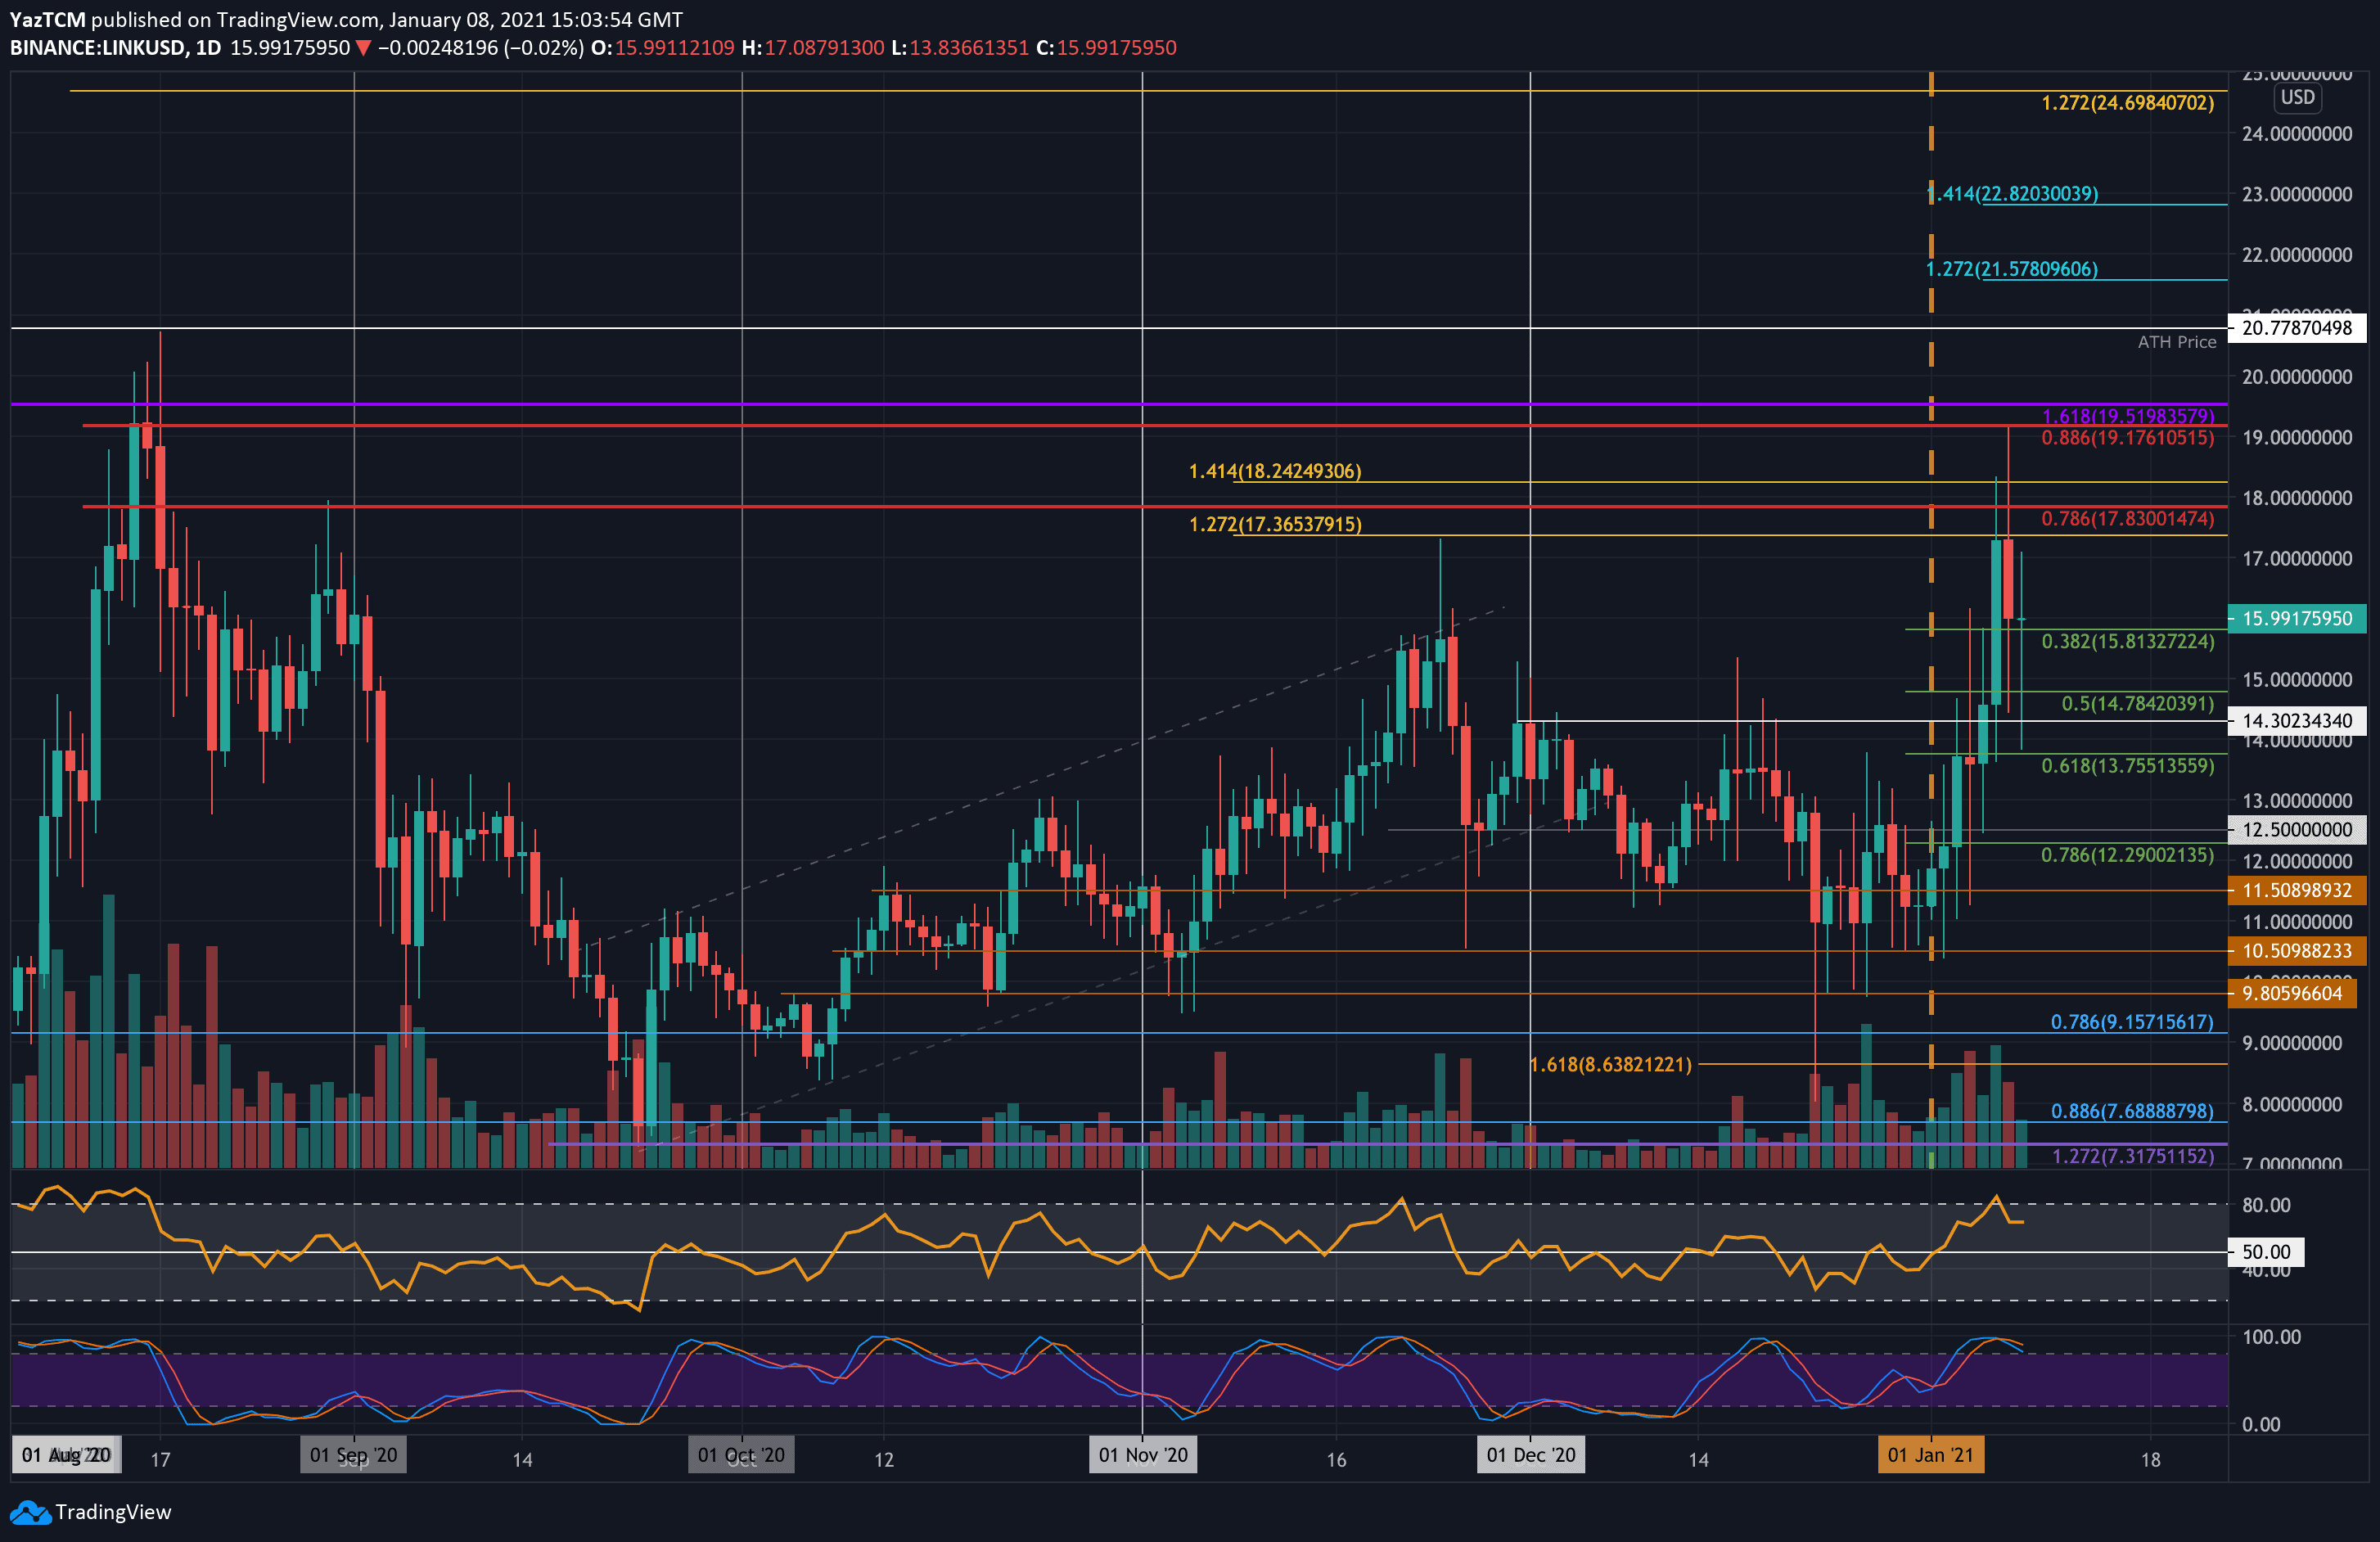
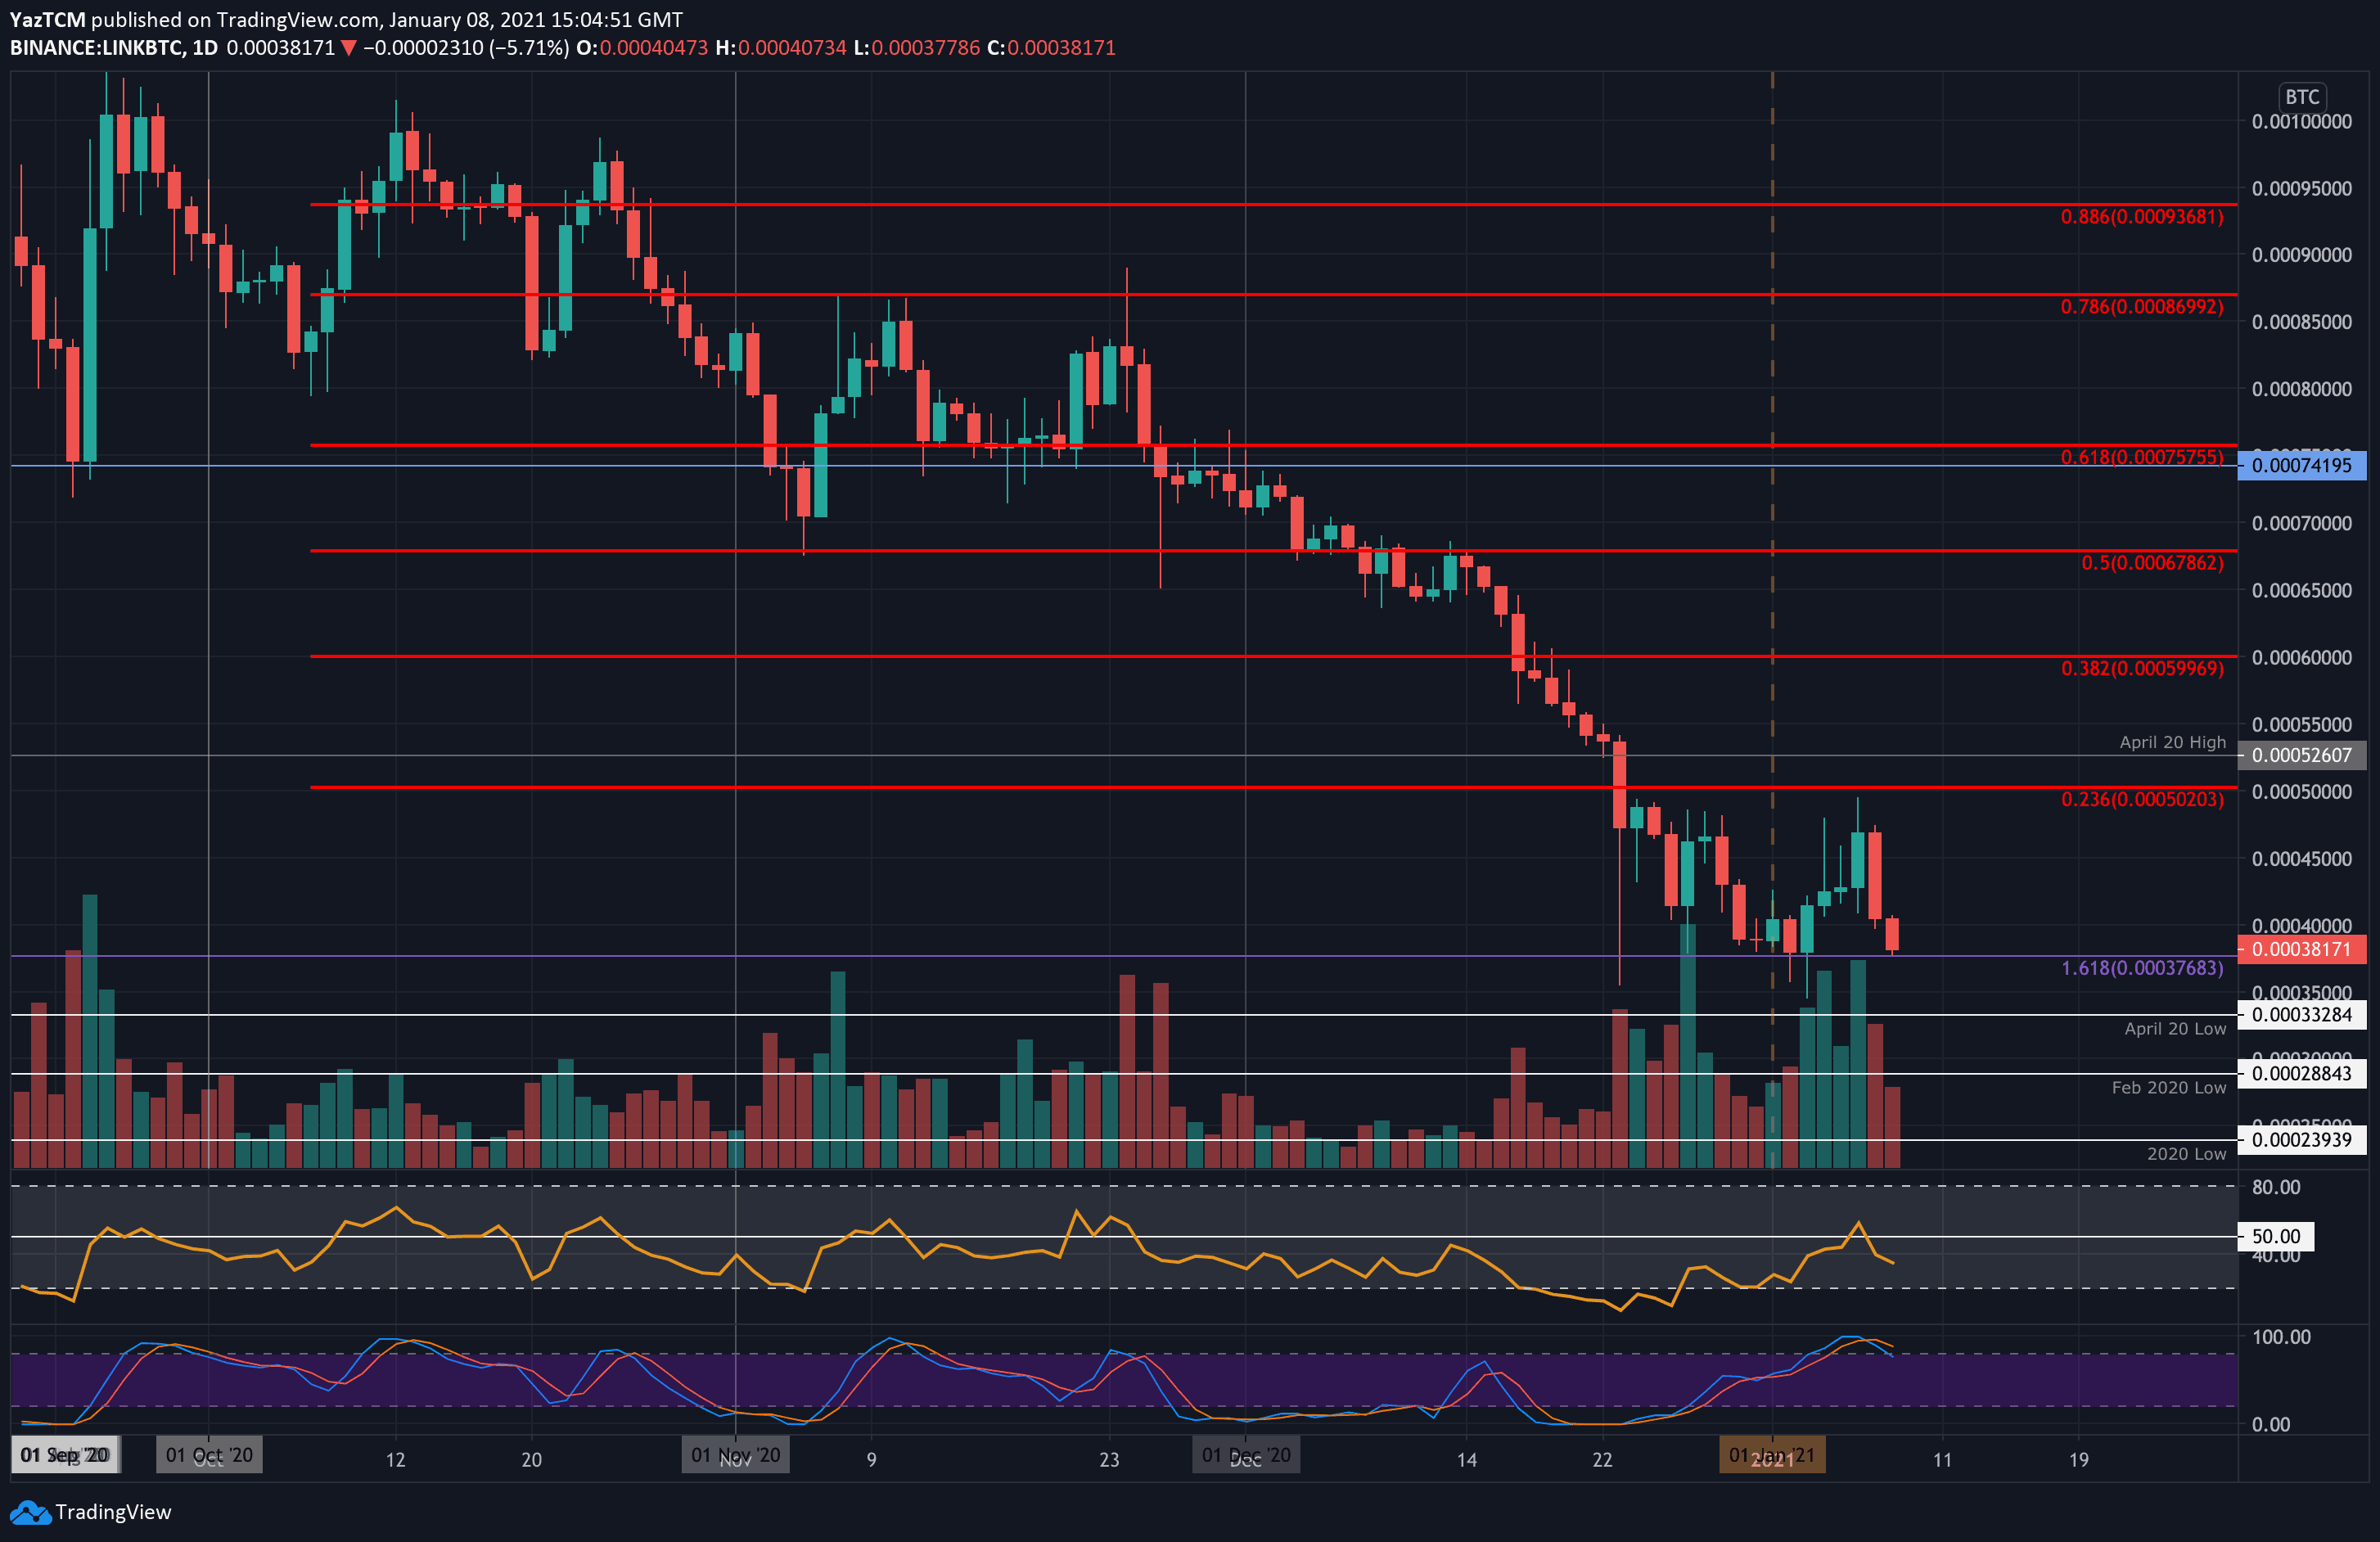
Against Bitcoin, LINK started the week by rebounding from support at 37,700 SAT (downside 1.618 Fib Extension). It managed to push as high as 49,500 SAT throughout the week but has since dropped lower to return to the 37,700 SAT support.
Moving forward, if the bears break the 37,700 SAT support, added support lies at 35,000 SAT, 33,300 SAT (April 20 low), 30,000 SAT, and 28,850 SAT (Feb 2020 low).
On the other side, resistance lies at 40,000 SAT, 45,000 SAT, 50,000 SAT (bearish .236 Fib), and 52,600 SAT (April 20 high).