Although Bitcoin has experienced a significant surge in the last few days, Ripple’s price action has been more stagnant, with no specific direction and limited volatility. However, the cryptocurrency is currently in a tight range and will likely exit soon, possibly leading to an impulsive move. Technical Analysis By Shayan The Daily Chart The cryptocurrency market experienced a bullish trend this week, with many assets, including Bitcoin and Ethereum, seeing a surge in price. However, Ripple was an exception as it continued to consolidate with no clear direction. Nevertheless, XRP is currently within the narrow range of a triangle and must break out of it soon. This will likely result in an impulsive move based on the breakout’s direction. If it’s bullish, the main barrier
Topics:
CryptoVizArt considers the following as important: Ripple (XRP) Price, XRP Analysis, xrpbtc, xrpusd
This could be interesting, too:
Jordan Lyanchev writes Ripple’s (XRP) Surge to Triggers Over Million in Short Liquidations
Jordan Lyanchev writes Trump Confirms Work on Strategic Crypto Reserve: XRP, ADA, SOL Included
Dimitar Dzhondzhorov writes Is a Major Ripple v. SEC Lawsuit Development Expected This Week? Here’s Why
Mandy Williams writes Ripple Releases Institutional DeFi Roadmap for XRP Ledger in 2025
Although Bitcoin has experienced a significant surge in the last few days, Ripple’s price action has been more stagnant, with no specific direction and limited volatility. However, the cryptocurrency is currently in a tight range and will likely exit soon, possibly leading to an impulsive move.
Technical Analysis
By Shayan
The Daily Chart
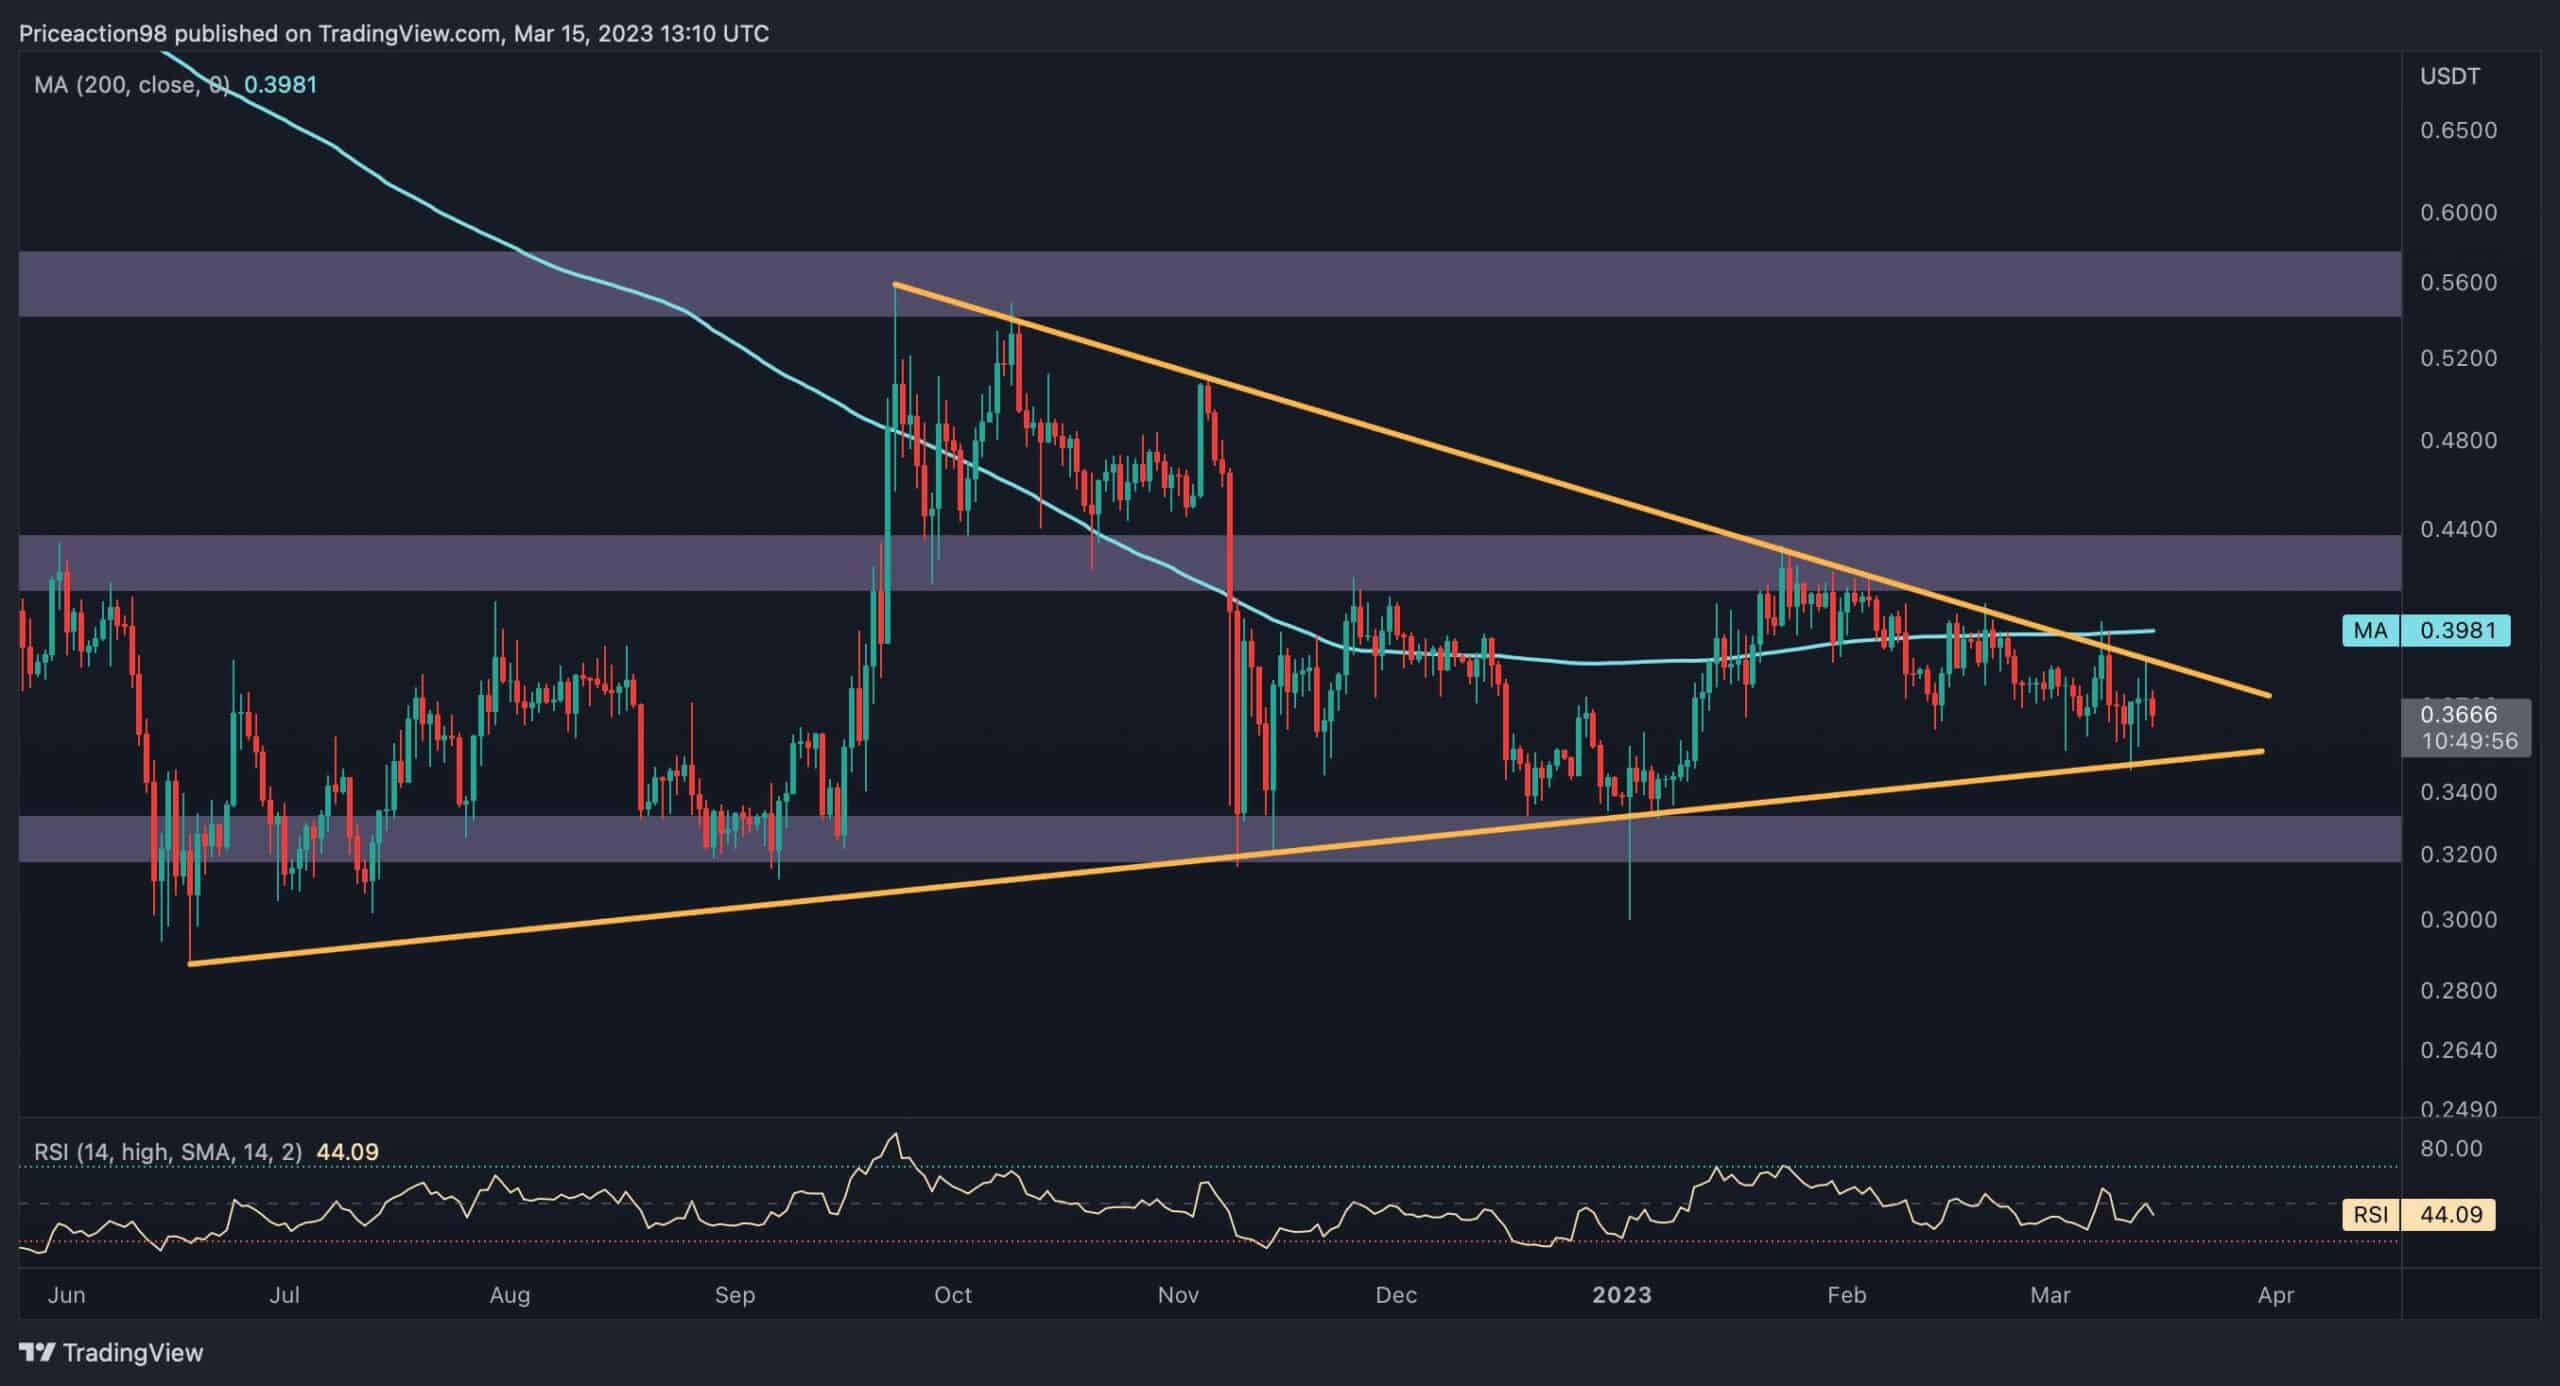
The cryptocurrency market experienced a bullish trend this week, with many assets, including Bitcoin and Ethereum, seeing a surge in price. However, Ripple was an exception as it continued to consolidate with no clear direction.
Nevertheless, XRP is currently within the narrow range of a triangle and must break out of it soon. This will likely result in an impulsive move based on the breakout’s direction. If it’s bullish, the main barrier to the price will be the 200-day moving average at $0.39.
On the other hand, if Ripple declines below the triangle’s lower trendline, the $0.32 region will serve as the main support for the price.
The 4-Hour Chart
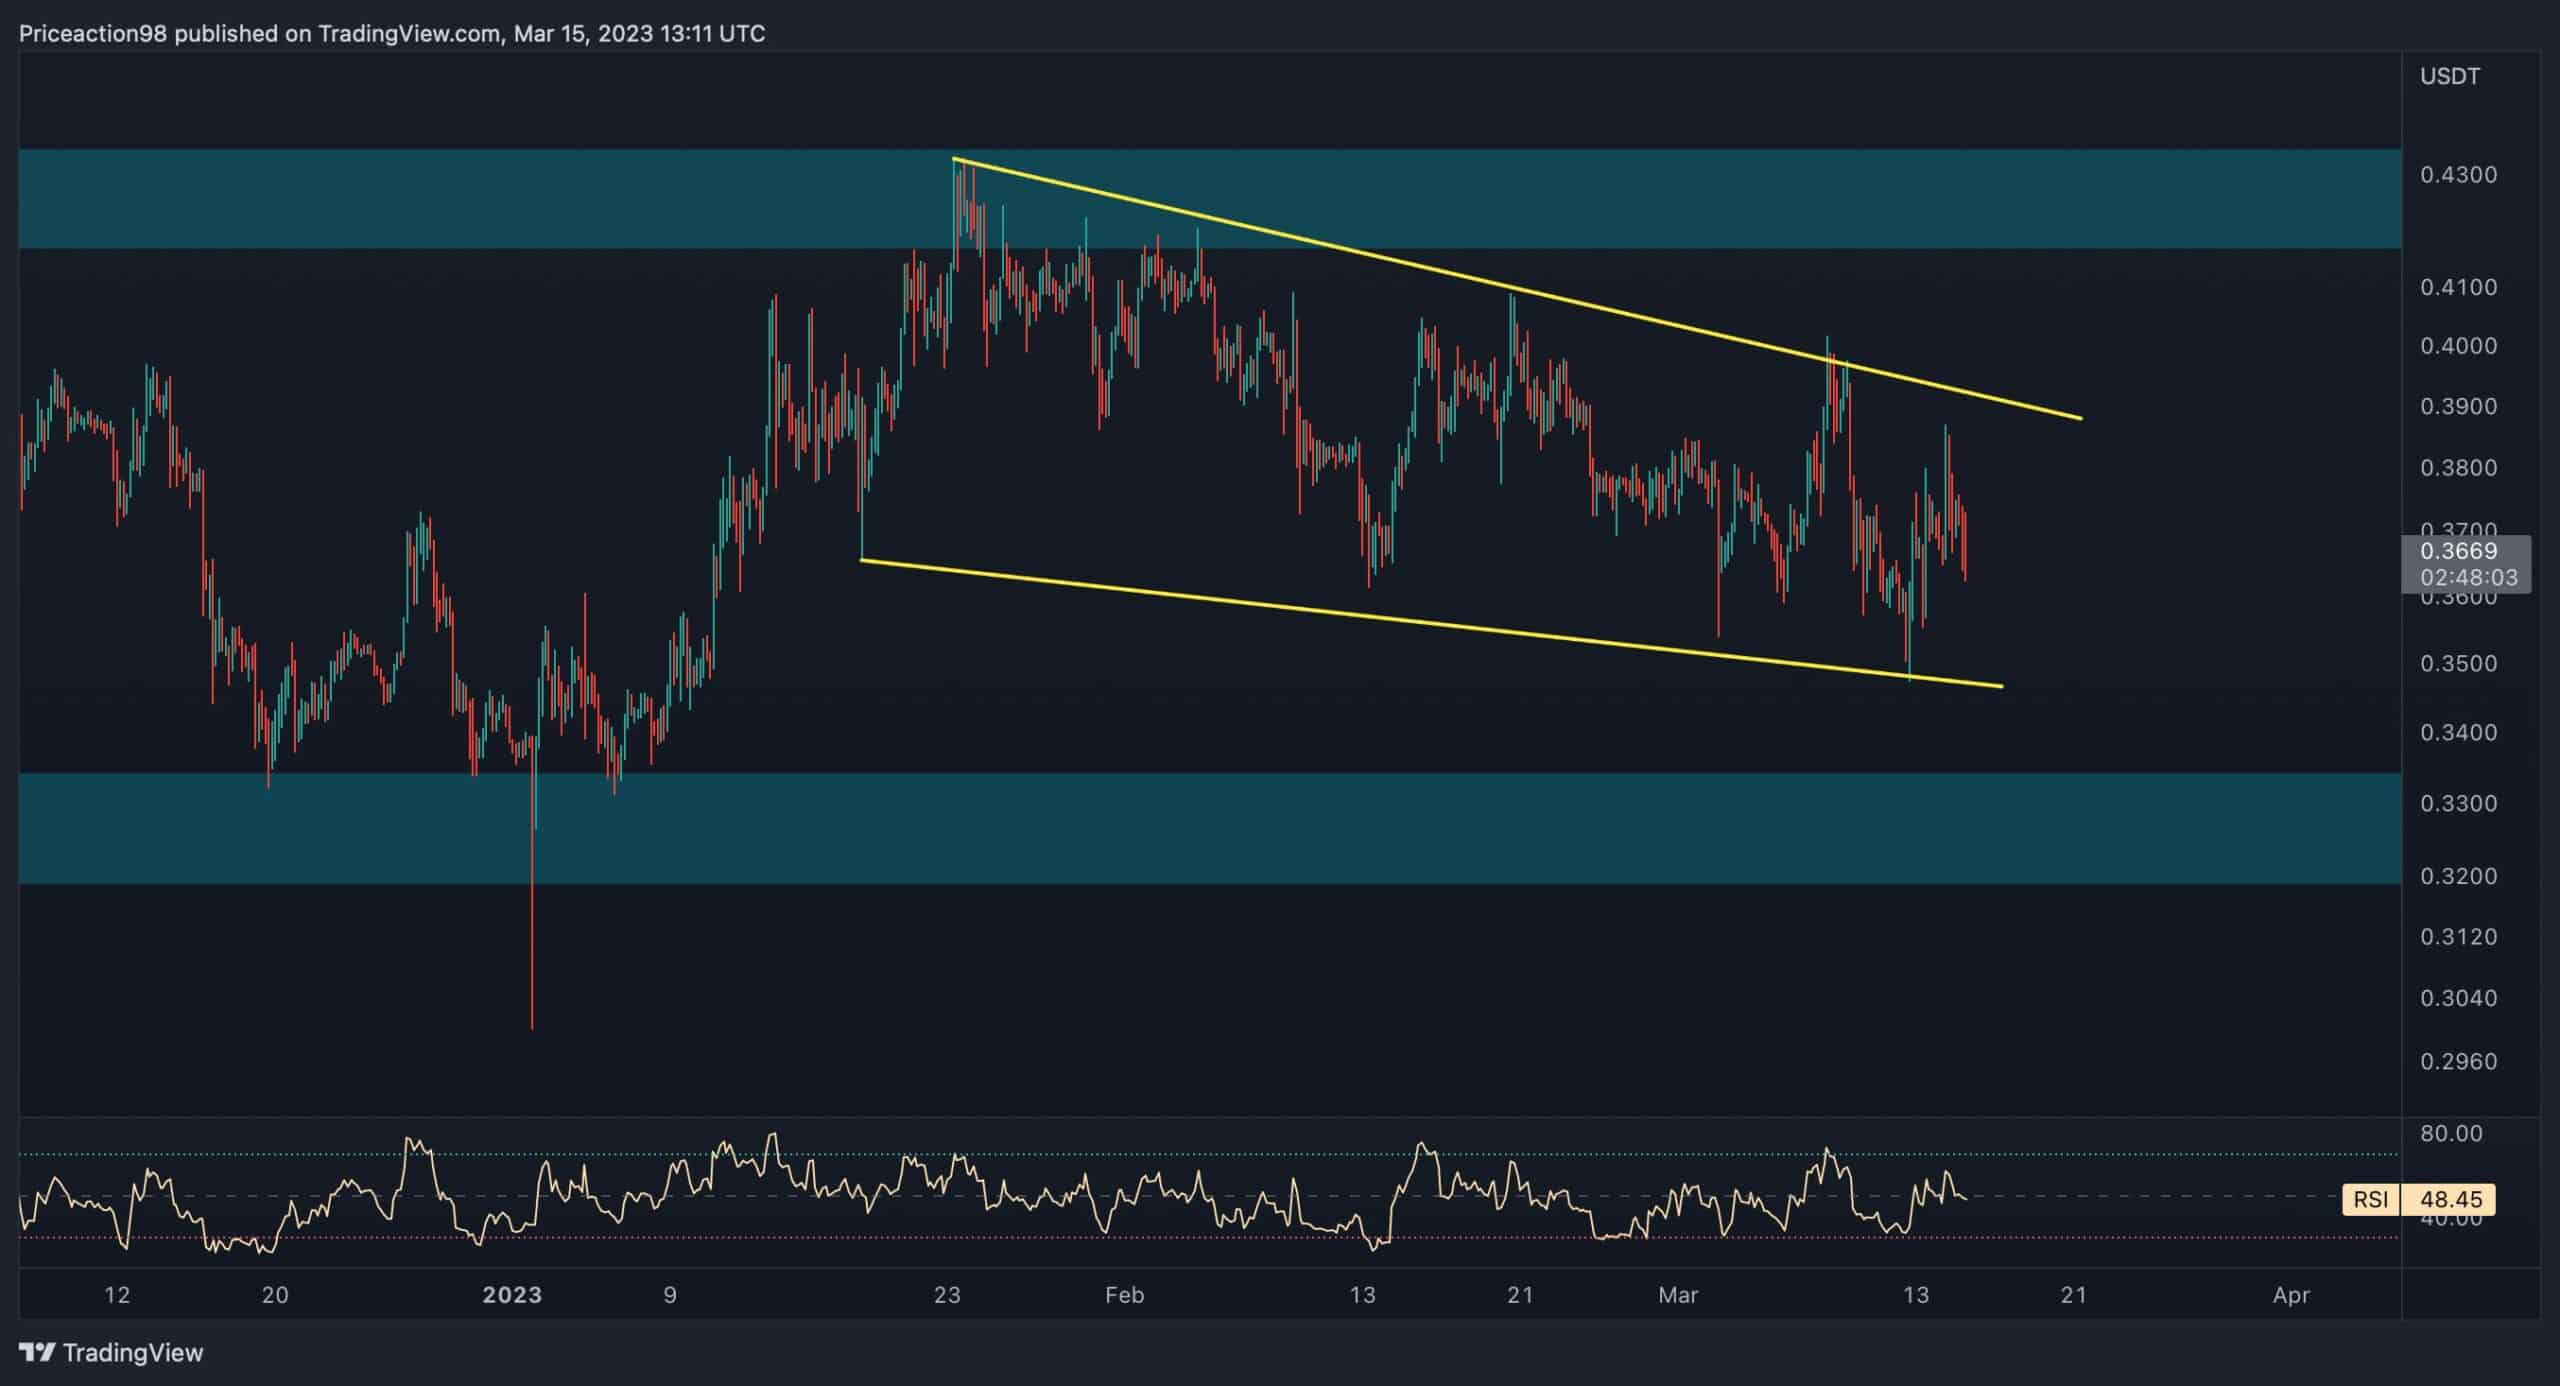
Ripple has been stuck in a static range between $0.32 and $0.43 and has failed to break out for quite a while. Meanwhile, the price has formed a descending wedge pattern, marked with yellow trendlines.
If the cryptocurrency successfully claims the upper trendline, it will potentially start a rally toward the $0.43 resistance level.
Long story short, XRP currently seems to have no specific direction and is anticipated to consolidate for the short-term period. Nevertheless, the upcoming price action might put an end to the uncertainty sentiment and provide a direction for the mid-term outlook.