Recently, the market has been relatively uneventful, with Bitcoin’s price showing slight volatility but lacking a clear direction. This uncertainty has left traders puzzled about what the next move might be. However, if Bitcoin’s price breaks above the K resistance region, there might be a positive turn, leading to a potential long-term uptrend. Bitcoin Price Analysis By Shayan The Daily Chart Taking a closer look at the daily chart, a bearish double-top pattern is visible near the major resistance zone at K. Moreover, the price is encountering strong dynamic resistance from the middle-trendline of the ascending channel, resulting in some rejection. Additionally, an extended noticeable divergence between the price and the RSI indicator indicates a possible shift in
Topics:
CryptoVizArt considers the following as important: Bitcoin (BTC) Price, BTC Analysis, BTCEUR, BTCGBP, btcusd, btcusdt
This could be interesting, too:
Chayanika Deka writes XRP, SOL, and ADA Inclusion in US Crypto Reserve Pushes Traders on Edge
Chayanika Deka writes Why Arthur Hayes Is Bullish on Bitcoin Under Trump’s Economic Strategy
Mandy Williams writes Why the Bitcoin Market Is Stuck—and the Key Metric That Could Change It: CryptoQuant CEO
Wayne Jones writes Metaplanet Acquires 156 BTC, Bringing Total Holdings to 2,391
Recently, the market has been relatively uneventful, with Bitcoin’s price showing slight volatility but lacking a clear direction.
This uncertainty has left traders puzzled about what the next move might be. However, if Bitcoin’s price breaks above the $30K resistance region, there might be a positive turn, leading to a potential long-term uptrend.
Bitcoin Price Analysis
By Shayan
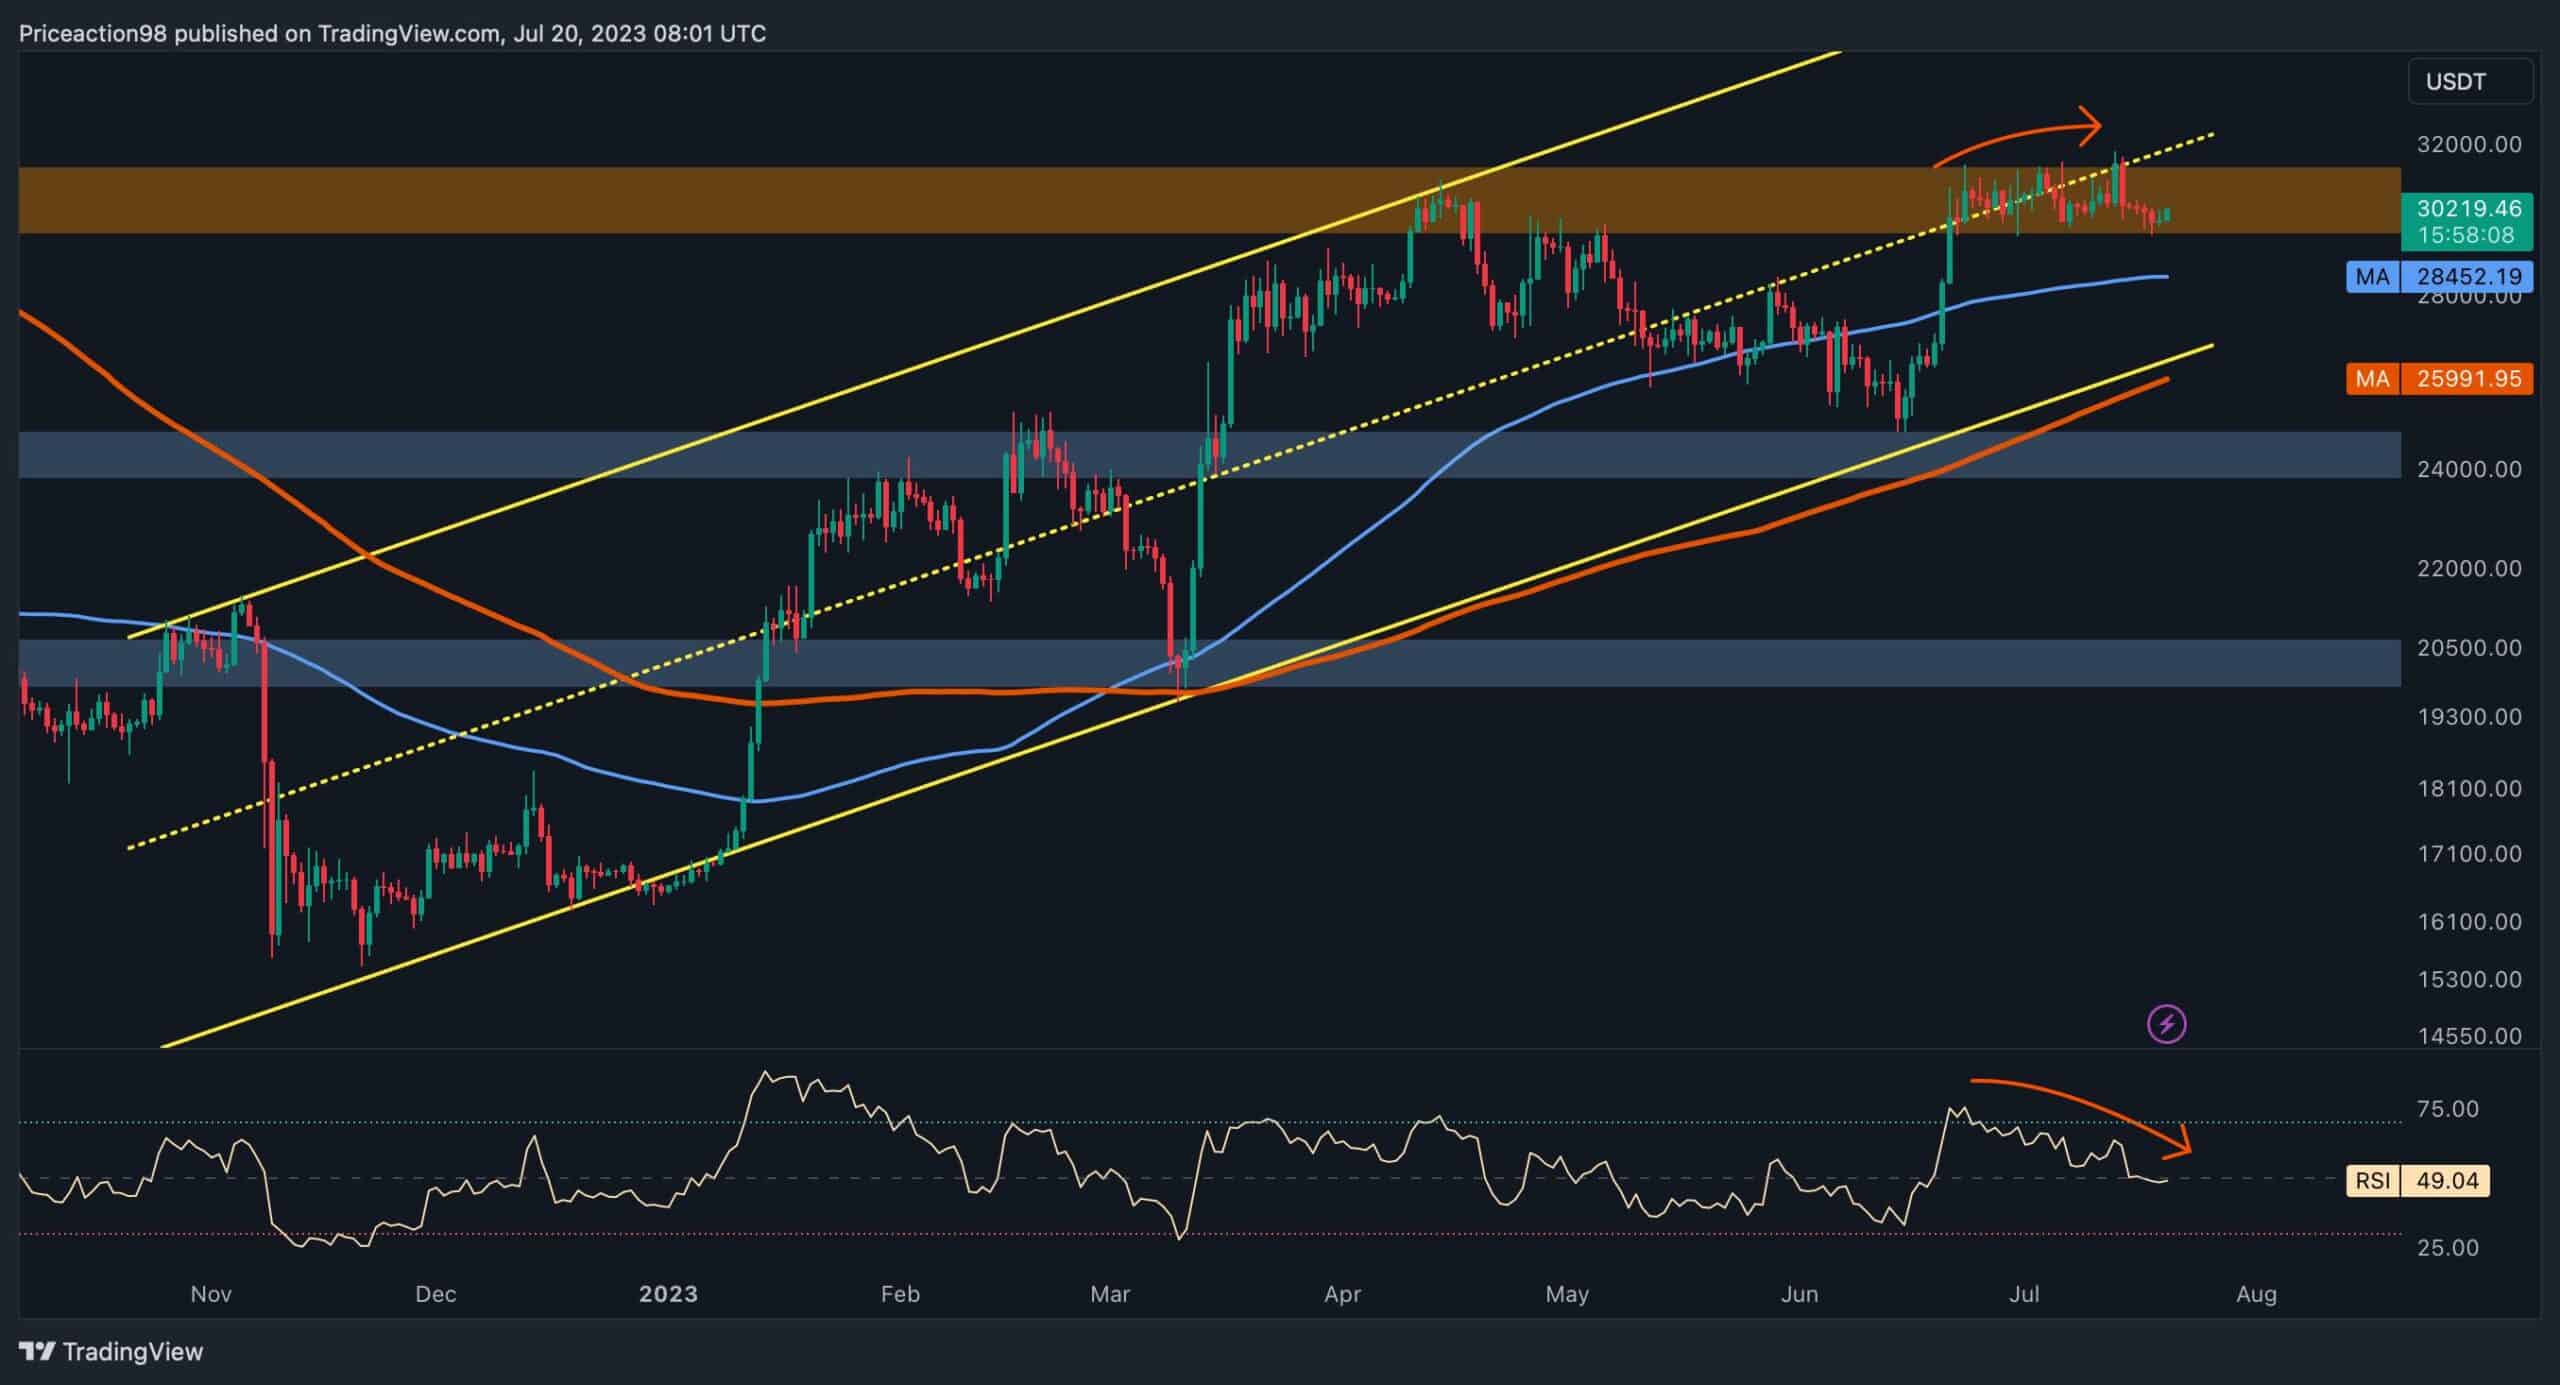
The Daily Chart
Taking a closer look at the daily chart, a bearish double-top pattern is visible near the major resistance zone at $30K. Moreover, the price is encountering strong dynamic resistance from the middle-trendline of the ascending channel, resulting in some rejection.
Additionally, an extended noticeable divergence between the price and the RSI indicator indicates a possible shift in market conditions. If the prevailing supply around this crucial region dominates the demand for the cryptocurrency, the next target might be around the $28.5K level, which aligns with the 100-day moving average.
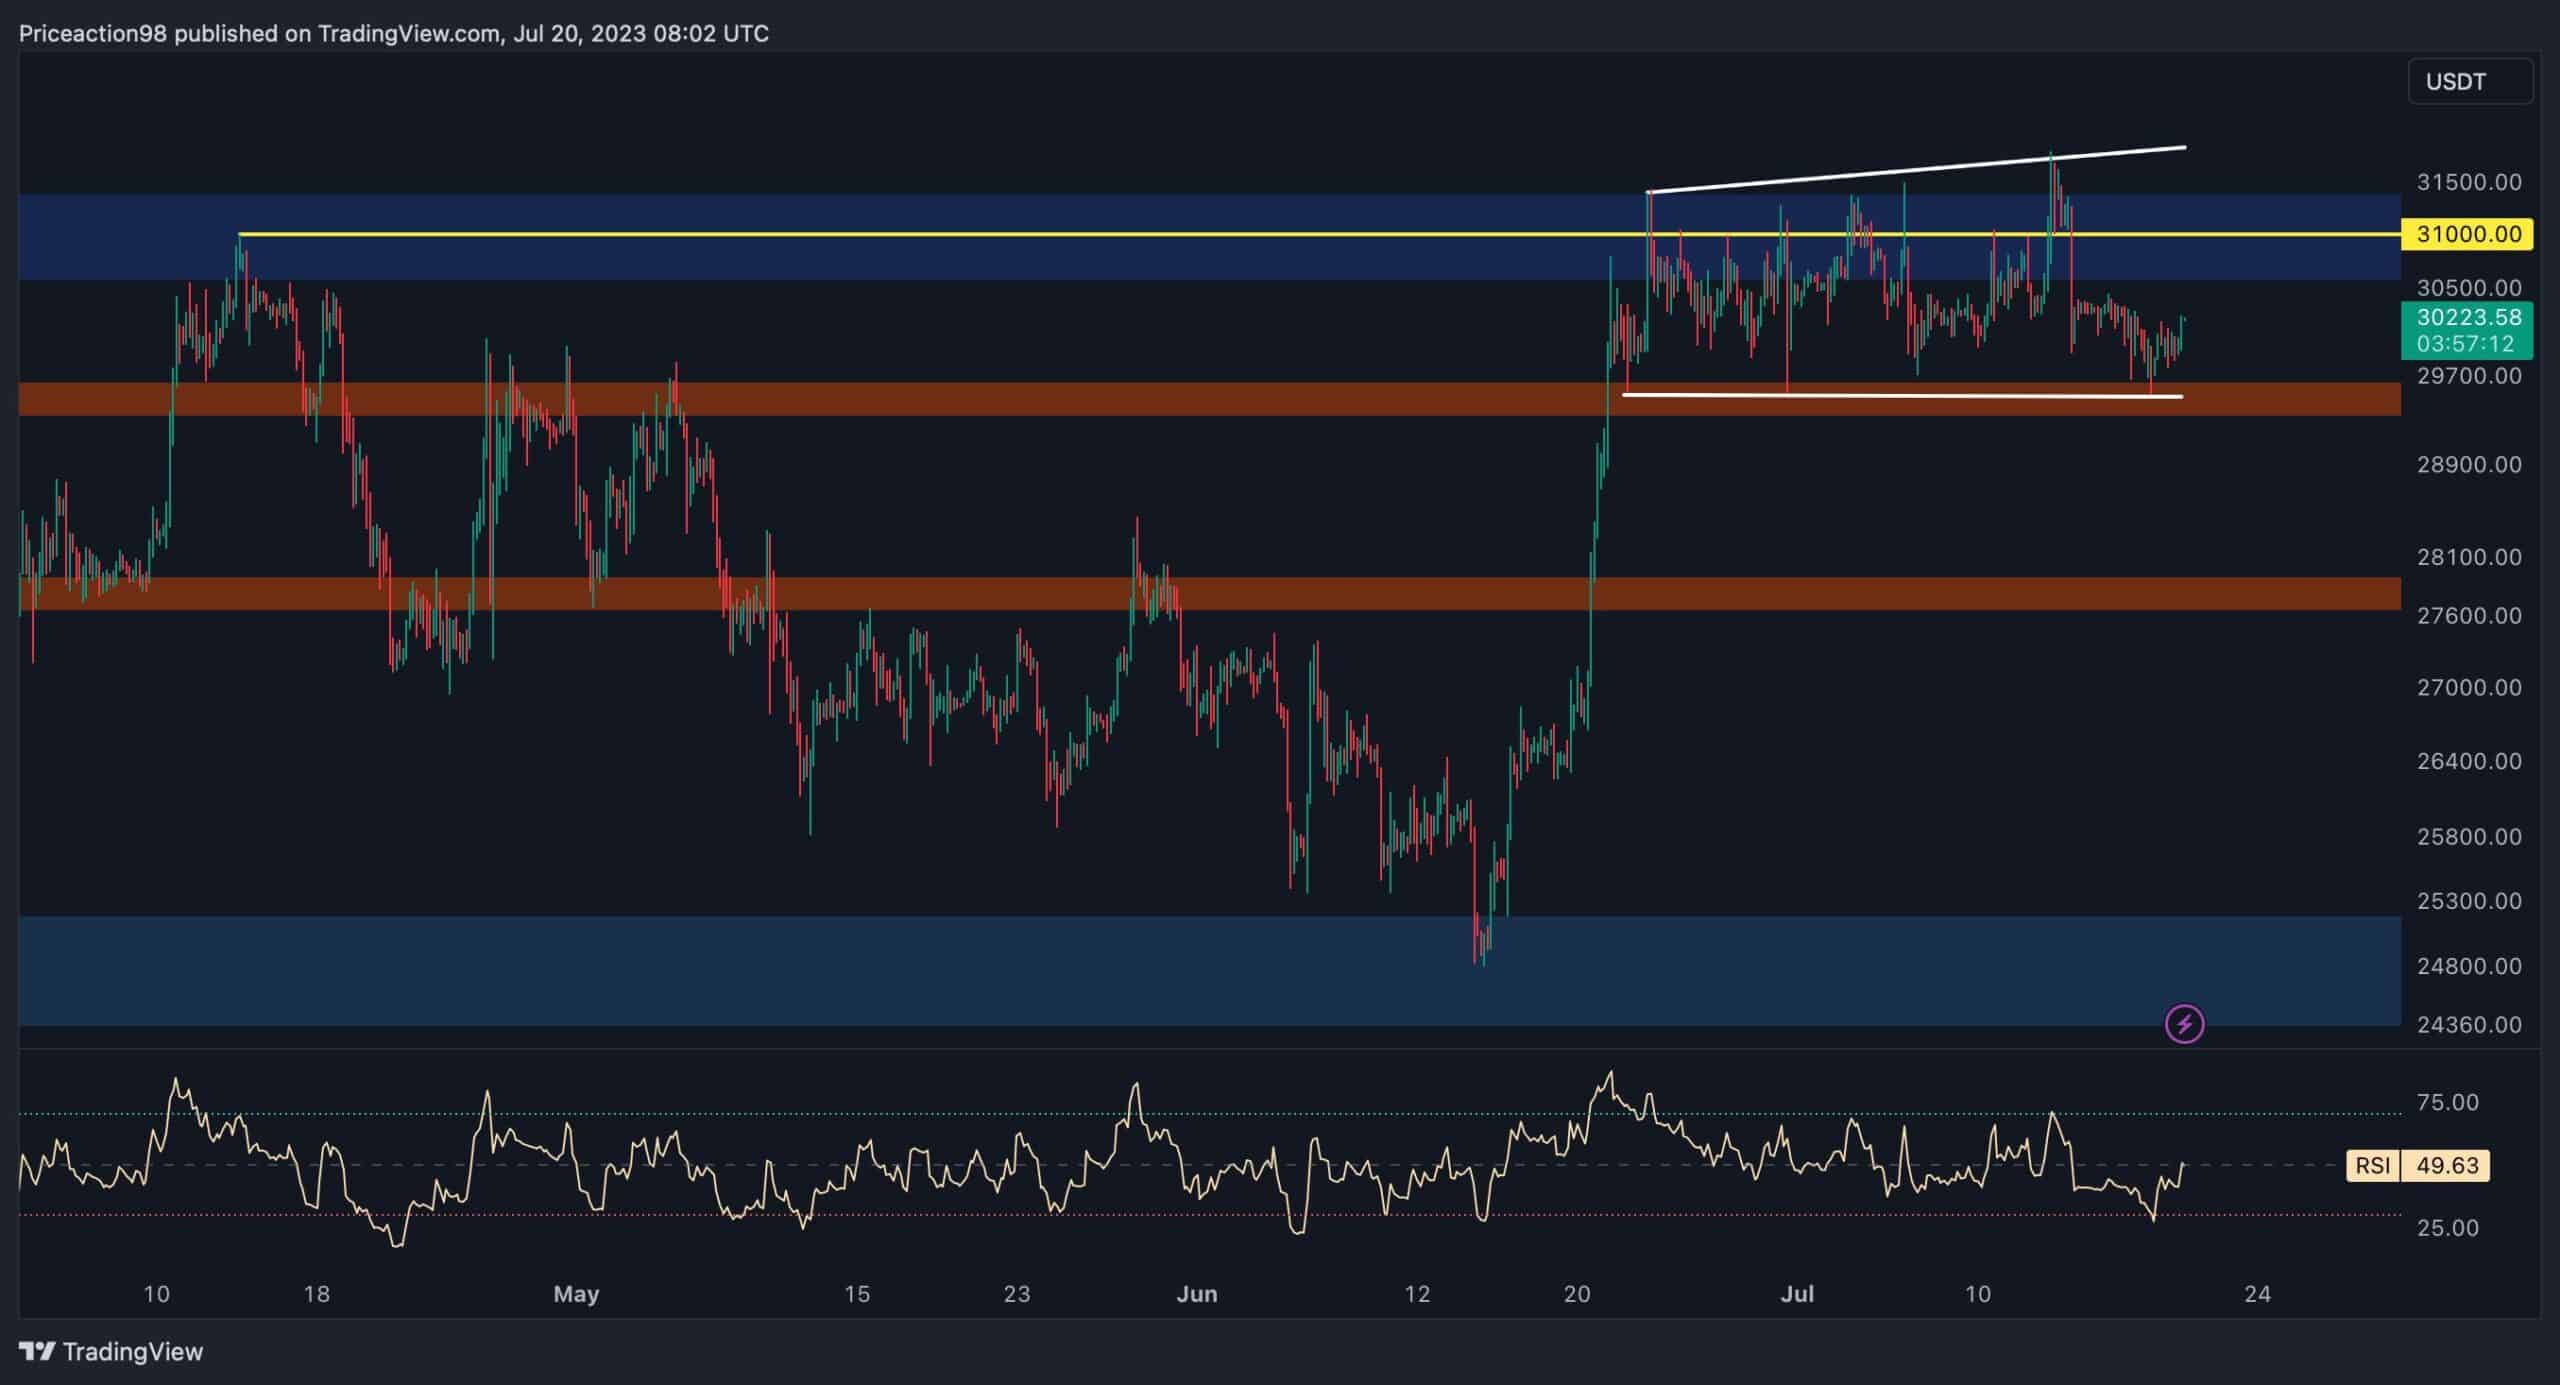
The 4-Hour Chart
Shifting the focus to the 4-hour chart, it becomes apparent that the price has entered a prolonged consolidation range after reaching the critical price zone of $30K. Notably, this range coincides with the prior significant swing high, which has served strong resistance due to expanded supply.
Furthermore, the price has formed a broadening wedge pattern, often indicating a potential reversal. If Bitcoin breaks below the lower edge of the wedge, it might signal a mid-term reversal.
In conclusion, if the cryptocurrency faces rejection, its next target could be the static support region of around $28K.
On-chain Analysis
By Shayan
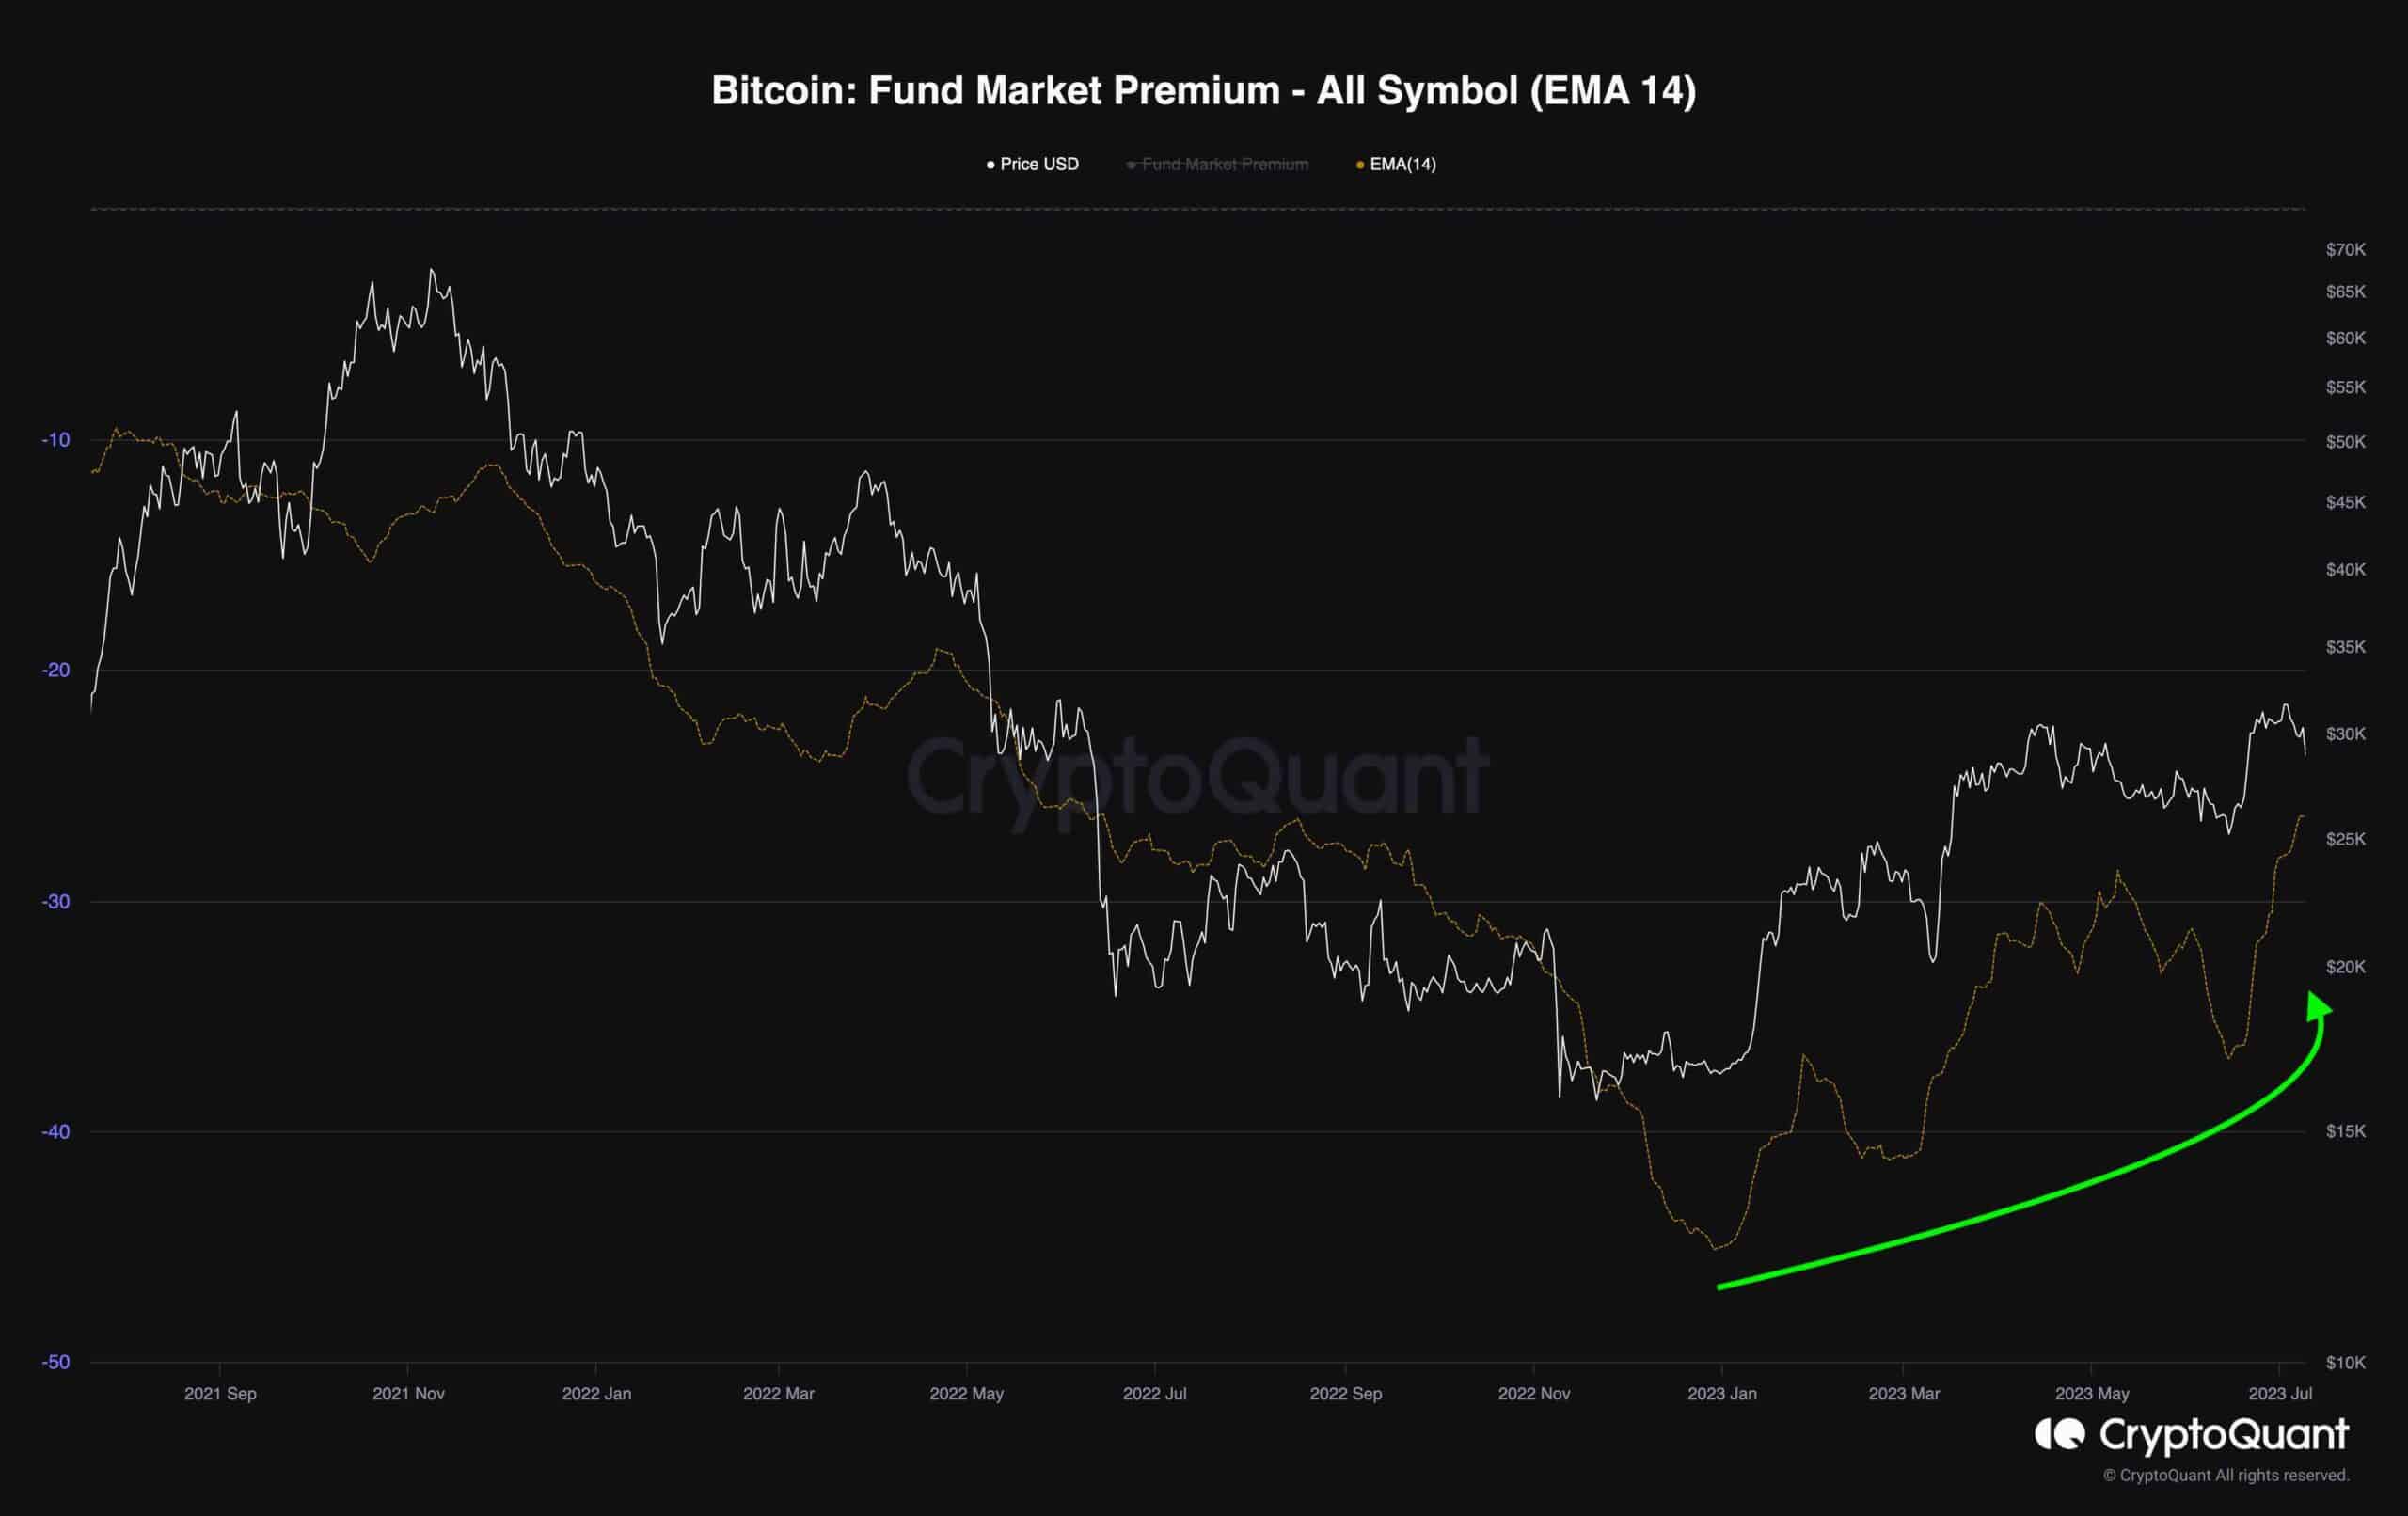
The premium of a fund, such as a Bitcoin trust, serves as an essential indicator of the market price’s excess over the fund’s Net Asset Value (NAV), representing its underlying assets. Over the period between January 2023 and today, the consistent growth of the premium for the Bitcoin trust indicates a notable surge in investor interest in acquiring this fund.
This trend is indicative of a rising demand for Bitcoin in the market.
As the premium for the Bitcoin trust continues its upward trend, it narrows the gap between its market price and the actual market value of Bitcoin contracts. This convergence is a clear indication that investors are becoming increasingly optimistic about the potential of Bitcoin, and they are willing to pay a higher premium to gain exposure to this digital asset.