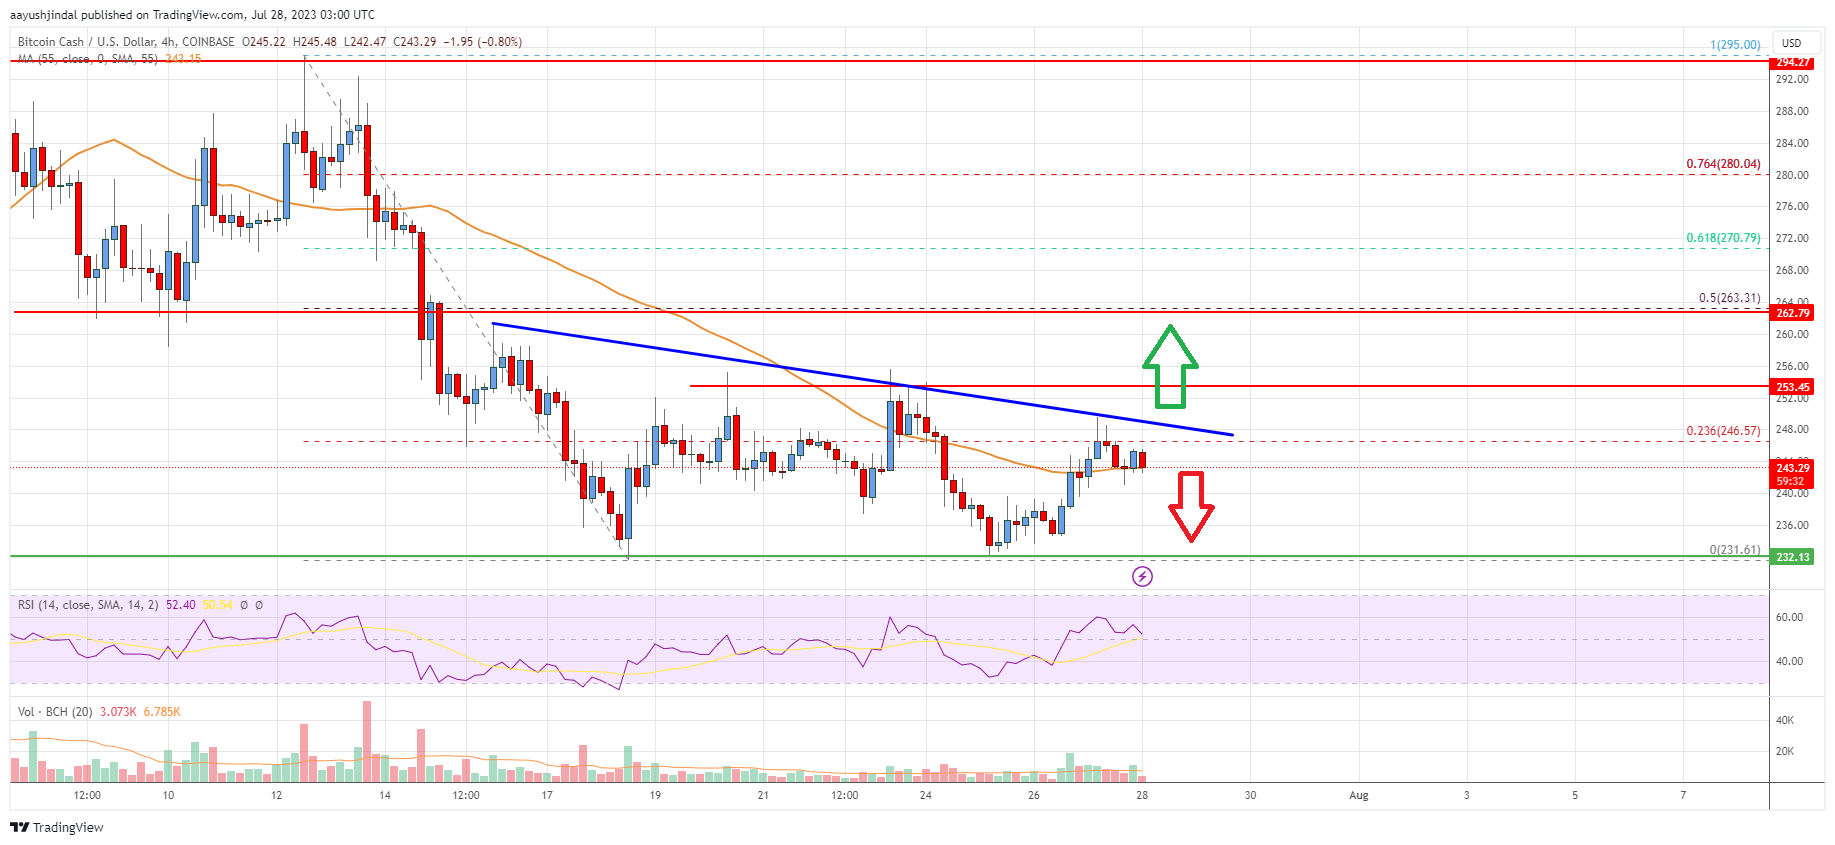
Bitcoin cash price started a fresh decline below the 5 zone against the US Dollar. The price is now trading below the 0 zone and the 55 simple moving average (4 hours). There is a connecting bearish trend line forming with resistance near 8 on the 4-hour chart of the BCH/USD pair (data feed from Coinbase). The pair could continue to move down if it stays below the 4 resistance zone. Bitcoin cash price is declining below the 0 zone against the US Dollar, similar to Bitcoin. BCH/USD could extend losses if there is a close below 0. Bitcoin Cash Price Analysis Bitcoin cash price remained in a bearish zone below the 5 and 0 resistance levels. BCH traded below the 5 support level to move further into a bearish zone. There was a clear move
Topics:
Aayush Jindal considers the following as important: Altcoin News, bch, Bitcoin Cash, News, Trading
This could be interesting, too:
Bitcoin Schweiz News writes Meme Coins frühzeitig entdecken: So gelingt der Einstieg vor dem Hype
Bitcoin Schweiz News writes Bitpanda vs. Binance: Welche Bitcoin-App ist die beste für die Schweiz?
Bilal Hassan writes Morocco Cracks Down on Crypto Property Deals
Bilal Hassan writes Crypto Becomes a U.S. ‘Weapon,’ Says CryptoQuant CEO
- Bitcoin cash price started a fresh decline below the $255 zone against the US Dollar.
- The price is now trading below the $250 zone and the 55 simple moving average (4 hours).
- There is a connecting bearish trend line forming with resistance near $248 on the 4-hour chart of the BCH/USD pair (data feed from Coinbase).
- The pair could continue to move down if it stays below the $254 resistance zone.
Bitcoin cash price is declining below the $250 zone against the US Dollar, similar to Bitcoin. BCH/USD could extend losses if there is a close below $230.
Bitcoin Cash Price Analysis
Bitcoin cash price remained in a bearish zone below the $285 and $280 resistance levels. BCH traded below the $265 support level to move further into a bearish zone.
There was a clear move below the $255 and $250 support levels. The pair even spiked below the $235 level. A low is formed near $231.62 and the price is now consolidating losses. It attempted a move above the 23.6% Fib retracement level of the downward move from the $295.00 swing high to the $231.62 low.
However, the bears seem to be active near $254 and $255. BCH is now trading below the $250 zone and the 55 simple moving average (4 hours). There is also a connecting bearish trend line forming with resistance near $248 on the 4-hour chart of the BCH/USD pair.
The next key resistance is near $264 and the 50% Fib retracement level of the downward move from the $295.00 swing high to the $231.62 low. Any more gains above $115 could set the pace for a move toward the $285 level.
If there is a move above the $285 resistance, the price could rise toward the $295 zone. If not, the price might continue lower below $235. Immediate support on the downside is near the $230 zone. The next major support is near the $225 level, below which the bears might aim for $212.

Looking at the chart, Bitcoin cash price is now trading below the $250 zone and the 55 simple moving average (4 hours). Overall, the price could continue to move down if it stays below the $254 resistance zone.
Technical indicators
4 hours MACD – The MACD for BCH/USD is losing pace in the bearish zone.
4 hours RSI (Relative Strength Index) – The RSI for BCH/USD is above the 50 level.
Key Support Levels – $230 and $225.
Key Resistance Levels – $254 and $264.
