ADA price is gaining pace above the %excerpt%.280 zone against the US Dollar. The price is now trading above %excerpt%.290 and the 55 simple moving average (4 hours). There is a key bullish trend line forming with support near %excerpt%.2980 on the 4-hour chart (data feed via Coinbase). The price could gain bullish momentum if it clears the %excerpt%.300 and %excerpt%.305 resistance levels. Cardano price is rising above %excerpt%.290 against the US Dollar, like Bitcoin. ADA price could rally if there is a clear move above the %excerpt%.3050 resistance. Cardano Price Analysis This week, Cardano price started a steady increase above the %excerpt%.265 resistance zone against the US Dollar. The ADA/USD pair gained pace for a move above the %excerpt%.272 and %excerpt%.280 levels. The bulls were able to pump the price toward the %excerpt%.292
Topics:
Aayush Jindal considers the following as important: ADA, Altcoin News, Cardano, News, Trading
This could be interesting, too:
Bitcoin Schweiz News writes Meme Coins frühzeitig entdecken: So gelingt der Einstieg vor dem Hype
Bitcoin Schweiz News writes Bitpanda vs. Binance: Welche Bitcoin-App ist die beste für die Schweiz?
Chayanika Deka writes XRP, SOL, and ADA Inclusion in US Crypto Reserve Pushes Traders on Edge
Bilal Hassan writes Morocco Cracks Down on Crypto Property Deals
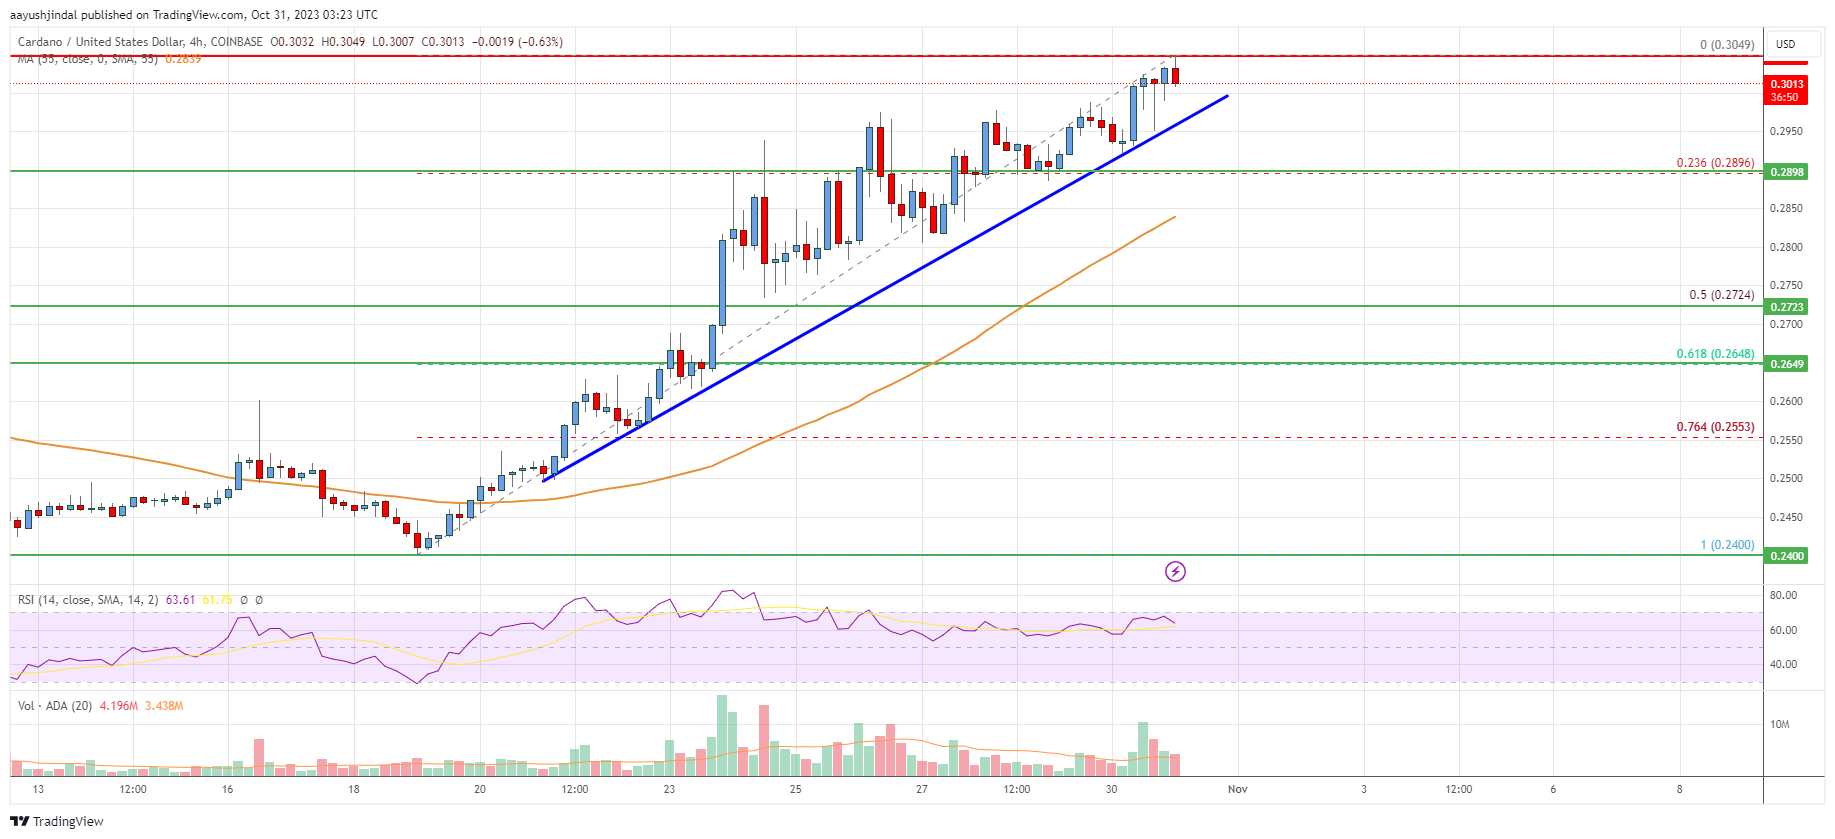
- ADA price is gaining pace above the $0.280 zone against the US Dollar.
- The price is now trading above $0.290 and the 55 simple moving average (4 hours).
- There is a key bullish trend line forming with support near $0.2980 on the 4-hour chart (data feed via Coinbase).
- The price could gain bullish momentum if it clears the $0.300 and $0.305 resistance levels.
Cardano price is rising above $0.290 against the US Dollar, like Bitcoin. ADA price could rally if there is a clear move above the $0.3050 resistance.
Cardano Price Analysis
This week, Cardano price started a steady increase above the $0.265 resistance zone against the US Dollar. The ADA/USD pair gained pace for a move above the $0.272 and $0.280 levels.
The bulls were able to pump the price toward the $0.292 resistance. The price even spiked above the $0.30 resistance. A high is formed near $0.3049 and the price is now consolidating gains. It is trading well above the 23.6% Fib retracement level of the upward move from the $0.2401 swing low to the $0.3049 high.
ADA price is still trading above $0.290 and the 55 simple moving average (4 hours). There is also a key bullish trend line forming with support near $0.2980 on the 4-hour chart.
On the upside, immediate resistance is near the $0.305 zone. The next major resistance is near the $0.312 zone. A clear move above the $0.312 resistance might start a strong increase toward $0.332. Any more gains above the $0.332 resistance might send the price toward the $0.350 resistance or even $0.365.
On the downside, immediate support is near the $0.295 level and the trend line. The next major support is near the $0.290 level, below which the price could test the 50% Fib retracement level of the upward move from the $0.2401 swing low to the $0.3049 high at $0.272.
A clear move below the $0.272 level might send the price toward the $0.265 level. Any more losses might send the price toward the $0.250 support.
The chart indicates that ADA price is now trading above $0.290 and the 55 simple moving average (4 hours). Overall, the price could gain bullish momentum if it clears the $0.305 and $0.312 resistance levels.
Technical Indicators
4 hours MACD – The MACD for ADA/USD is now gaining pace in the bullish zone.
4 hours RSI – The RSI for ADA/USD is now above the 50 level.
Key Support Levels – $0.290 and $0.272.
Key Resistance Levels – $0.305 and $0.312.