Solana price started a recovery wave above the .00 resistance against the US Dollar. The price is now trading above .00 and the 55 simple moving average (4 hours). There was a break above a key bearish trend line with resistance near .50 on the 4-hour chart of the SOL/USD pair (data feed from Coinbase). The pair must clear .50 and .80 to continue higher in the near term. Solana price is trading above .00 against the US Dollar, similar to Bitcoin. SOL could start a strong increase if it clears the .80 resistance. Solana (SOL) Price Analysis SOL price started a decent recovery wave from the .00 support zone. The price formed a base and was able to climb above the .50 and .60 levels. There was a clear move above the 23.6% Fib
Topics:
Aayush Jindal considers the following as important: Altcoin News, News, sol, solana, Trading
This could be interesting, too:
Bitcoin Schweiz News writes Meme Coins frühzeitig entdecken: So gelingt der Einstieg vor dem Hype
Christian Mäder writes Bitpanda startet DeFi Wallet und öffnet die Tür zu Web3
Bitcoin Schweiz News writes Bitpanda vs. Binance: Welche Bitcoin-App ist die beste für die Schweiz?
Bitcoin Schweiz News writes OpenSea: Der Marktplatz für NFTs und digitale Sammlerstücke
- Solana price started a recovery wave above the $20.00 resistance against the US Dollar.
- The price is now trading above $20.00 and the 55 simple moving average (4 hours).
- There was a break above a key bearish trend line with resistance near $19.50 on the 4-hour chart of the SOL/USD pair (data feed from Coinbase).
- The pair must clear $20.50 and $20.80 to continue higher in the near term.
Solana price is trading above $20.00 against the US Dollar, similar to Bitcoin. SOL could start a strong increase if it clears the $20.80 resistance.
Solana (SOL) Price Analysis
SOL price started a decent recovery wave from the $19.00 support zone. The price formed a base and was able to climb above the $19.50 and $19.60 levels.
There was a clear move above the 23.6% Fib retracement level of the downward move from the $22.02 swing high to the $19.02 low. Besides, there was a break above a key bearish trend line with resistance near $19.50 on the 4-hour chart of the SOL/USD pair.
The bulls were even able to push the price above the $20.00 resistance zone. However, the bears were active near the $20.50 resistance.
The price struggled to surpass the 50% Fib retracement level of the downward move from the $22.02 swing high to the $19.02 low. SOL is now trading above $20.00 and the 55 simple moving average (4 hours).
On the upside, immediate resistance is near the $20.50 level. The next major resistance is near the $20.80 zone. Any more gains might send SOL price towards the $22.00 resistance zone, above which the price could accelerate higher. The next major resistance sits near the $23.50 level.
On the downside, initial support is near the $20.00 level. The next major support is near the $19.50 level. A downside break below the $19.50 support level might push the price toward the $19.00 support. Any more losses might open the doors for more losses toward $18.00.
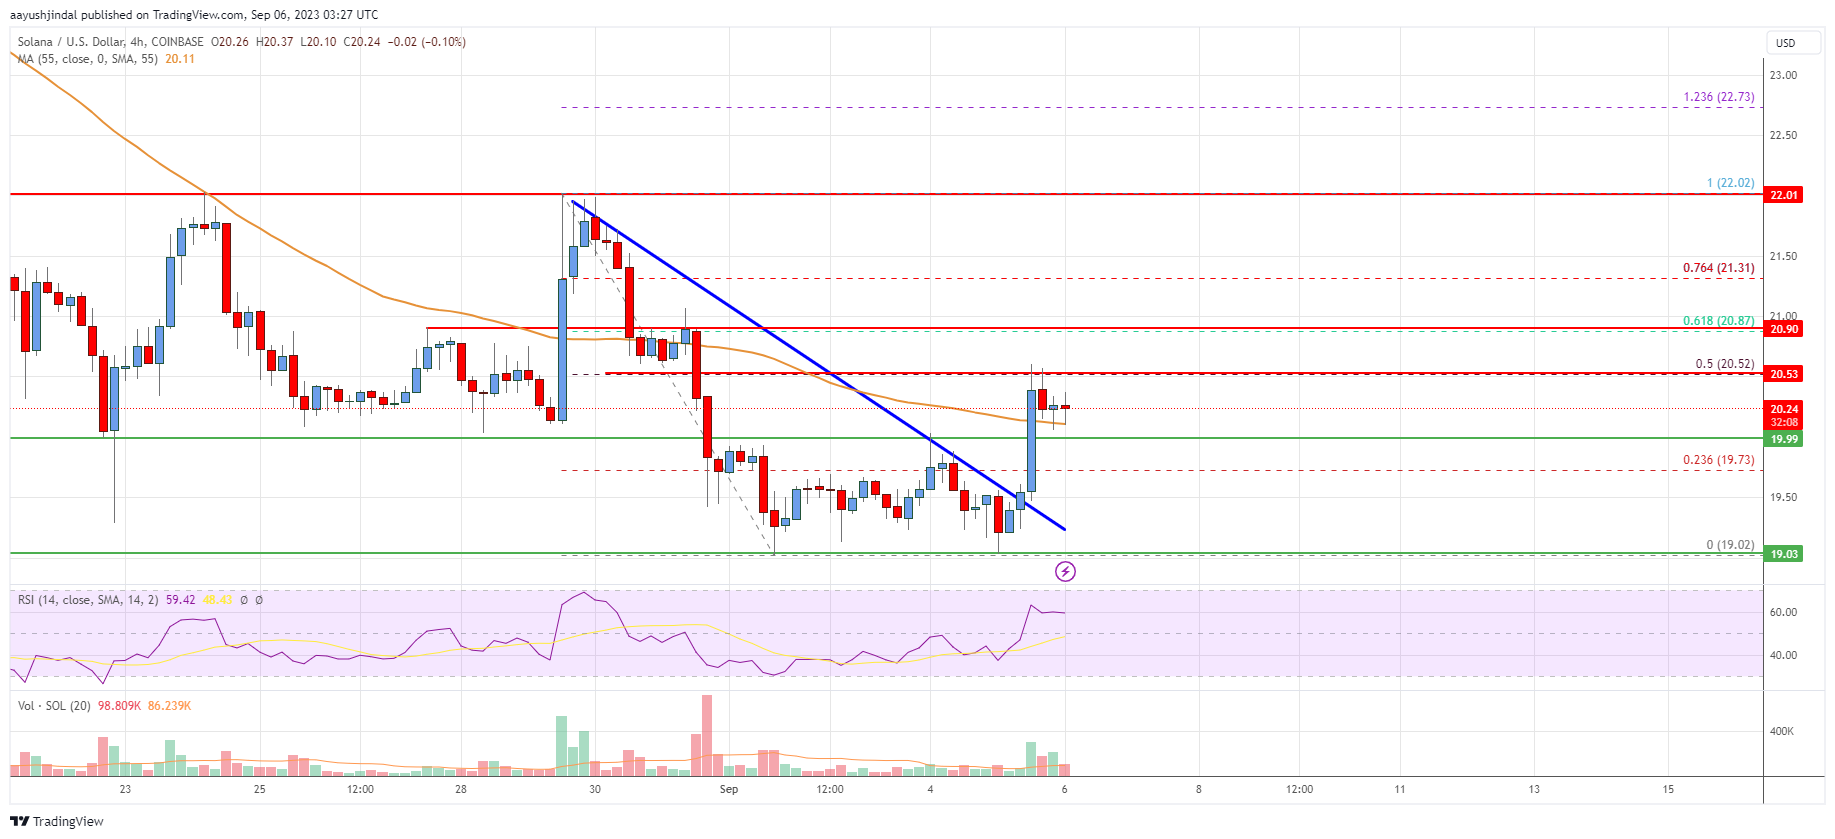
Looking at the chart, Solana price is trading above $20.00 and the 55 simple moving average (4 hours). Overall, the price must clear $20.50 and $20.80 to continue higher in the near term.
Technical Indicators
4 hours MACD – The MACD is now losing momentum in the bullish zone.
4 hours RSI (Relative Strength Index) – The RSI is now above the 50 level.
Key Support Levels – $20.00 and $19.00.
Key Resistance Levels – $20.50, $20.80, and $22.00.