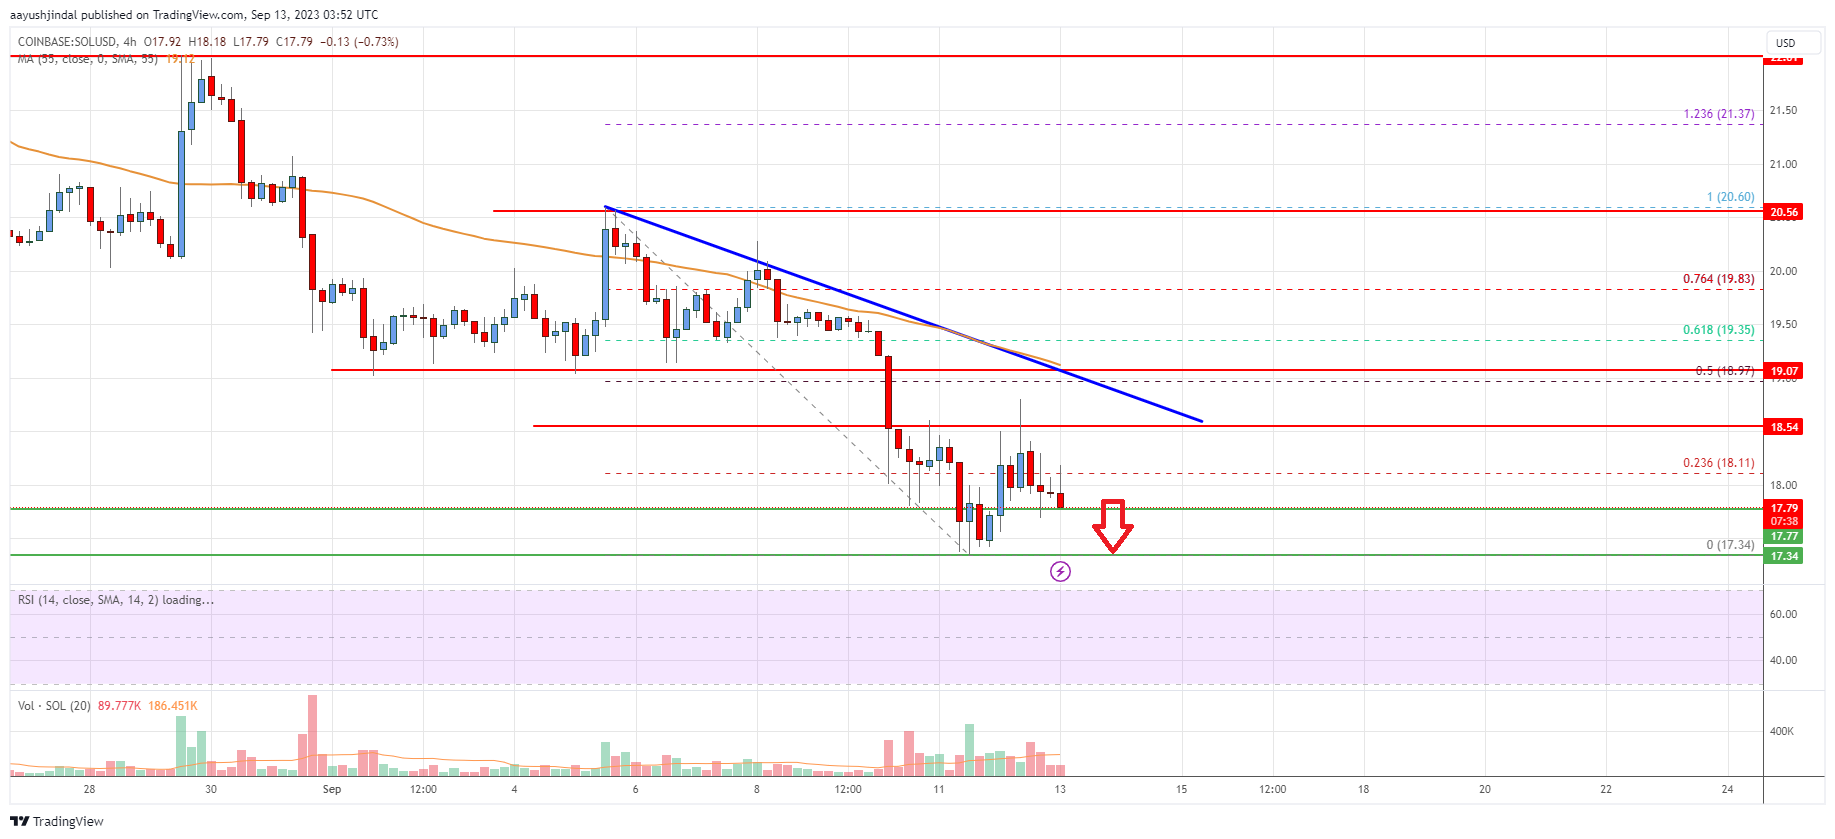
Solana price gained bearish momentum below the .00 level against the US Dollar. The price is now trading below and the 55 simple moving average (4 hours). There is a key bearish trend line forming with resistance near .50 on the 4-hour chart of the SOL/USD pair (data feed from Coinbase). The pair could recover, but the upsides might be limited above the resistance. Solana price is trading in a bearish zone below against the US Dollar, similar to Bitcoin. SOL could accelerate further lower if it stays below the .00 resistance zone. Solana (SOL) Price Analysis SOL price started a major decline below the support zone. The price gained bearish momentum below the support zone. The bears were able to push the price below the .50 and
Topics:
Aayush Jindal considers the following as important: Altcoin News, News, sol, solana, Trading
This could be interesting, too:
Bitcoin Schweiz News writes Meme Coins frühzeitig entdecken: So gelingt der Einstieg vor dem Hype
Christian Mäder writes Bitpanda startet DeFi Wallet und öffnet die Tür zu Web3
Bitcoin Schweiz News writes Bitpanda vs. Binance: Welche Bitcoin-App ist die beste für die Schweiz?
Bitcoin Schweiz News writes OpenSea: Der Marktplatz für NFTs und digitale Sammlerstücke
- Solana price gained bearish momentum below the $20.00 level against the US Dollar.
- The price is now trading below $20 and the 55 simple moving average (4 hours).
- There is a key bearish trend line forming with resistance near $18.50 on the 4-hour chart of the SOL/USD pair (data feed from Coinbase).
- The pair could recover, but the upsides might be limited above the $20 resistance.
Solana price is trading in a bearish zone below $20 against the US Dollar, similar to Bitcoin. SOL could accelerate further lower if it stays below the $19.00 resistance zone.
Solana (SOL) Price Analysis
SOL price started a major decline below the $22 support zone. The price gained bearish momentum below the $22 support zone. The bears were able to push the price below the $19.50 and $18.50 support levels.
A low was formed near $17.34 and the price is now consolidating losses. It seems like the price might attempt a recovery wave above the $18.00 level. There was already a move above the 23.6% Fib retracement level of the downward move from the $20.60 swing high to the $17.34 low.
On the upside, immediate resistance is near the $18.50 level. There is also a key bearish trend line forming with resistance near $18.50 on the 4-hour chart of the SOL/USD pair.
The next major resistance is near the $19.00 level or the 50% Fib retracement level of the downward move from the $20.60 swing high to the $17.34 low. A clear move above the $18.50 and $19.00 resistance levels might call for a steady increase.
The next major resistance sits near the $20.0 level, above which the price might rise toward $20.60. Any more gains might send SOL price toward the $22 resistance zone.
On the downside, initial support is near the $17.80 level. A downside break below the $17.80 support level might spark a major drop. In the stated case, the price may perhaps decline toward the $16.00 level.

Looking at the chart, Solana price is trading below $20 and the 55 simple moving average (4 hours). Overall, the price could recover, but the upsides might be limited above the $20 resistance.
Technical Indicators
4 hours MACD – The MACD is now gaining momentum in the bearish zone.
4 hours RSI (Relative Strength Index) – The RSI is now below the 50 level.
Key Support Levels – $17.80 and $17.40.
Key Resistance Levels – $18.50, $19.00, and $20.00.
