Technical Analysis By TradingRage Ripple has been demonstrating bullish price action against both USDT and BTC recently. Investors are once again looking optimistic about the short-term future. Yet, some signs suggest that a pullback or consolidation might be on the horizon. The USDT Paired Chart Against USDT, the price has been on a consistent rise since a rebound from the %excerpt%.5 level earlier in October. The 50-day and 200-day moving averages were also broken to the upside, confirming the bullish bias. These moving averages are currently converging near the %excerpt%.55 mark, and a bullish crossover is likely to occur soon. Adding this signal to the fact that the price has successfully broken above the %excerpt%.6 resistance level points to a potential bullish continuation. However,
Topics:
CryptoVizArt considers the following as important: Ripple (XRP) Price, XRP Analysis, xrpbtc, xrpusd
This could be interesting, too:
Jordan Lyanchev writes Ripple’s (XRP) Surge to Triggers Over Million in Short Liquidations
Jordan Lyanchev writes Trump Confirms Work on Strategic Crypto Reserve: XRP, ADA, SOL Included
Dimitar Dzhondzhorov writes Is a Major Ripple v. SEC Lawsuit Development Expected This Week? Here’s Why
Mandy Williams writes Ripple Releases Institutional DeFi Roadmap for XRP Ledger in 2025
Technical Analysis
By TradingRage
Ripple has been demonstrating bullish price action against both USDT and BTC recently. Investors are once again looking optimistic about the short-term future. Yet, some signs suggest that a pullback or consolidation might be on the horizon.
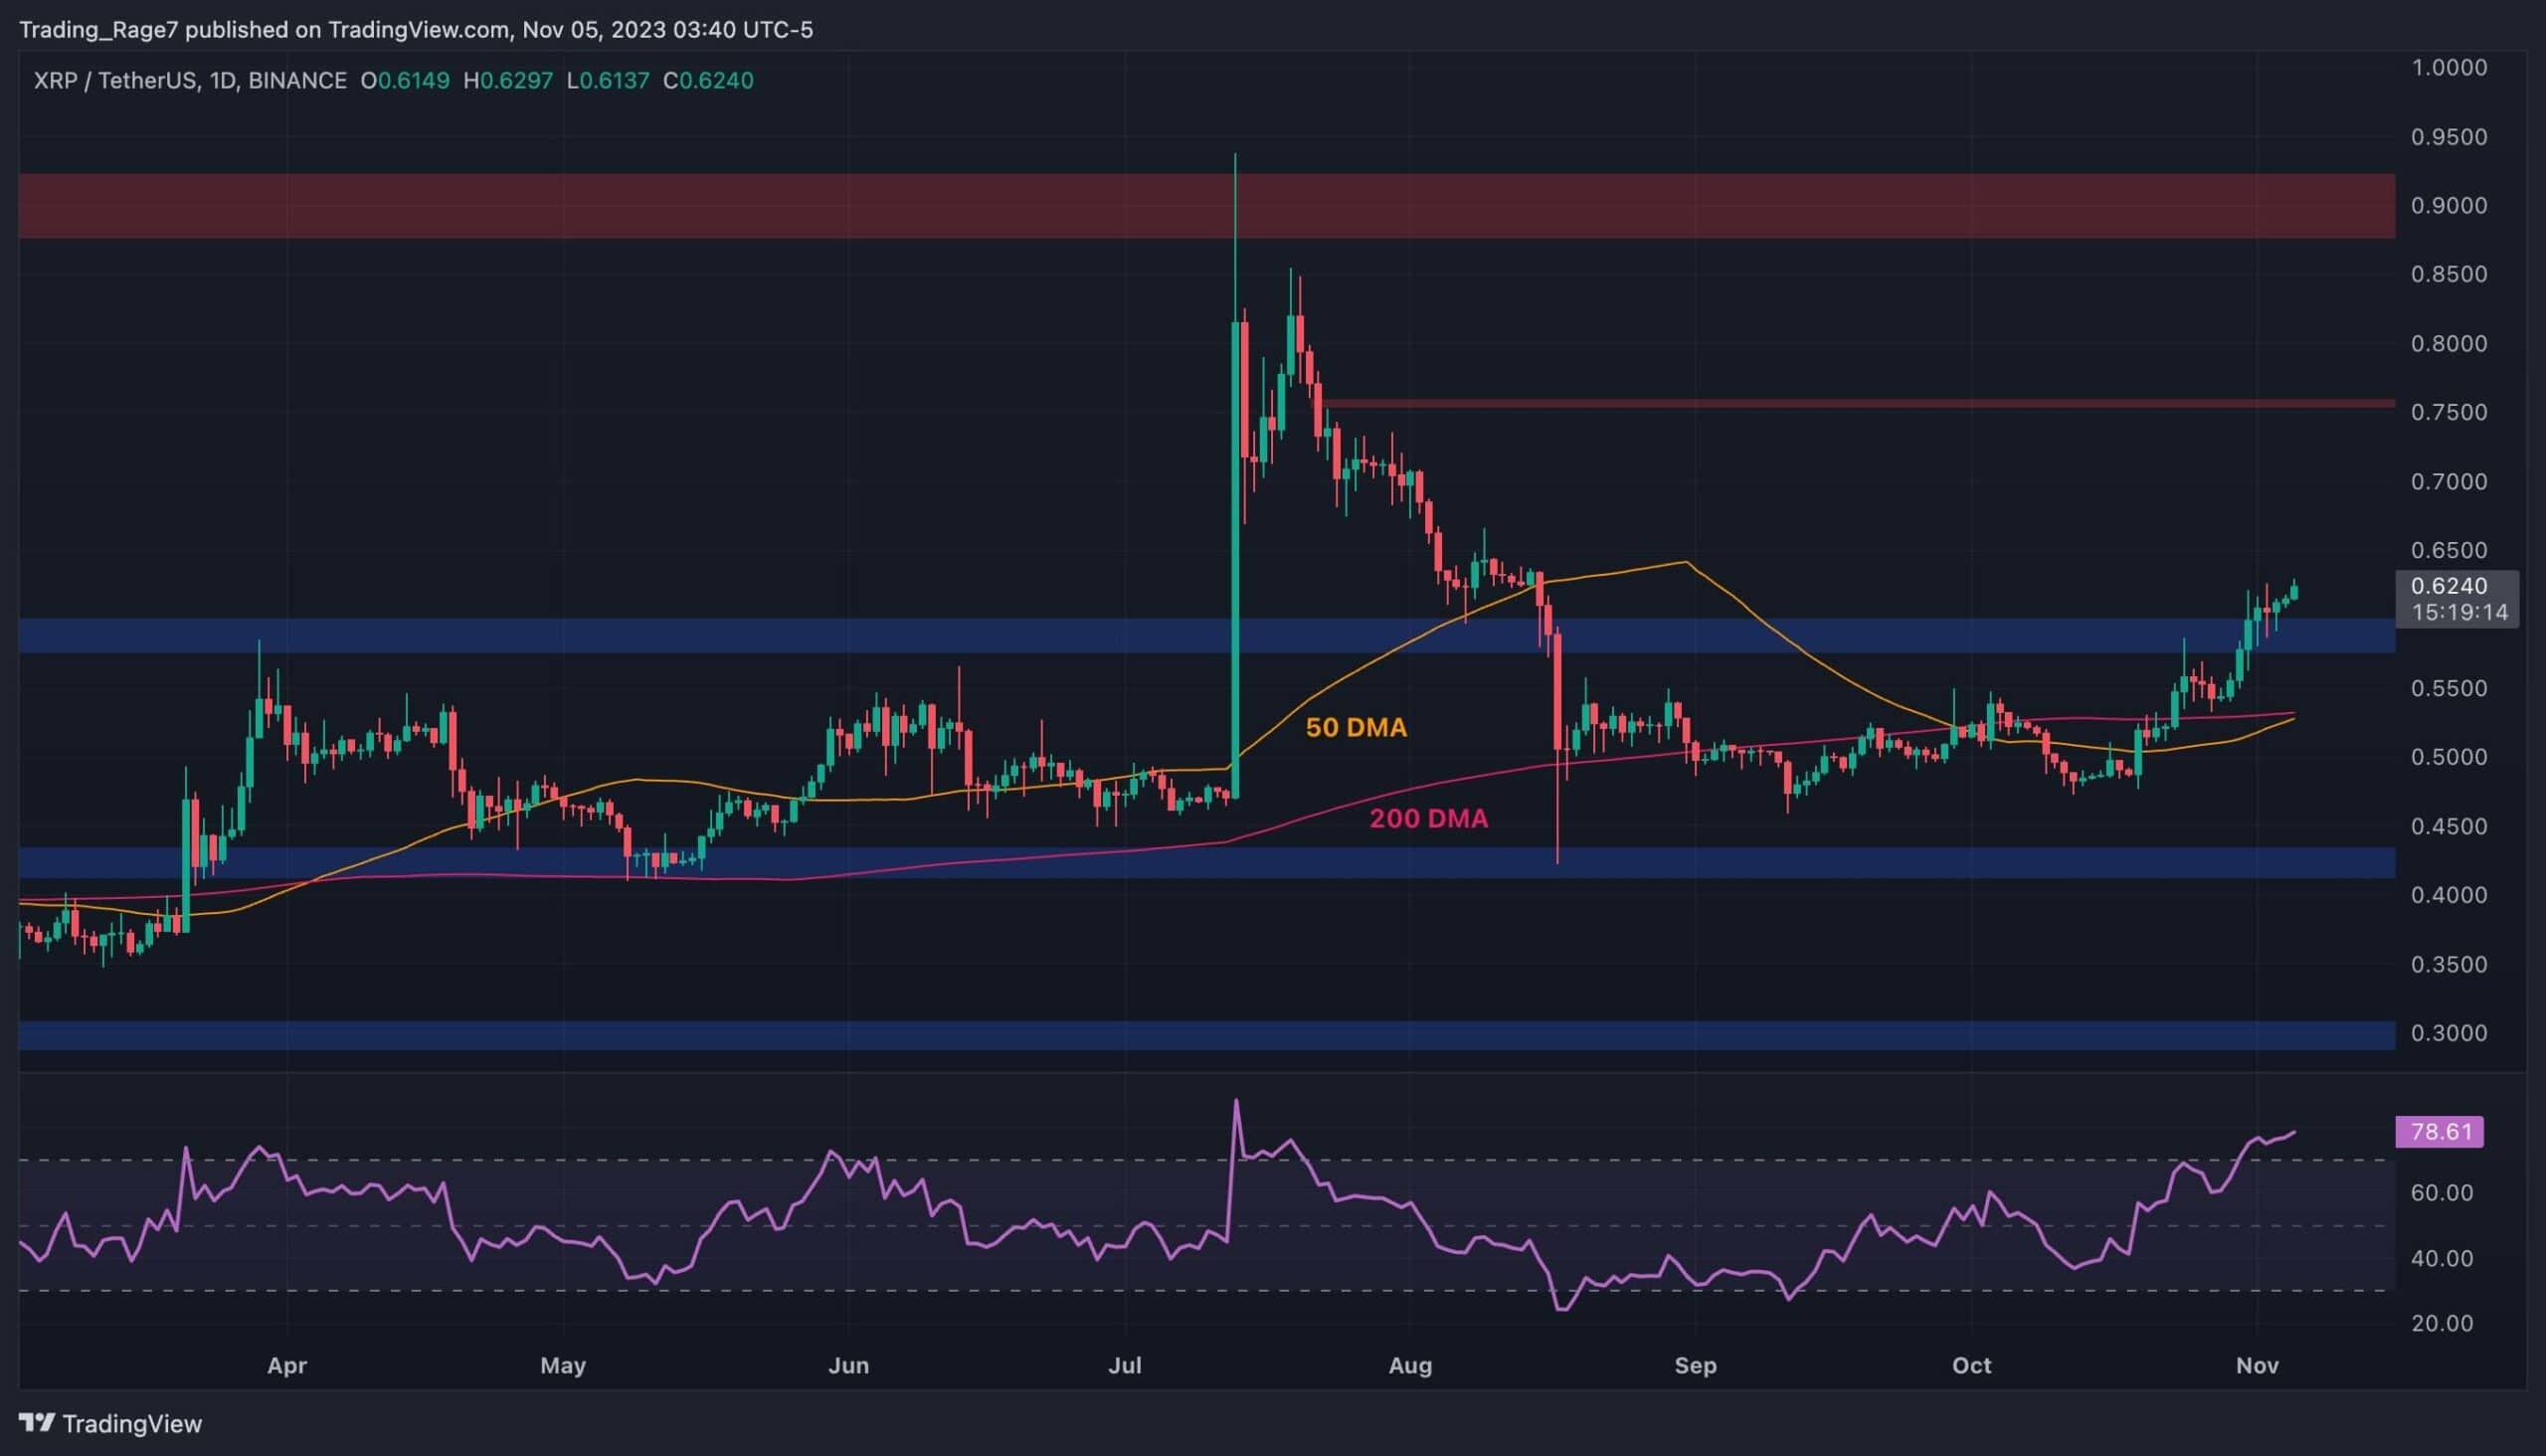
The USDT Paired Chart
Against USDT, the price has been on a consistent rise since a rebound from the $0.5 level earlier in October. The 50-day and 200-day moving averages were also broken to the upside, confirming the bullish bias.
These moving averages are currently converging near the $0.55 mark, and a bullish crossover is likely to occur soon. Adding this signal to the fact that the price has successfully broken above the $0.6 resistance level points to a potential bullish continuation.
However, the Relative Strength Index is showing a massive warning signal, being deep into the overbought territory. Therefore, a short-term pullback seems likely in the coming days.
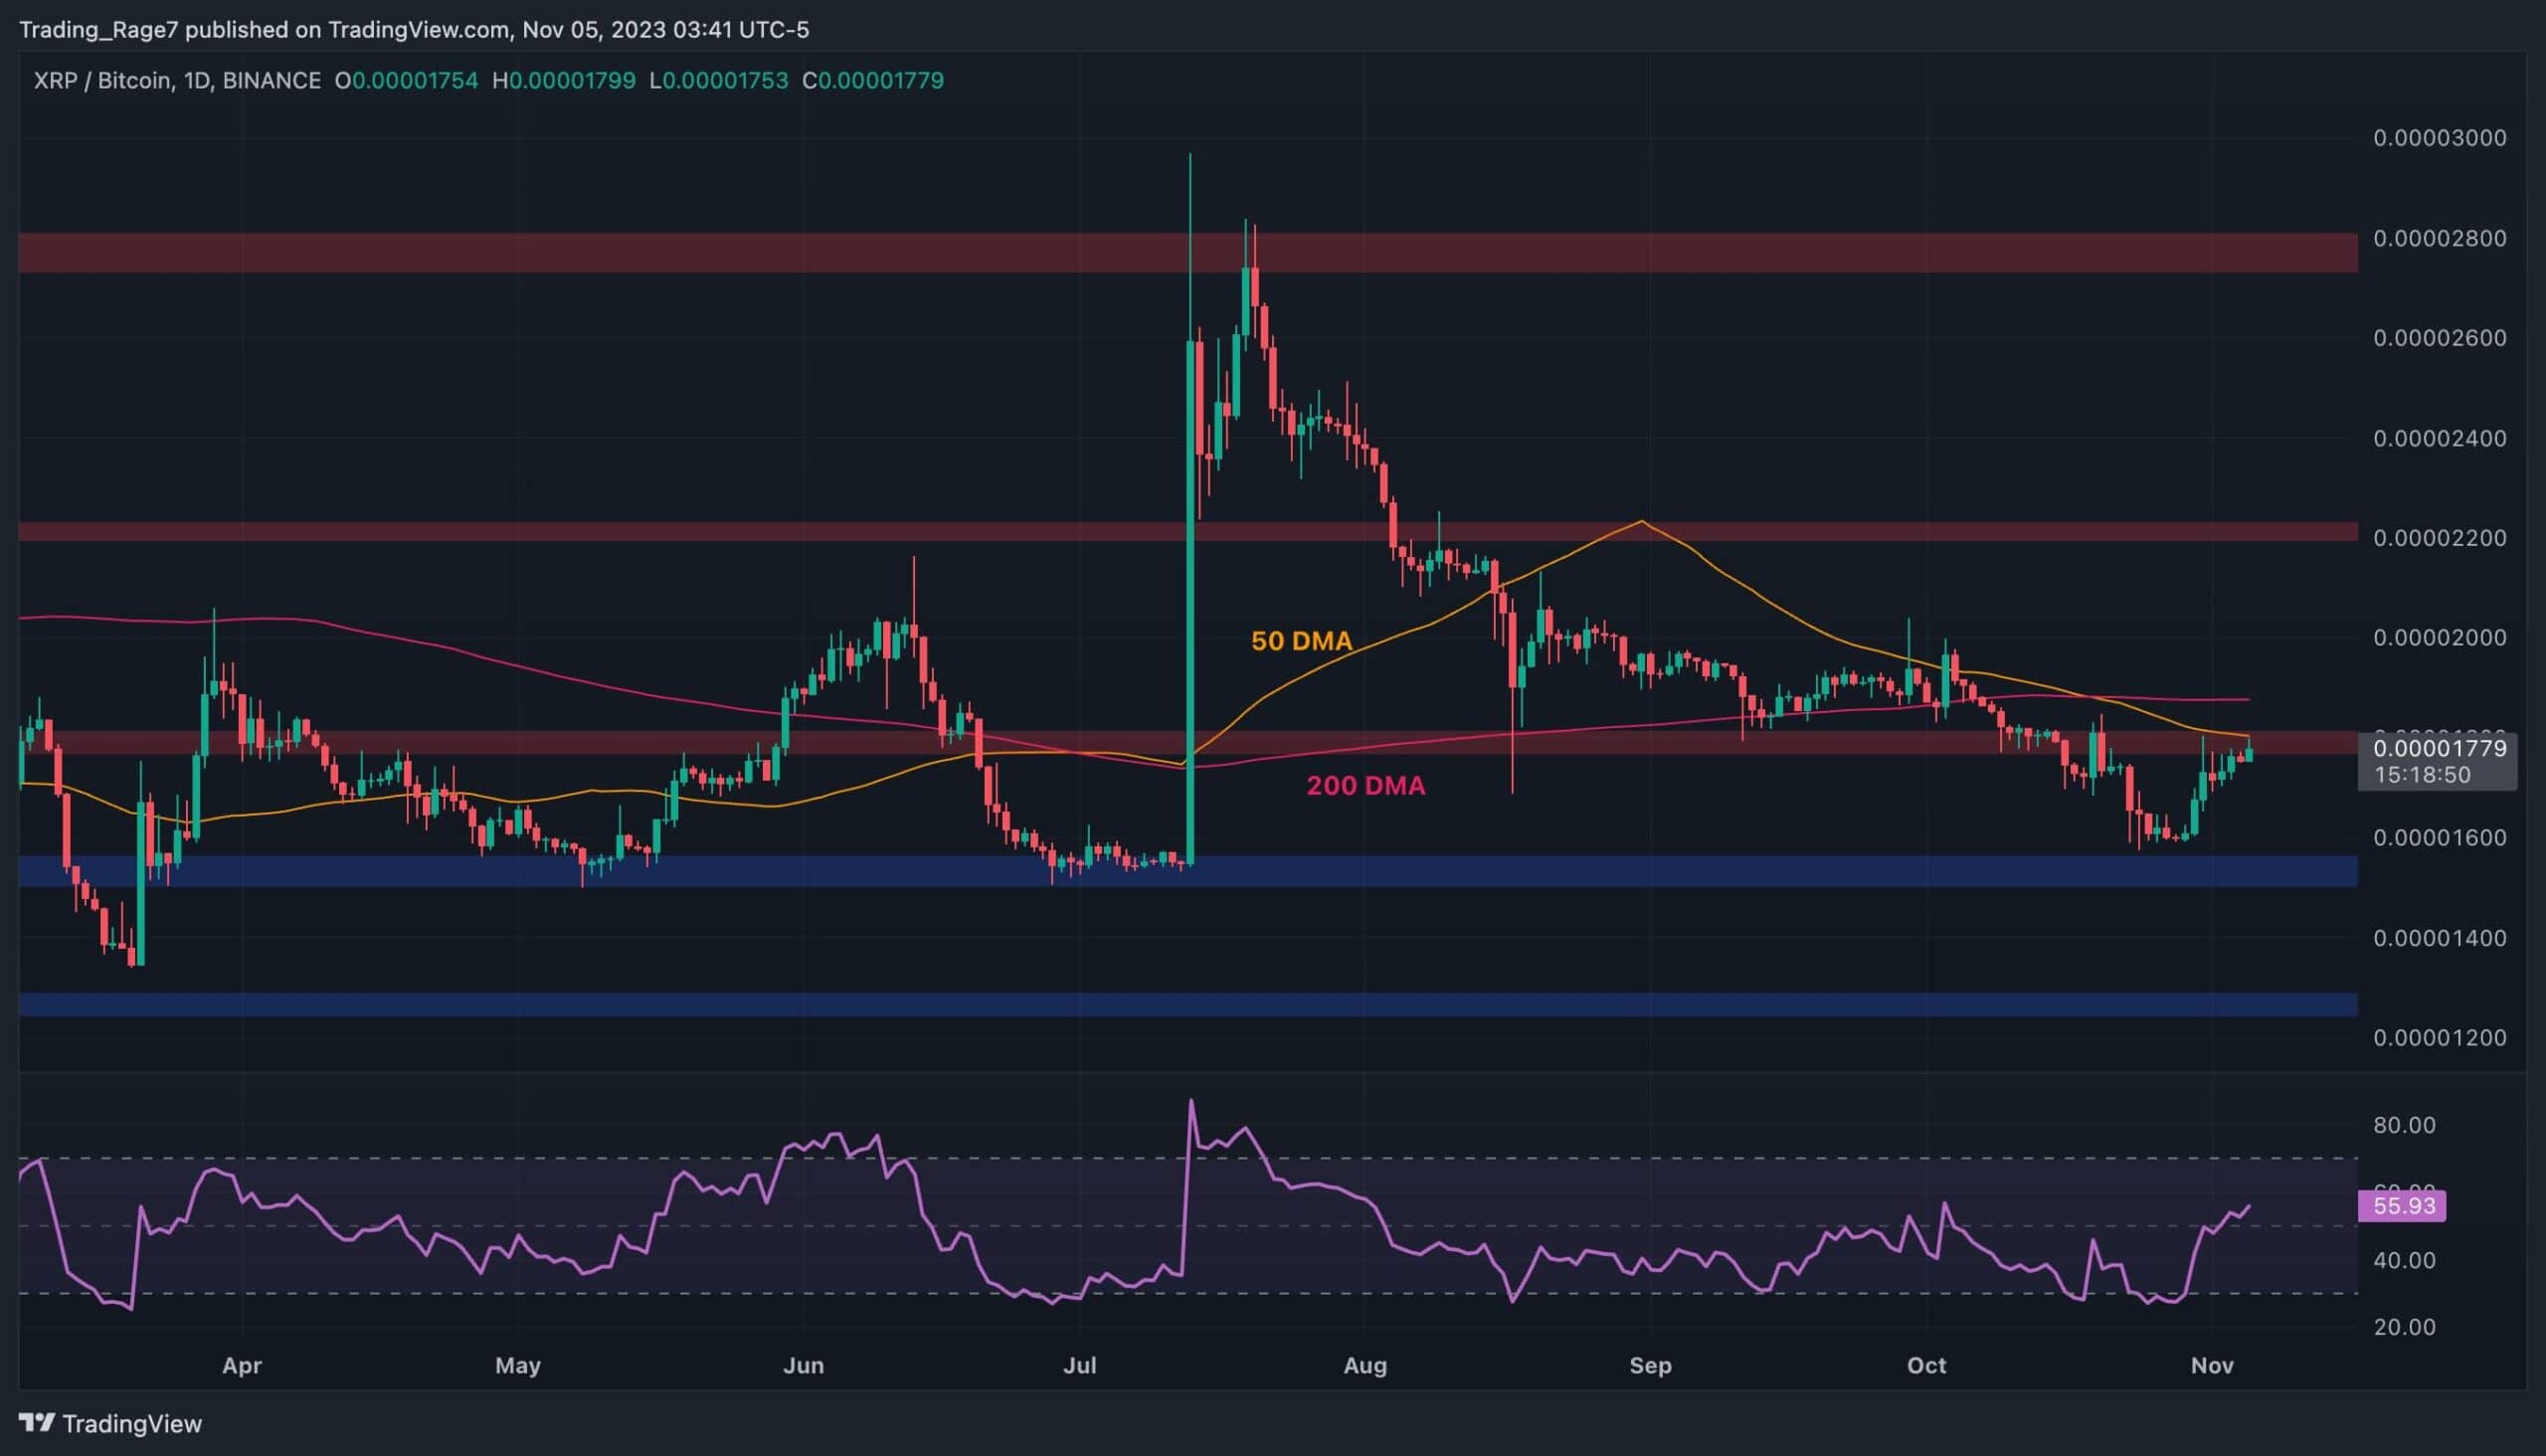
The BTC Paired Chart
XRP’s price has also been increasing against BTC, and it is currently testing a critical area. Both the 1800 SAT resistance level and the 50-day moving average nearby are now preventing it from a further rally.
The 200-day moving average located around the 1900 SAT mark is also a significant obstacle that the price has to overcome to continue its upward trajectory. With the RSI also breaking above the 50% level, bullish continuation seems even more likely.