Bitcoin’s price decline continues as the market has lost several key support zones. While many investors are worried about a deep crash, there is also the possibility for this drop to be a bear trap. Technical Analysis By TradingRage The Daily Chart The daily chart shows that the price has lost the K support level and dropped below the 200-day moving average, located around the K level. The 200-day moving average is a key indicator, as it has held the price during previous bull markets. Whenever it was broken to the downside, the bull run was over. Yet, the price is currently trading around the K level, with BTC having failed to create a daily candle close below it. The sizeable downward shadow in yesterday’s candle can indicate that the decline might have come to
Topics:
CryptoVizArt considers the following as important: Bitcoin (BTC) Price, BTC Analysis, BTCEUR, BTCGBP, btcusd, btcusdt
This could be interesting, too:
Chayanika Deka writes XRP, SOL, and ADA Inclusion in US Crypto Reserve Pushes Traders on Edge
Chayanika Deka writes Why Arthur Hayes Is Bullish on Bitcoin Under Trump’s Economic Strategy
Mandy Williams writes Why the Bitcoin Market Is Stuck—and the Key Metric That Could Change It: CryptoQuant CEO
Wayne Jones writes Metaplanet Acquires 156 BTC, Bringing Total Holdings to 2,391
Bitcoin’s price decline continues as the market has lost several key support zones. While many investors are worried about a deep crash, there is also the possibility for this drop to be a bear trap.
Technical Analysis
By TradingRage
The Daily Chart
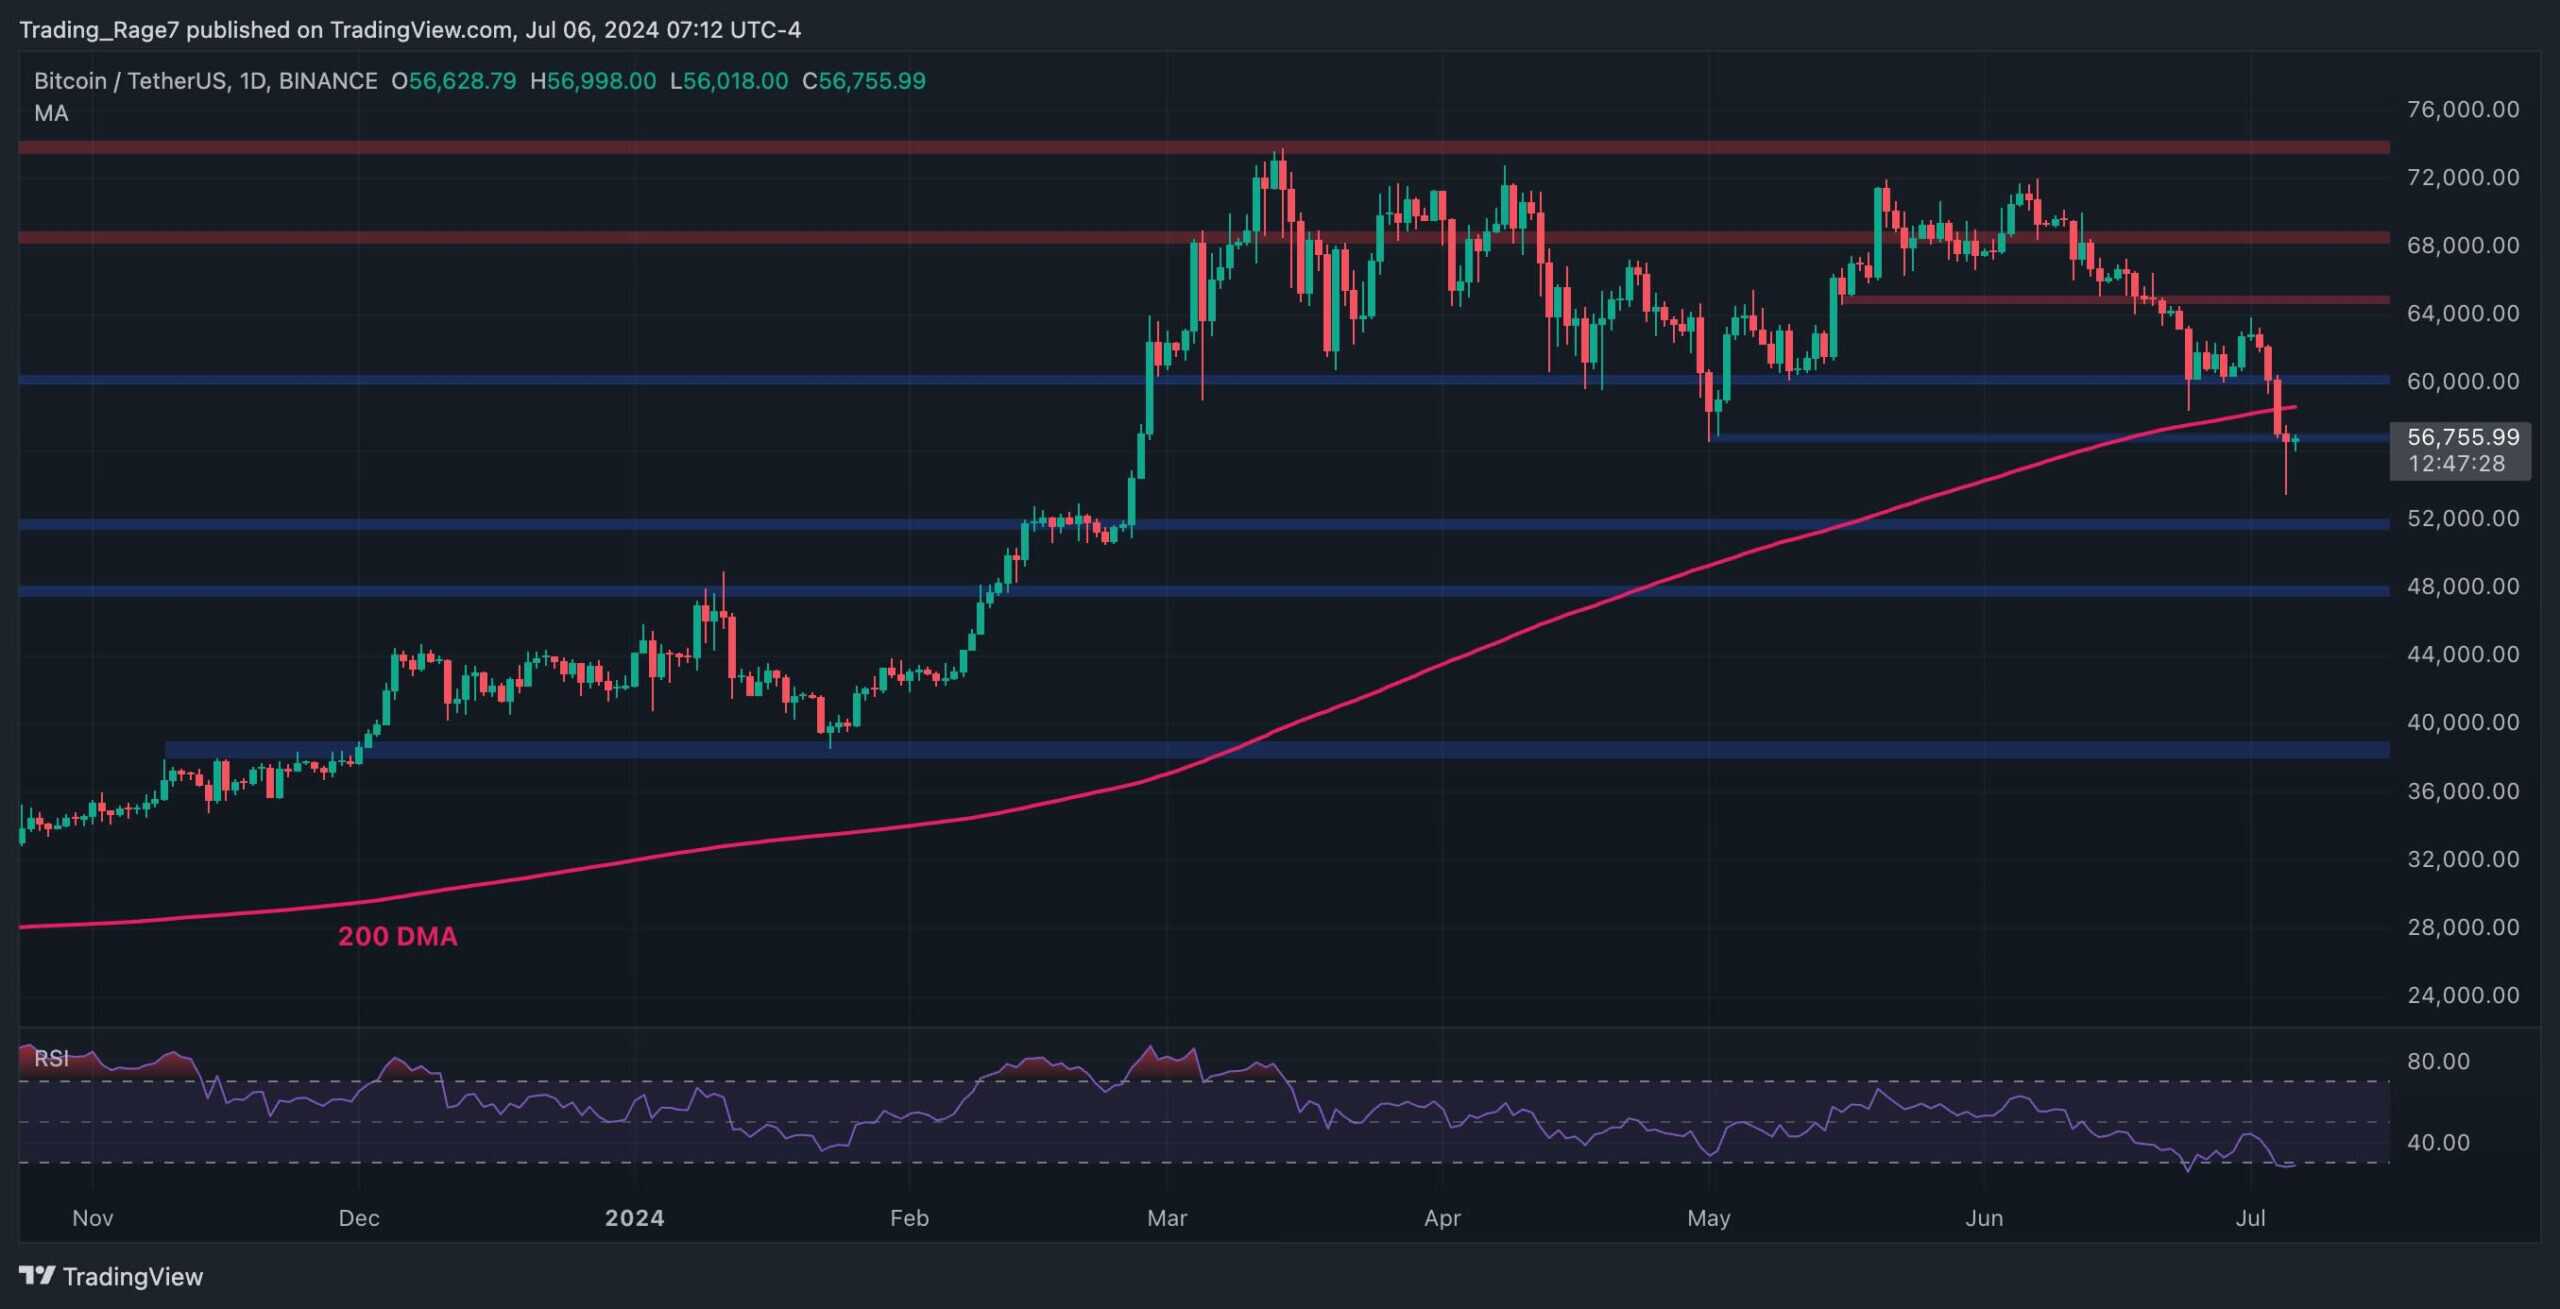
The daily chart shows that the price has lost the $60K support level and dropped below the 200-day moving average, located around the $58K level.
The 200-day moving average is a key indicator, as it has held the price during previous bull markets. Whenever it was broken to the downside, the bull run was over. Yet, the price is currently trading around the $57K level, with BTC having failed to create a daily candle close below it.
The sizeable downward shadow in yesterday’s candle can indicate that the decline might have come to a halt, and consolidation or even recovery is probable in the short term.
The 4-Hour Chart
The 4-hour chart shows a clear bearish trend for Bitcoin in the last few weeks. The price has consistently made lower highs and lows, breaking below multiple support levels.
Currently, the price is retesting the $57K level from below, and if it successfully reclaims the level, it will spark hopes for a bullish rebound in the coming weeks.
With the RSI recovering from the oversold region, this might be the case. However, a reversal cannot still be expected as long as BTC is trading below the critical $60K level.

On-Chain Analysis
By TradingRage
Bitcoin True Hashrate Drawdown
While price analysis can only help suggest short-term market behavior, more can be gained from on-chain analysis, which focuses on the fundamentals of the BTC network.
This chart demonstrates the Bitcoin hashrate drawdown, which measures drops in the relative computing power of the network. The hashrate drawdown has reached values even lower than the bear market low of around $16K, pointing to a massive capitulation by the miners.
While the miners exiting the market is never a good sign, it could indicate a potential ending for the recent downtrend, as it did in January 2023.
Therefore, while many fear the future, some hardcore Bitcoin believers might be accumulating as hard as possible. Meanwhile, only time will tell whether we have reached the bottom or the bear market is only beginning.
