Bitcoin price started a downside correction from the ,850 zone against the US Dollar. The price is now trading above ,800 and the 55 simple moving average (4 hours). There is a key contracting triangle forming with resistance near ,320 on the 4-hour chart of the BTC/USD pair (data feed from Coinbase). The pair could start a fresh increase if it stays above the ,200 support zone. Bitcoin price is correcting lower below ,500 against the US Dollar. BTC might eye another increase if the bulls remain active above the ,200 zone. Bitcoin Price Analysis Bitcoin price extended its increase above the ,000 level and rallied toward the ,000 resistance zone. A high was formed near ,872 before the price started a downside correction. There was a
Topics:
Aayush Jindal considers the following as important: Bitcoin News, BTC, News, Trading
This could be interesting, too:
Christian Mäder writes Bitcoin-Transaktionsgebühren auf historischem Tief: Warum jetzt der beste Zeitpunkt für günstige Überweisungen ist
Bitcoin Schweiz News writes Meme Coins frühzeitig entdecken: So gelingt der Einstieg vor dem Hype
Christian Mäder writes Das Bitcoin-Reserve-Rennen der US-Bundesstaaten: Wer gewinnt das Krypto-Wettrüsten?
Bitcoin Schweiz News writes Bitpanda vs. Binance: Welche Bitcoin-App ist die beste für die Schweiz?
- Bitcoin price started a downside correction from the $43,850 zone against the US Dollar.
- The price is now trading above $42,800 and the 55 simple moving average (4 hours).
- There is a key contracting triangle forming with resistance near $43,320 on the 4-hour chart of the BTC/USD pair (data feed from Coinbase).
- The pair could start a fresh increase if it stays above the $42,200 support zone.
Bitcoin price is correcting lower below $43,500 against the US Dollar. BTC might eye another increase if the bulls remain active above the $42,200 zone.
Bitcoin Price Analysis
Bitcoin price extended its increase above the $43,000 level and rallied toward the $44,000 resistance zone. A high was formed near $43,872 before the price started a downside correction. There was a clear move below the $43,500 and $43,200 levels.
The bears were able to push the price below the 23.6% Fib retracement level of the upward move from the $38,501 swing low to the $43,872 high. The price even spiked below $42,200.
Bitcoin is now trading above $42,800 and the 55 simple moving average (4 hours). There is also a key contracting triangle forming with resistance near $43,320 on the 4-hour chart of the BTC/USD pair. Immediate resistance on the upside is near the $43,320 level.
The next major resistance might be near the $43,500 zone. A clear move above the $43,500 level might send the price toward $44,500, above which the price might rise toward the $45,000 level. Any more gains might push the price toward the $46,500 zone.
If there is no upside break, the price might continue to decline below the $42,600 level. The first major support is $41,200 or the 50% Fib retracement level of the upward move from the $38,501 swing low to the $43,872 high.
The next key support is near the $40,500 level, below which the price might accelerate lower. In the stated case, the price could decline toward the $38,500 level. Any more losses might send the price toward the $36,000 level.
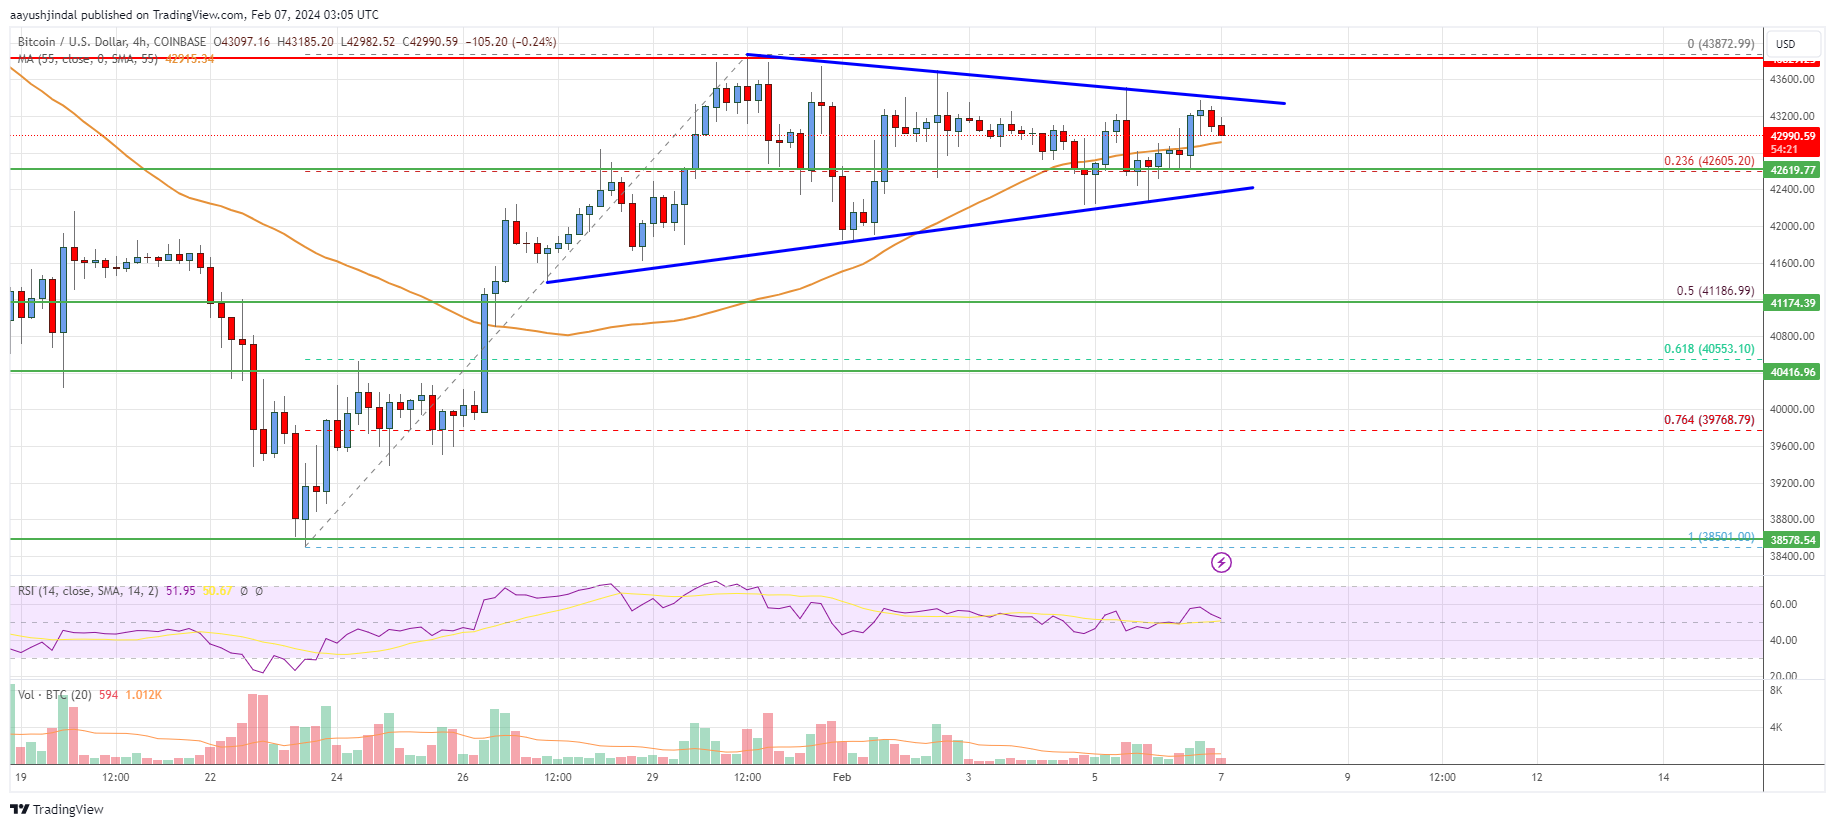
Looking at the chart, Bitcoin price is clearly trading above $42,500 and the 55 simple moving average (4 hours). Overall, the price could start a fresh increase if it stays above the $42,200 support zone.
Technical Indicators
4 hours MACD – The MACD is now losing momentum in the bullish zone.
4 hours RSI (Relative Strength Index) – The RSI is now above the 50 level.
Key Support Levels – $42,600 and $41,200.
Key Resistance Levels – $43,320, $43,500, and $44,500.