EOS price started a downside correction from the .36 zone against the US Dollar. The price is now trading above .100 and the 55 simple moving average (4 hours). There is a key contracting triangle forming with support near .160 on the 4-hour chart of the EOS/USD pair (data feed from Coinbase). The pair could continue to move down if it stays below the .20 and .250 resistance levels. EOS price is declining below .200 against the US Dollar, like Bitcoin. The price could attempt a fresh increase unless there is a break below .100. EOS Price Analysis Earlier this month, EOS price climbed higher above the .00 resistance zone against the US Dollar. The price surpassed the .100 level and settled above the 55 simple moving average (4 hours). A high
Topics:
Aayush Jindal considers the following as important: Altcoin News, News, Trading
This could be interesting, too:
Bitcoin Schweiz News writes Meme Coins frühzeitig entdecken: So gelingt der Einstieg vor dem Hype
Bitcoin Schweiz News writes Bitpanda vs. Binance: Welche Bitcoin-App ist die beste für die Schweiz?
Bilal Hassan writes Morocco Cracks Down on Crypto Property Deals
Bilal Hassan writes Crypto Becomes a U.S. ‘Weapon,’ Says CryptoQuant CEO
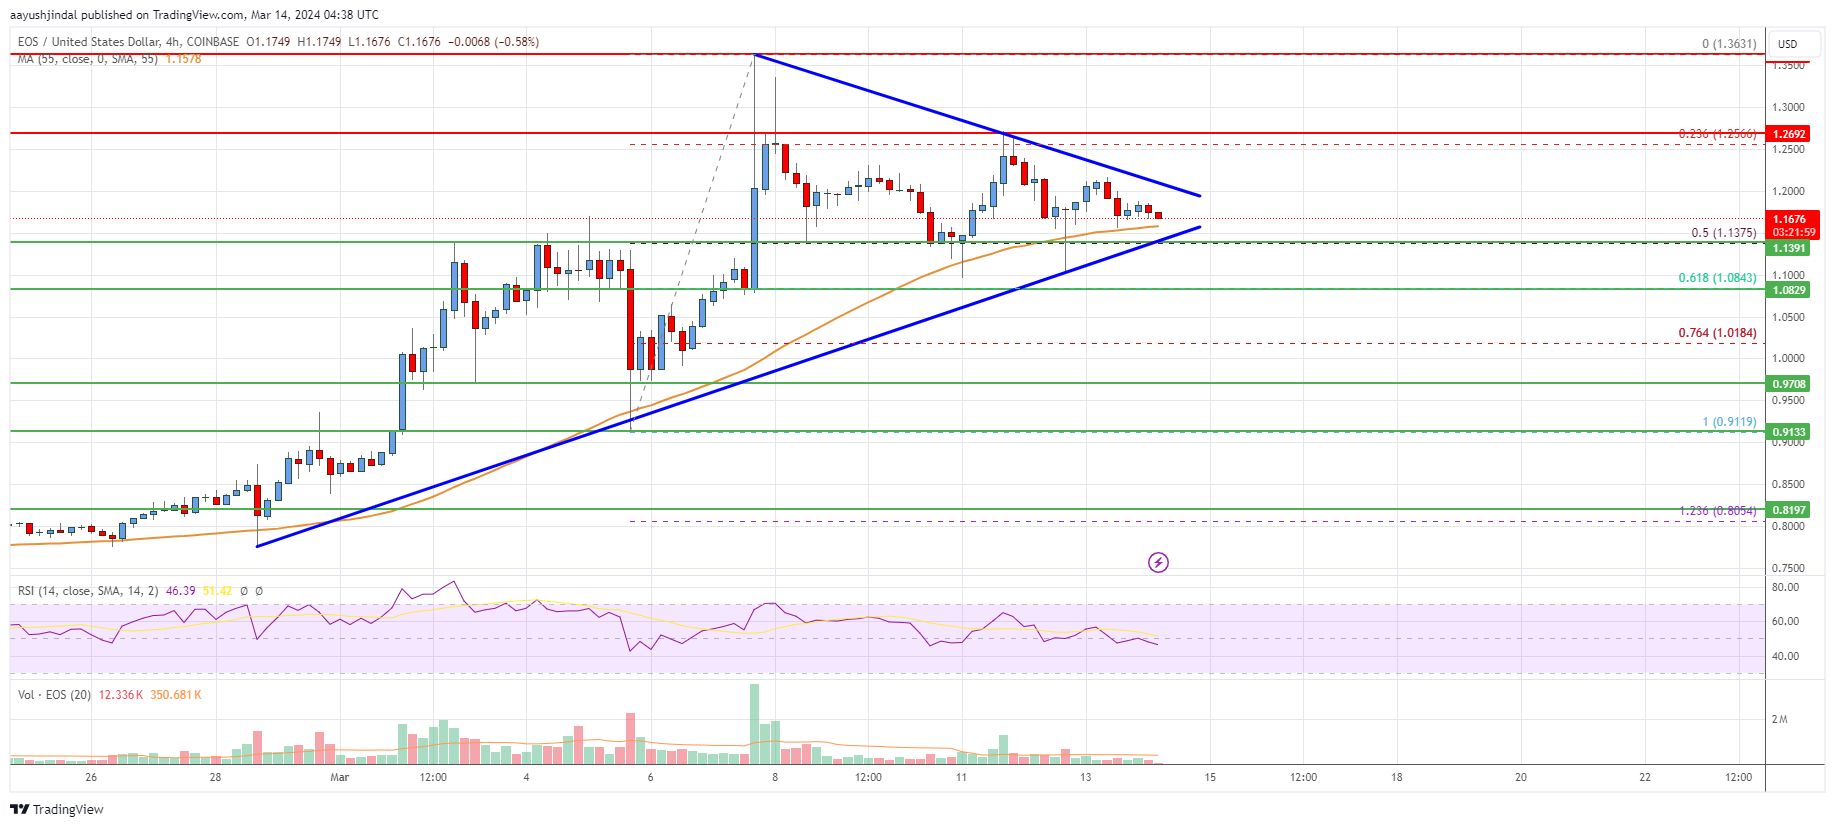
- EOS price started a downside correction from the $1.36 zone against the US Dollar.
- The price is now trading above $1.100 and the 55 simple moving average (4 hours).
- There is a key contracting triangle forming with support near $1.160 on the 4-hour chart of the EOS/USD pair (data feed from Coinbase).
- The pair could continue to move down if it stays below the $1.20 and $1.250 resistance levels.
EOS price is declining below $1.200 against the US Dollar, like Bitcoin. The price could attempt a fresh increase unless there is a break below $1.100.
EOS Price Analysis
Earlier this month, EOS price climbed higher above the $1.00 resistance zone against the US Dollar. The price surpassed the $1.100 level and settled above the 55 simple moving average (4 hours).
A high was formed near $1.3631 before the price started a downside correction. The price declined below the $1.250 support zone. There was a drop below the 50% Fib retracement level of the upward move from the $0.9119 swing low to the $1.3631 high.
However, the bulls were active near the $1.150 support. The price is also stable above the 61.8% Fib retracement level of the upward move from the $0.9119 swing low to the $1.3631 high.
Besides, there is a key contracting triangle forming with support near $1.160 on the 4-hour chart of the EOS/USD pair. It is now trading above $1.100 and the 55 simple moving average (4 hours). On the downside, immediate support is near the $1.160 level.
The next key support is near the $1.135 level. If there is a downside break below the $1.1350 support, the price could revisit the $1.100 support.
On the upside, immediate resistance is near the $1.200 level. The first major resistance is near the $1.250 level, above which the price could rise steadily toward the $1.320 level. Any more gains might send the price toward the $1.350 level.
Looking at the chart, EOS price is now trading above the $1.120 level and the 55 simple moving average (4 hours). Overall, the price could continue to move down if it stays below the $1.20 and $1.250 resistance levels.
Technical indicators
4 hours MACD – The MACD for EOS/USD is losing pace in the bullish zone.
4 hours RSI (Relative Strength Index) – The RSI is now below the 50 level.
Major Support Levels – $1.160 and $1.1350.
Major Resistance Levels – $1.200 and $1.250.